R + ggplot2 Graph Catalog(转)

library(ggplot2)

library(reshape2)

library(grid)

this_base = "fig08-15_population-data-by-county"

my_data = data.frame(

  Race = c("White", "Latino", "Black", "Asian American", "All Others"),

  Bronx = c(194000, 645000, 415000, 38000, 40000),

  Kings = c(855000, 488000, 845000, 184000, 93000),

  New.York = c(703000, 418000, 233000, 143000, 39000),

  Queens = c(733000, 556000, 420000, 392000, 128000),

  Richmond = c(317000, 54000, 40000, 24000, 9000),

  Nassau = c(986000, 133000, 129000, 62000, 24000),

  Suffolk = c(1118000, 149000, 92000, 34000, 26000),

  Westchester = c(592000, 145000, 123000, 41000, 23000),

  Rockland = c(205000, 29000, 30000, 16000, 6000),

  Bergen = c(638000, 91000, 43000, 94000, 18000),

  Hudson = c(215000, 242000, 73000, 57000, 22000),

  Passiac = c(252000, 147000, 60000, 18000, 12000))

my_data_long = melt(my_data, id = "Race",

                     variable.name = "county", value.name = "population")

my_data_long$county = factor(

  my_data_long$county, c("New.York", "Queens", "Kings", "Bronx", "Nassau",

                         "Suffolk", "Hudson", "Bergen", "Westchester",

                         "Rockland", "Richmond", "Passiac"))

my_data_long$Race =

  factor(my_data_long$Race,

         rev(c("White", "Latino", "Black", "Asian American", "All Others")))

p = ggplot(my_data_long, aes(x = population / 1000, y = Race)) +

  geom_point() +

  facet_wrap(~ county, ncol = 3) +

  scale_x_continuous(breaks = seq(0, 1000, 200),

                     labels = c(0, "", 400, "", 800, "")) +

  labs(x = "Population (thousands)", y = NULL) +

  ggtitle("Fig 8.15 Population Data by County") +

  theme_bw() +

  theme(panel.grid.major.y = element_line(colour = "grey60"),

        panel.grid.major.x = element_blank(),

        panel.grid.minor = element_blank(),

        panel.margin = unit(0, "lines"),

        plot.title = element_text(size = rel(1.1), face = "bold", vjust = 2),

        strip.background = element_rect(fill = "grey80"),

        axis.ticks.y = element_blank())

p

ggsave(paste0(this_base, ".png"),

       p, width = 6, height = 8)

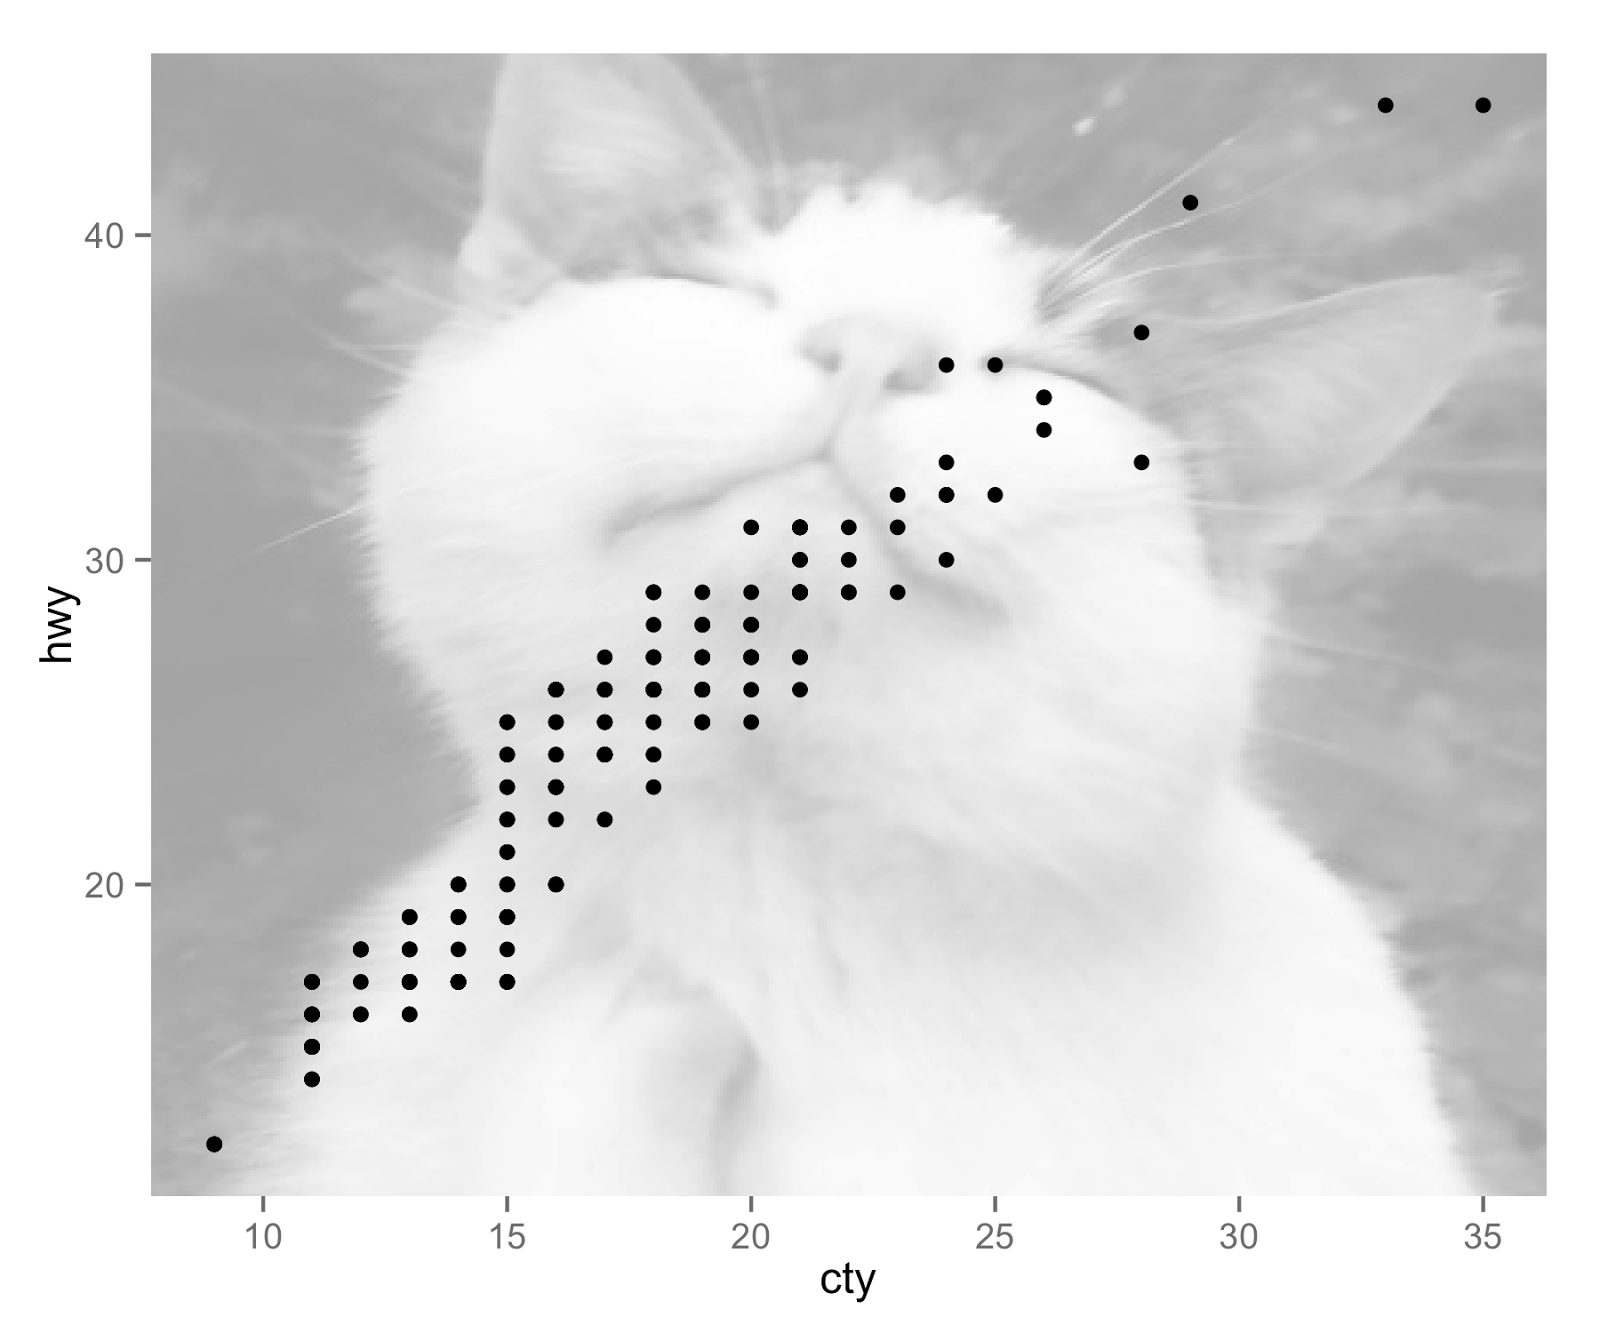
add_cat() function from Hilary Parker’s cats package to fetch a random cat picture from the internet and create an annotation_raster layer to add to your ggplot2 plot, doesn’t necessarily mean you shoulddo such a thing for a publication-quality figure. But if you ever needed to know how, this R graph catalog can help you out.library(ggplot2)
this_base = "0002_add-background-with-cats-package"
## devtools::install_github("hilaryparker/cats")
library(cats)
## library(help = "cats")
p = ggplot(mpg, aes(cty, hwy)) +
add_cat() +
geom_point()
p
ggsave(paste0(this_base, ".png"), p, width = 6, height = 5)
R + ggplot2 Graph Catalog(转)的更多相关文章
- R ggplot2 线性回归
摘自 http://f.dataguru.cn/thread-278300-1-1.html library(ggplot2) x=1:10y=rnorm(10)a=data.frame(x= x, ...
- R & ggplot2 & Excel绘图(直方图/经验分布图/QQ图/茎叶图/箱线图)实例
持续更新~ 散点图 条形图 文氏图 饼图 盒型图 频率直方图 热图 PCA图 3D图 火山图 分面图 分面制作小多组图 地图 练习数据: year count china Ame jap '12 2. ...
- R:ggplot2数据可视化——进阶(1)
,分为三个部分,此篇为Part1,推荐学习一些基础知识后阅读~ Part 1: Introduction to ggplot2, 覆盖构建简单图表并进行修饰的基础知识 Part 2: Customiz ...
- R:ggplot2数据可视化——基础知识
1 安装 # 获取ggplot2 最容易的就是下载整个tidyverse: install.packages("tidyverse") # 也可以选择只下载ggplot2: ins ...
- R:ggplot2数据可视化——进阶(3)
Part 3: Top 50 ggplot2 Visualizations - The Master List, 结合进阶1.2内容构建图形 有效的图形是: 不扭曲事实 传递正确的信息 简洁优雅 美观 ...
- R:ggplot2数据可视化——进阶(2)
Part 2: Customizing the Look and Feel, 更高级的自定义化,比如说操作图例.注记.多图布局等 # Setup options(scipen=999) librar ...
- R ggplot2 翻转坐标
p <- ggplot(mpg, aes(class, hwy)) p + geom_boxplot() p + geom_boxplot() + coord_flip()
- R ggplot2 改变颜色
p<-ggplot(iris,aes(Petal.Length,Petal.Width,color=Species))+geom_point()cols=c("red",&q ...
- R语言中文社区历史文章整理(类型篇)
R语言中文社区历史文章整理(类型篇) R包: R语言交互式绘制杭州市地图:leafletCN包简介 clickpaste包介绍 igraph包快速上手 jiebaR,从入门到喜欢 Catterpl ...
随机推荐
- asp.net core 编译mvc,routing,security源代码进行本地调试
因为各种原因,需要查看asp.net core mvc的源代码来理解运行机制等等,虽说源代码查看已经能很好的理解了.但是能够直接调试还是最直观的.所有就有了本次尝试. 因调试设置源代码调试太辍笔,所以 ...
- 函数求值(swust oj0274)
函数求值(0274) Time limit(ms): 1000 Memory limit(kb): 65535 Submission: 1767 Accepted: 324 Accepted 14级卓 ...
- 使用Dockerfile制作自己的Docker镜像
一.背景 一直以来的开发流程都是先从Docker Hub中获取到基础镜像,之后在这个镜像的基础上做开发,以满足一定的需求或者提供某种服务,并由此产生新的镜像,然后就可以push到Docker Hub中 ...
- 第三章 Struts2配置详解
3.1 Struts2执行过程 1.获取Struts2资源 2.在应用程序中导入Struts2的类库 3.在web.xml中配置StrutsPrepareAndExecuteFilt ...
- nginx源码编译问题
[root@localhost nginx-1.7.4]# ./configure checking for OS + Linux 2.6.32-431.el6.x86_64 x86_64 check ...
- mvc中razor的一个bug
具体东西就不多说了,所有编译,代码都是木有问题的. 结果预览页面的时候竟然告诉我编译错误,尼玛这不科学啊. 来看看错误页面 看着问题大概应该是缺少} ,或者多了个} 倒置的编译错误才对,但是编译生成完 ...
- smarty的缓冲
首先在main文件夹里面建一个文件 huancun.php 然后在template文件夹里面建一个文件 huancun.html huancun.php中的内容为: require(" ...
- 作死上CODEVS,青铜题
题面:输入一列整数,输出它们的总和.最大值.最小值.并从大到小输出. 先上一波伪代码,认真地做一波数组排序题. #include<stdio.h> #include<math.h&g ...
- undo表空间
undo表空间undo表空间的管理,主要包括创建.删除.修改.切换.其中需要注意的是不能在undo表空间创建数据库对象,还有就是只能是单文件或大文件表空间. 创建创建主要有两种方法,一种是在创建数据库 ...
- 基于header的一些常用指令详解
header常用指令 header分为三部分: 第一部分为HTTP协议的版本(HTTP-Version): 第二部分为状态代码(Status): 第三部分为原因短语(Reason-Phrase) ...