SciTech-Mathematics-Probability+Statistics-Causation vs. Correlation: From Correlation to Causation: Deep Dive into Data Interpretation
https://www.statology.org/from-correlation-to-causation-deep-dive-into-data-interpretation/
From Correlation to Causation: Deep Dive into Data Interpretation
Correlation and Causation are key concepts in data analysis.
However, correlation doesn't mean causation.
For example:
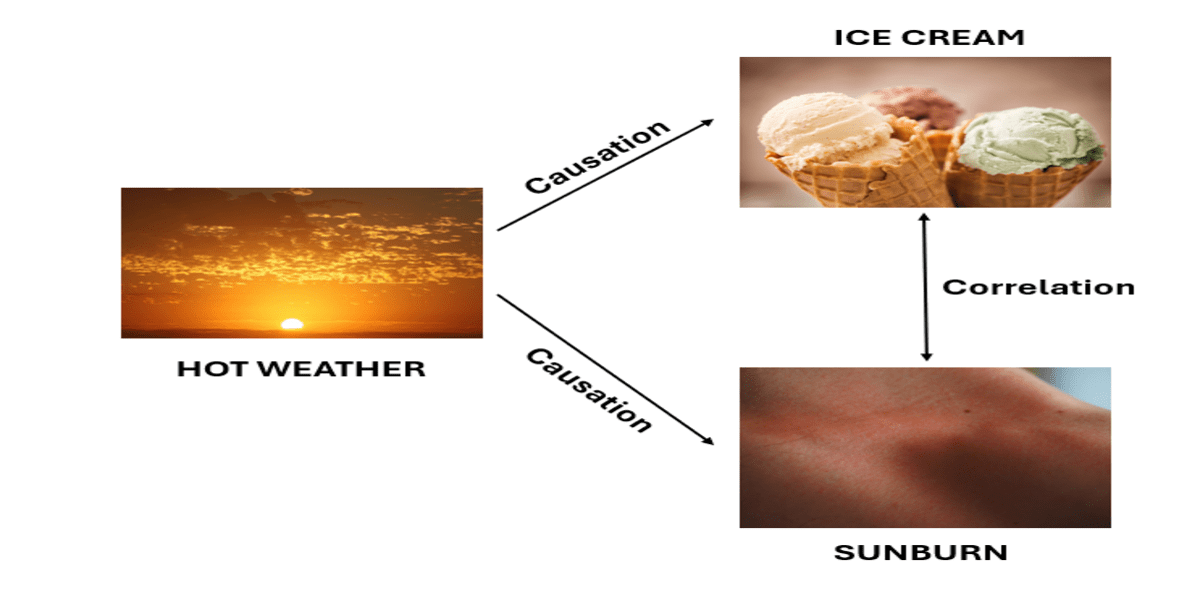
- "ice cream sales" and "sunburns" increase in the summer.
- These events happen together but do not cause each other.
They occur together because of a third factor: hot weather. - Illustration explains:
![]()
In this article, we will learn more about correlation and causation. We will also understand how these terms are different from each other.
Summary
- Correlation means two things HAPPEN TOGETHER.
- Causation means ONE thing MAKES ANOTHER thing HAPPEN.
- Correlation doesn't necessarily imply causation.
Just because two things happen together, doesn't mean that one causes the other.
It is essential to understand this distinction for accurate data analysis.
Causation vs. Correlation:
"Correlation" does not mean one variable causes the other to change.
It only shows that they change together.
Influence of Outliers: Outliers can change the correlation a lot. They can make the relationship stronger or weaker than it really is. Special methods can help reduce the impact of outliers.
Why Correlation Doesn't Imply Causation
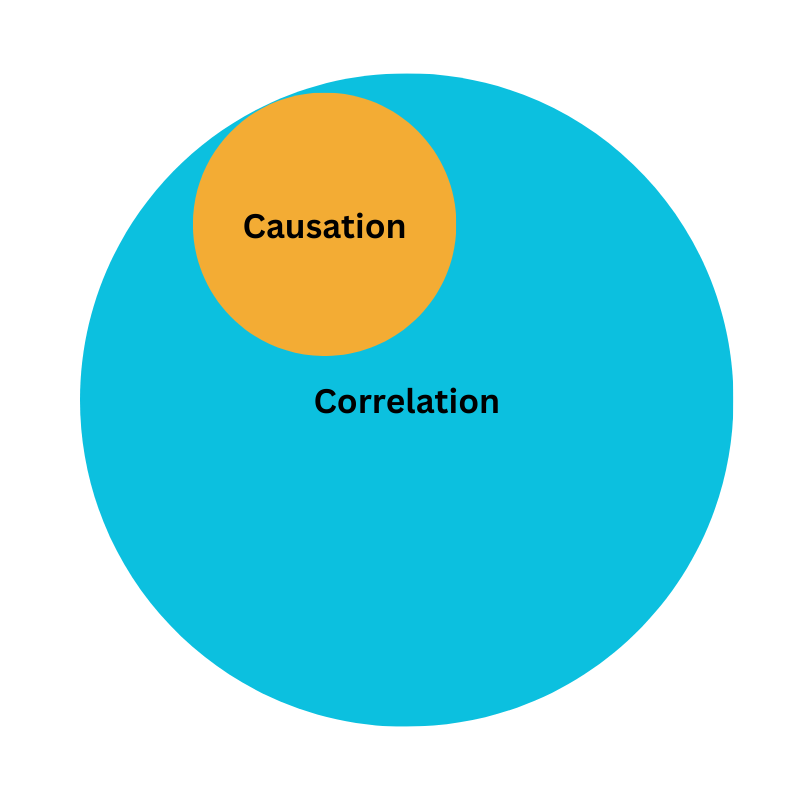
Correlation does not always mean causation.
Causation usually mean correlation.
The Venn diagram shows the overlap between them.
Let’s explore why spurious correlations happen:
- Third Variables (Confounding Factors):
Sometimes two things appear to have a connection, but in fact have one because of something that has an impact on both.
For example, umbrella sales and ice cream sales might increase together because of hot weather, not because people eat ice cream when it rains. - Reverse Causation:
Correlation doesn't show which way the causation goes.
Two things might seem linked, but one could cause the other or the other way around.
For instance, exercise and weight loss are correlated, but weight loss also makes people exercise more. - Random Chance (Coincidence):
Sometimes things look connected just by luck.
This can lead to wrong ideas about causation if we assume cause and effect based only on correlation.
Causation
Causation refers to a cause-and-effect relationship between variableS.
It means that changes in one variable cause changes in another variable.
Key Principles of Causation
- Temporal Precedence:
The cause MUST happen before the effect.
This helps us understand which one comes first and shows us the direction of cause and effect. - Covariation:
Changes in the cause SHOULD always be followed by changes in the effect.
Methods like long-term studies can prove this connection over time. - Controlling for Confounding Factors:
It's important to find other factors that COULD affect the relationship between variables.
Methods like statistical controls and random selection can reduce the impact of these factors.
Establishing Causation
To establish causation, researchers often use experimental designs.
They change the independent variable and observe changes in the dependent variable.
Key methods include:
- Randomized Controlled Trials (RCTs):
These experiments randomly assign participants to different groups.
One variable is changed, and other variables constant are kept constant. - Longitudinal Studies:
These studies track variables for a long period of time.
It examines how changes in one variable(independent variable) relate to changes in another variable(dependent variable). - Challenges and Considerations
- Ethical Constraints: Some experiments that establish causation may be unethical to conduct.
- Complexity: It is difficult to establish causation due to the presence of multiple variables and interactions among them.
Correlation
Correlation is a statistical measure used to assess the relationship between two variables.
We can understand how changes in one variable are associated with changes in another.
Limitations of Correlation: "Linear Relationships Only"
- Correlation measures only straight-line relationships.
- It doesn't work for curved or irregular ones.
Types of Correlation
There are three main types of correlation:
- Positive Correlation: When both variables move in the same direction (e.g., as one variable increases, the other also increases).
- Negative Correlation: When variables move in opposite directions (e.g., as one variable increases, the other decreases).
- No Correlation: When there is no discernible relationship between the variables.
Measuring Correlation
Correlation is MEASURED USING a correlation coefficient, typically denoted as .
The value of ranges from -1 to 1.
- =1: Perfect positive correlation;
as one variable increases, the other also increases proportionally. - =−1: Perfect negative correlation;
as one variable increases, the other decreases proportionally. - =0: No correlation;
there is no linear relationship between the variables.
The relationship is stronger if is close to +1 or -1.
A correlation coefficient near 0 refers to a weak or no linear relationship.
Interpreting Correlation
Strength of Relationship:
The correlation coefficient ranges from -1 to 1.
- A correlation coefficient close to +1 indicates a strong positive relationship.
It means as one variable increases, the other also increases. - A coefficient close to -1 indicates a strong negative relationship.
When one variable increases, the other tends to decrease. - A coefficient close to 0 suggests a weak or no relationship between the variables.
Direction of Relationship:
The sign of the correlation coefficient (+ or -) indicates the direction of the relationship.
**A positive r indicates a positive relationship (both variables move in the same direction).
A negative r indicates a negative relationship (both variables move in opposite directions).
SciTech-Mathematics-Probability+Statistics-Causation vs. Correlation: From Correlation to Causation: Deep Dive into Data Interpretation的更多相关文章
- linear correlation coefficient|Correlation and Causation|lurking variables
4.4 Linear Correlation 若由SxxSyySxy定义则为: 所以为了计算方便: 所以,可以明白的是,Sxx和Sx是不一样的! 所以,t r is independent of th ...
- Probability&Statistics 概率论与数理统计(1)
基本概念 样本空间: 随机试验E的所有可能结果组成的集合, 为E的样本空间, 记为S 随机事件: E的样本空间S的子集为E的随机事件, 简称事件, 由一个样本点组成的单点集, 称为基本事件 对立事件/ ...
- How do I learn mathematics for machine learning?
https://www.quora.com/How-do-I-learn-mathematics-for-machine-learning How do I learn mathematics f ...
- 相关系数(CORRELATION COEFFICIENTS)会骗人?
CORRELATION COEFFICIENTS We've discussed how to summarize a single variable. The next question is ho ...
- Chapter 07-Basic statistics(Part3 correlations)
这一部分使用R基础已安装包中的state.x77数据集.该数据集的数据是关于美国50个州在1977年对人口,收入,文盲率,平均寿命,谋杀率,高中毕业率统计所得. 1.关联的种类(types of co ...
- Type Correlation
Types of correlation: Logical correlation: Using pre-defined and customized correlation rules. Inven ...
- Understanding and Selecting a SIEM/LM: Correlation and Alerting
Continuing our discussion of core SIEM and Log Management technology, we now move into event correla ...
- 转:如何在 LoadRunner 脚本中做关联 (Correlation)
如何在 LoadRunner 脚本中做关联 (Correlation) 当录制脚本时,VuGen会拦截client端(浏览器)与server端(网站服务器)之间的对话,并且通通记录下来,产生脚本.在V ...
- [Math Review] Statistics Basics: Main Concepts in Hypothesis Testing
Case Study The case study Physicians' Reactions sought to determine whether physicians spend less ti ...
- Machine Learning and Data Mining(机器学习与数据挖掘)
Problems[show] Classification Clustering Regression Anomaly detection Association rules Reinforcemen ...
随机推荐
- sql学习day2——运用case进行有条件的update(续day1)
1.薪水表,如下所示,要求:为下一年调整工资22000以下的员工涨工资10%,24000以上的员工减少10% 思考:如果先update薪水24000以上的员工,假设某工资为24000,24000*(1 ...
- Java编程--委派设计模式
目录 委派设计模式 委派 (Delegation) 委派设计模式 委派 (Delegation) 委派(Delegation)是一种设计模式,通常用于实现代码的解耦和复用.简单来说,委派是指一个对象将 ...
- 【记录】飞书多维表格|连接多选的结果 List 形成字符串(没有 TEXTJOIN 和 INDEX 和 ARRAYFORMULA)
前言 当我使用 TEXTJOIN 或者 ARRAYFORMULA 的时候,它都显示没有.我找了一下文档也没找到解决办法.结果我研究了一下多维表格的设计,详见官方文档:多维表格公式字段概述,才发现它有 ...
- Nohup 启动程序未指定输出日志,导致磁盘空间被占满的解决方案
1. 问题原因 当使用 nohup 启动程序时,默认情况下,标准输出(stdout)和标准错误(stderr)都会被重定向到 nohup.out 文件.例如: nohup python my_scri ...
- .NET AI 生态关键拼图:全面解读 AI Extensions 和 Vector Extensions 如何重塑.NET开发生态
引言 关注.NET AI和.NET Vector原生开发已有半年之久了,其核心组件在历经这半年预发布期的持续迭代后,终于于5月16日和5月20日逐步发布了..在此之前,基于预发布版本撰写的文章和调试工 ...
- K8s新手系列之指定Pod调度到指定节点上
概述 在 Kubernetes 中,Pod的调度是通过kube-schedule来实现的,Pod的调度会经过一系列算法来进行完成. 在实际生产过程中,我们想让Pod调度到我们想要的节点上,往往通过ku ...
- 关于cc1链-lazymap版复现
关于cc1链-lazymap版复现 思路,在cc链中最重要的其实是transform方法;其反射调用执行的性质+transformchain性质,导致可以通过构造反射调用链子,也就是Runtime.e ...
- qt激光加工软件开发——介绍
20年毕业后,先是从事qt+c++开发,而后从事mfc开发,今年步入新的公司,着手开发一版新的激光设备加工软件 激光加工软件所具备的功能: 轴的控制:主要包括XYZ三个轴,品牌:ACS.固高.Gali ...
- 基于谷歌内核(Chromium)浏览器Cookie值的读取工具
一.基于谷歌内核浏览器的cookie文件保存位置 以目前流行的三款基于Chrominum内核的浏览器为例,Cookie文件保存在当前用户的AppData目录下,注意该文件没有扩展名. 1.谷歌的Chr ...
- HTTP POST方式调用SOAP OPERATION类的接口
wsdl地址或者接口地址中有多个方法(operation) 如下是soapui测试的例子,wsdl地址下包含多个operation,但是现在我想用http的方式,只做getKnowledgeParts ...