使用pandas处理数据并绘图的例子
import sys
import os
import re
import datetime
import csv def get_datetime(record):
request_time = ""
p = re.compile(r"(?P<time>\d{4}-\d{2}-\d{2} \d{2}:\d{2}:\d{2},\d+)")
# p = re.compile(r"(?P<time>[\d.]+)ms")
m = p.search(record)
if m:
request_time = m.group("time")
dt = datetime.datetime.strptime(request_time, '%Y-%m-%d %H:%M:%S,%f')
return dt def parse(log_file_name, result_csv_name):
start = 0
end = 0
start_time = ''
end_time = ''
md5crc32 = ''
csv_writer = csv.writer(open(result_csv_name, 'wb'),
delimiter = ',')
with open(log_file_name, 'rb') as log_file:
for i, line in enumerate(log_file):
line = line.strip()
if 'folderProcessing() INFO download from' in line:
start = i
start_time = get_datetime(line)
elif 'DownLoadFile() INFO download to' in line:
end = i
end_time = get_datetime(line)
# got one download action
if end - start == 1:
# parse hash
md5crc32 = line.rsplit('/', 1)[1]
print md5crc32, (end_time - start_time).total_seconds()
csv_writer.writerow((md5crc32, (end_time - start_time).total_seconds()))
# assert False def do_statistics(file_name):
import pandas as pd
import numpy as np
import matplotlib.pyplot as plt
df = pd.read_csv(file_name, header = None, names= ['hash', 'time'], dtype = {'time': np.float64},
# nrows = 10000
)
time_series = df.time
print time_series.describe()
plt.figure()
# fig = time_series.hist().get_figure()
# define range
ranges = (0.0, 0.1, 0.2, 0.3, 0.4, 0.5, 0.6, 0.7, 0.8, 0.9, 1.0, 2.0, 3.0, 4.0, 10.0, 10000)
bins = zip(ranges[:-1], ranges[1:])
labels = ['%s-%s'%(begin, end) for i ,(begin, end) in enumerate(bins) ]
print labels
#print bins
#fig = time_series.plot(kind='bar', xticks = ranges)
results = [0] * len(bins)
for i in time_series:
for j , (begin, end) in enumerate(bins):
if i > begin and i <= end:
results[j] += 1
print results mu = time_series.mean()
median = np.median(time_series)
sigma = time_series.std() ax = pd.Series(results).plot(kind='bar', logy = True, figsize=(25, 13.5))
# dpi = ax.figure.get_dpi()
# print 'dpi = ', dpi
# plt.gcf().set_size_inches(25, 13.5) ax.set_ylabel('Count')
ax.set_xlabel('Time in seconds')
# print dir(fig)
ax.set_xticklabels(labels, rotation = 45)
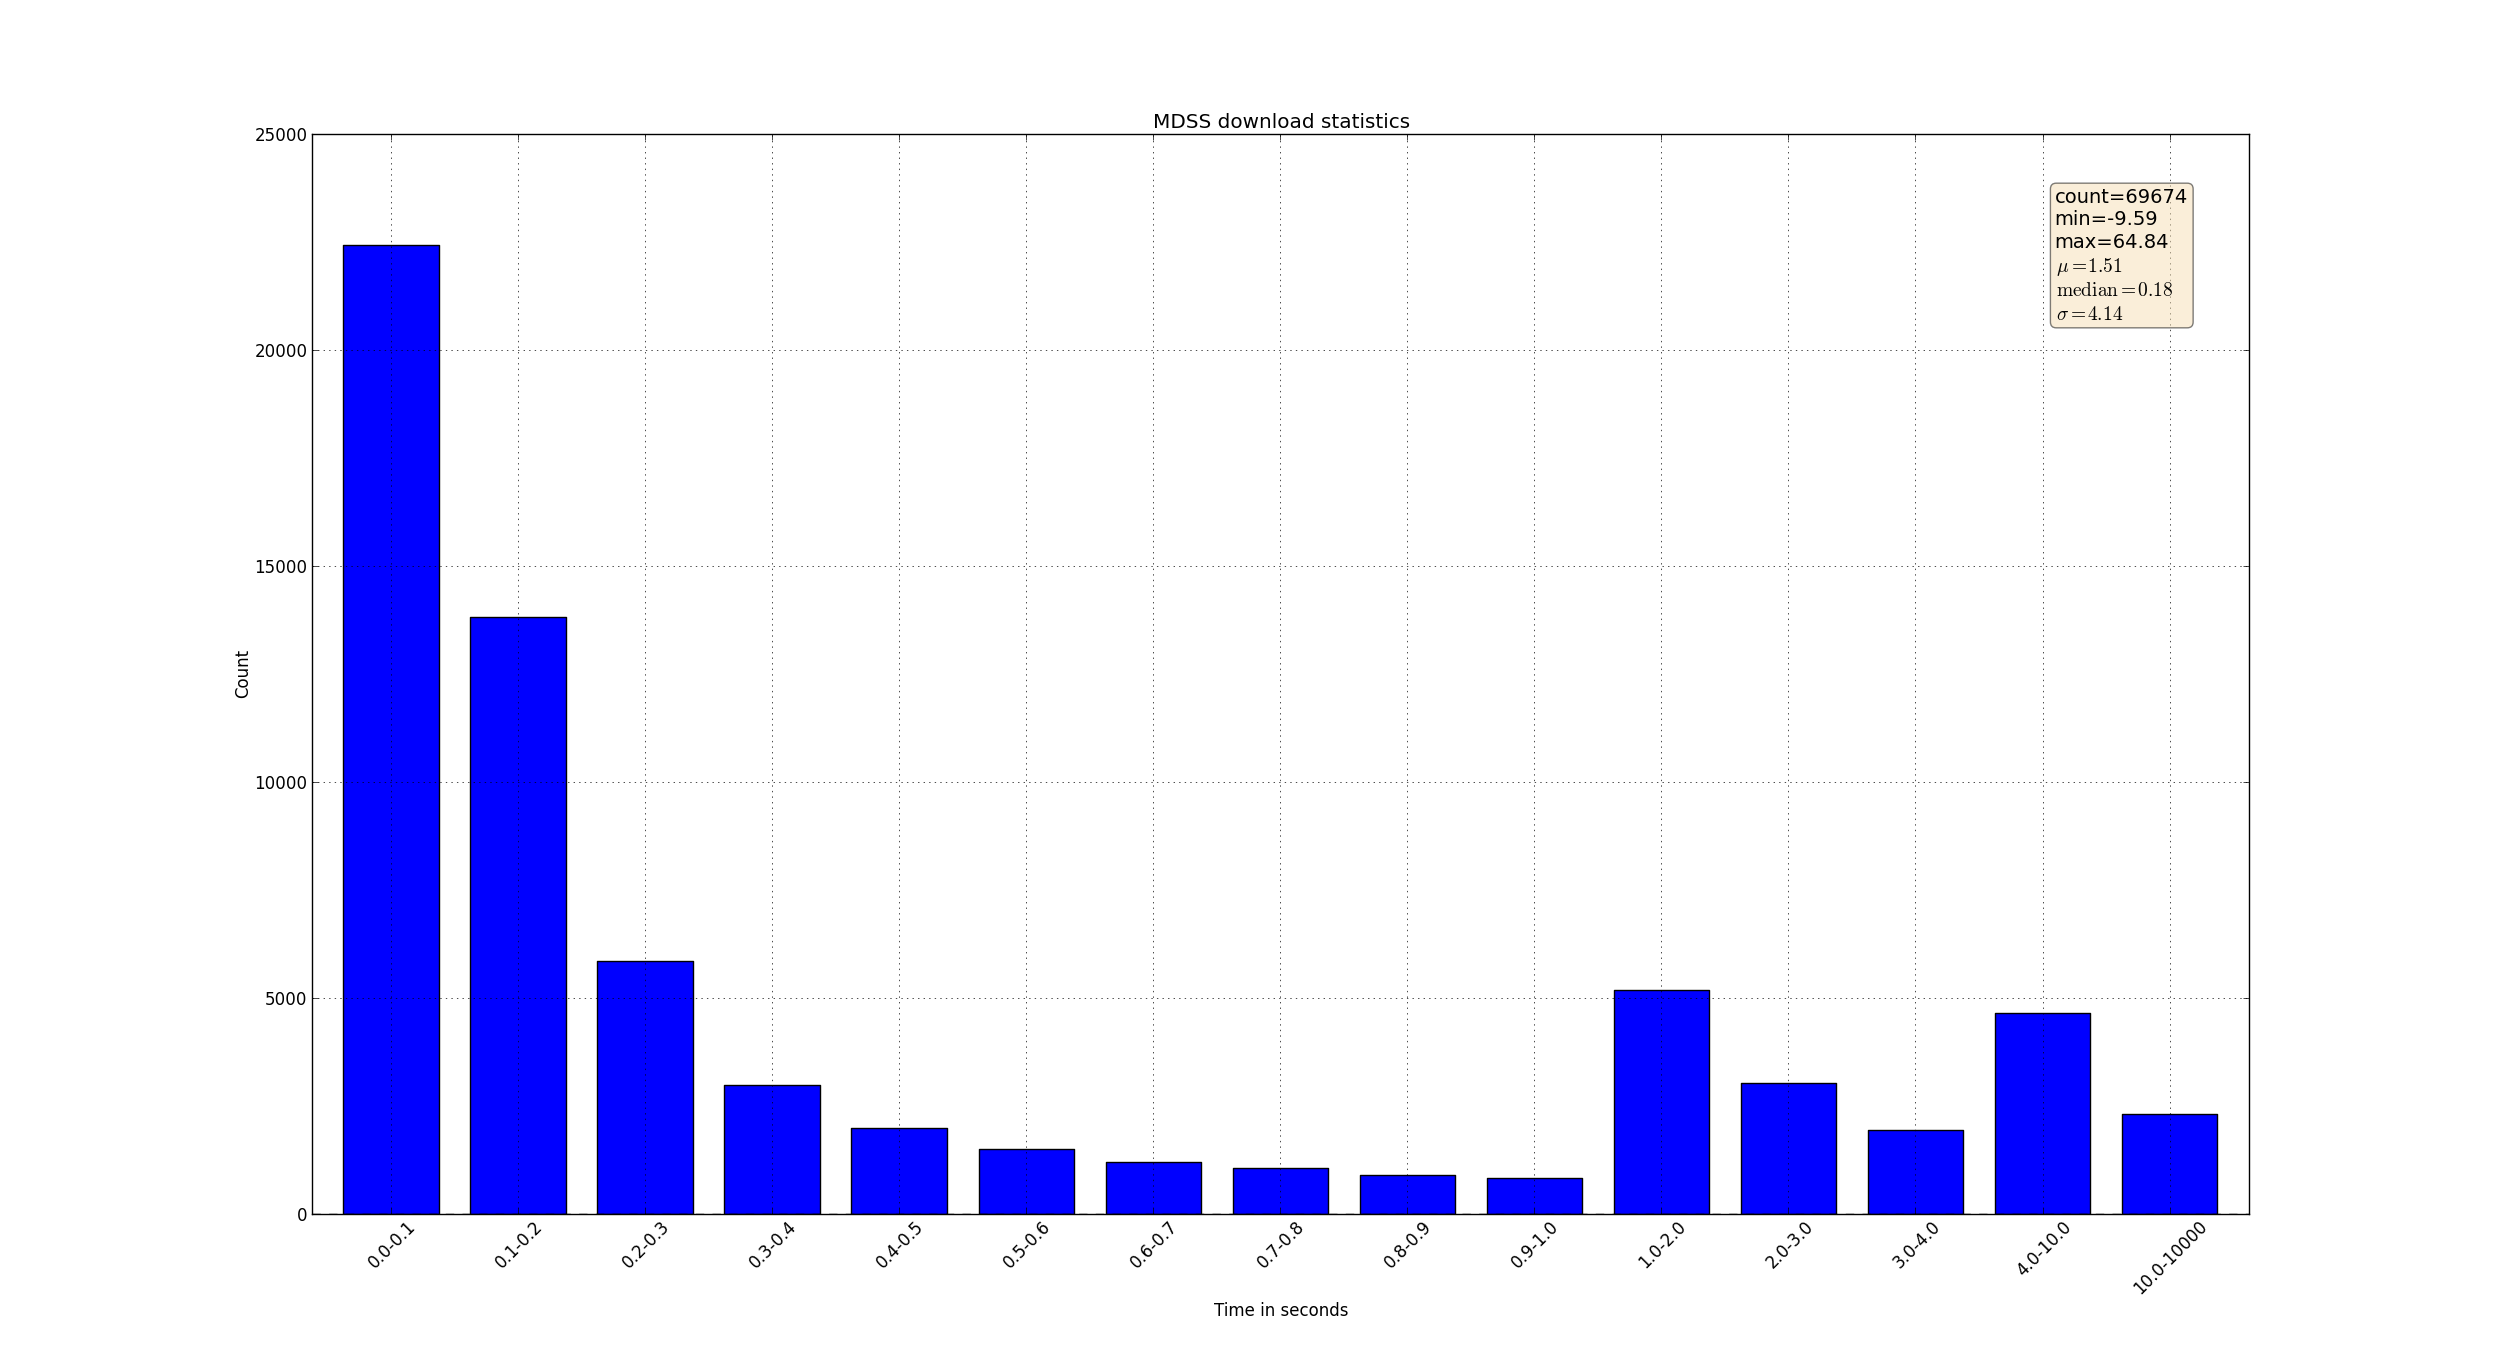
ax.set_title('MDSS download statistics') textstr = 'count=%s\nmin=%.2f\nmax=%.2f\n$\mu=%.2f$\n$\mathrm{median}=%.2f$\n$\sigma=%.2f$'%(time_series.count(),time_series.min(), time_series.max(),mu, median, sigma) # these are matplotlib.patch.Patch properties
props = dict(boxstyle='round', facecolor='wheat', alpha=0.5) # place a text box in upper right in axes coords
ax.text(0.90, 0.95, textstr, transform=ax.transAxes, fontsize=14,
verticalalignment='top', bbox=props) ax.figure.show()
#
ax.figure.set_size_inches(25, 13.5, forward = True)
print ax.figure.get_size_inches()
ax.figure.savefig('result.png', format='png',)
input('asdfasd') if __name__ == "__main__":
# print get_datetime("2014-10-23 09:19:34,251 pid=27850")
# parse('inpri_p_antiy.log', 'result.csv')
do_statistics('result.csv')
生成图像如下:
使用pandas处理数据并绘图的例子的更多相关文章
- 利用Python进行数据分析(12) pandas基础: 数据合并
pandas 提供了三种主要方法可以对数据进行合并: pandas.merge()方法:数据库风格的合并: pandas.concat()方法:轴向连接,即沿着一条轴将多个对象堆叠到一起: 实例方法c ...
- 【转载】使用Pandas对数据进行筛选和排序
使用Pandas对数据进行筛选和排序 本文转载自:蓝鲸的网站分析笔记 原文链接:使用Pandas对数据进行筛选和排序 目录: sort() 对单列数据进行排序 对多列数据进行排序 获取金额最小前10项 ...
- 【转载】使用Pandas进行数据提取
使用Pandas进行数据提取 本文转载自:蓝鲸的网站分析笔记 原文链接:使用python进行数据提取 目录 set_index() ix 按行提取信息 按列提取信息 按行与列提取信息 提取特定日期的信 ...
- 【转载】使用Pandas进行数据匹配
使用Pandas进行数据匹配 本文转载自:蓝鲸的网站分析笔记 原文链接:使用Pandas进行数据匹配 目录 merge()介绍 inner模式匹配 lefg模式匹配 right模式匹配 outer模式 ...
- 【转载】使用Pandas创建数据透视表
使用Pandas创建数据透视表 本文转载自:蓝鲸的网站分析笔记 原文链接:使用Pandas创建数据透视表 目录 pandas.pivot_table() 创建简单的数据透视表 增加一个行维度(inde ...
- Pandas 把数据写入csv
Pandas 把数据写入csv from sklearn import datasets import pandas as pd iris = datasets.load_iris() iris_X ...
- pandas学习(数据分组与分组运算、离散化处理、数据合并)
pandas学习(数据分组与分组运算.离散化处理.数据合并) 目录 数据分组与分组运算 离散化处理 数据合并 数据分组与分组运算 GroupBy技术:实现数据的分组,和分组运算,作用类似于数据透视表 ...
- Pandas DataFrame数据的增、删、改、查
Pandas DataFrame数据的增.删.改.查 https://blog.csdn.net/zhangchuang601/article/details/79583551 #删除列 df_2 = ...
- pandas 选取数据 修改数据 loc iloc []
pandas选取数据可以通过 loc iloc [] 来选取 使用loc选取某几列: user_fans_df = sample_data.loc[:,['uid','fans_count']] 使 ...
随机推荐
- Windows Store App 全球化:在后台代码中引用字符串资源
上文提到了引用字符串资源具有两种方式,分别是在XAML元素中和在后台代码中引用资源文件中的字符串资源.在第一小节已经介绍了如何在XAML元素中引用字符串资源,本小节将讲解在后台代码中引用字符串资源的相 ...
- UOJ Test Round 1
第一题: 题目大意: 给出N个字符串,字符串的前面部分都是字母且都是一样的,后面部分是数字,按照后面的数字排序.N<=10000 解题过程: 1.第一题是真良心,一开始的做法是把后面的数字分离出 ...
- Mutual Training for Wannafly Union #1解题报告
---恢复内容开始--- q神等人组织的vjudge上的多校训练,题目基本上都来自于CF,#1是上周进行的,参加后感觉收获很多,因为上周准备期中比较忙,解题报告现在补上. 比赛地址(兼题目地址) A题 ...
- imx6q uboot启动流程牛人的图片(转)
- SoapUI API + Groovy API + Difference with Java
用soapUI进行webservice测试过程中,必不可少的要用到soapUI封装的代码.我们一起学习吧:) SoapUI 5.1.2 API:http://www.soapui.org/apidoc ...
- OutputCache 如何使用本地缓存 【转】
注意!ASP.NET MVC 3 的一个 OutputCache 问题 在用 ASP.NET MVC 3 重写博客园网站首页时,特地留意了一下这个缓存问题,通过这篇博文分享一下. 在 ASP.NE ...
- LR手工制作webServices接口类脚本
首先通过抓包获得某个接口的码流消息,请求报文码分消息头和消息体,所以在制作脚本的时候也需要添加消息头和消息体. POST /jboss-bet/services/&** HTTP/1.1SOA ...
- 网页版电子表格控件tmlxSpreadsheet免费下载地址
tmlxSpreadsheet 是一个由JavaScript 和 PHP 写成的电子表格控件(包含WP插件, Joomla插件等等).. 程序员可以容易的添加一个类似Excel功能的,可编辑的表格功能 ...
- Maven安装本地jar
应用场景: 有时候一些jar包(比如oracle 的 ojdbc.jar)由于种种原因,比如版权等,导致maven中央库没有该jar文件,但是却有该jar的pom文件. 这个时候,如果私服也没这jar ...
- Android RecyclerView单击、长按事件:基于OnItemTouchListener +GestureDetector标准实现(二),封装抽取成通用工具类
Android RecyclerView单击.长按事件:基于OnItemTouchListener +GestureDetector标准实现(二),封装抽取成通用工具类 我写的附录文章2,介绍了 ...