使用pandas处理数据并绘图的例子
import sys
import os
import re
import datetime
import csv def get_datetime(record):
request_time = ""
p = re.compile(r"(?P<time>\d{4}-\d{2}-\d{2} \d{2}:\d{2}:\d{2},\d+)")
# p = re.compile(r"(?P<time>[\d.]+)ms")
m = p.search(record)
if m:
request_time = m.group("time")
dt = datetime.datetime.strptime(request_time, '%Y-%m-%d %H:%M:%S,%f')
return dt def parse(log_file_name, result_csv_name):
start = 0
end = 0
start_time = ''
end_time = ''
md5crc32 = ''
csv_writer = csv.writer(open(result_csv_name, 'wb'),
delimiter = ',')
with open(log_file_name, 'rb') as log_file:
for i, line in enumerate(log_file):
line = line.strip()
if 'folderProcessing() INFO download from' in line:
start = i
start_time = get_datetime(line)
elif 'DownLoadFile() INFO download to' in line:
end = i
end_time = get_datetime(line)
# got one download action
if end - start == 1:
# parse hash
md5crc32 = line.rsplit('/', 1)[1]
print md5crc32, (end_time - start_time).total_seconds()
csv_writer.writerow((md5crc32, (end_time - start_time).total_seconds()))
# assert False def do_statistics(file_name):
import pandas as pd
import numpy as np
import matplotlib.pyplot as plt
df = pd.read_csv(file_name, header = None, names= ['hash', 'time'], dtype = {'time': np.float64},
# nrows = 10000
)
time_series = df.time
print time_series.describe()
plt.figure()
# fig = time_series.hist().get_figure()
# define range
ranges = (0.0, 0.1, 0.2, 0.3, 0.4, 0.5, 0.6, 0.7, 0.8, 0.9, 1.0, 2.0, 3.0, 4.0, 10.0, 10000)
bins = zip(ranges[:-1], ranges[1:])
labels = ['%s-%s'%(begin, end) for i ,(begin, end) in enumerate(bins) ]
print labels
#print bins
#fig = time_series.plot(kind='bar', xticks = ranges)
results = [0] * len(bins)
for i in time_series:
for j , (begin, end) in enumerate(bins):
if i > begin and i <= end:
results[j] += 1
print results mu = time_series.mean()
median = np.median(time_series)
sigma = time_series.std() ax = pd.Series(results).plot(kind='bar', logy = True, figsize=(25, 13.5))
# dpi = ax.figure.get_dpi()
# print 'dpi = ', dpi
# plt.gcf().set_size_inches(25, 13.5) ax.set_ylabel('Count')
ax.set_xlabel('Time in seconds')
# print dir(fig)
ax.set_xticklabels(labels, rotation = 45)
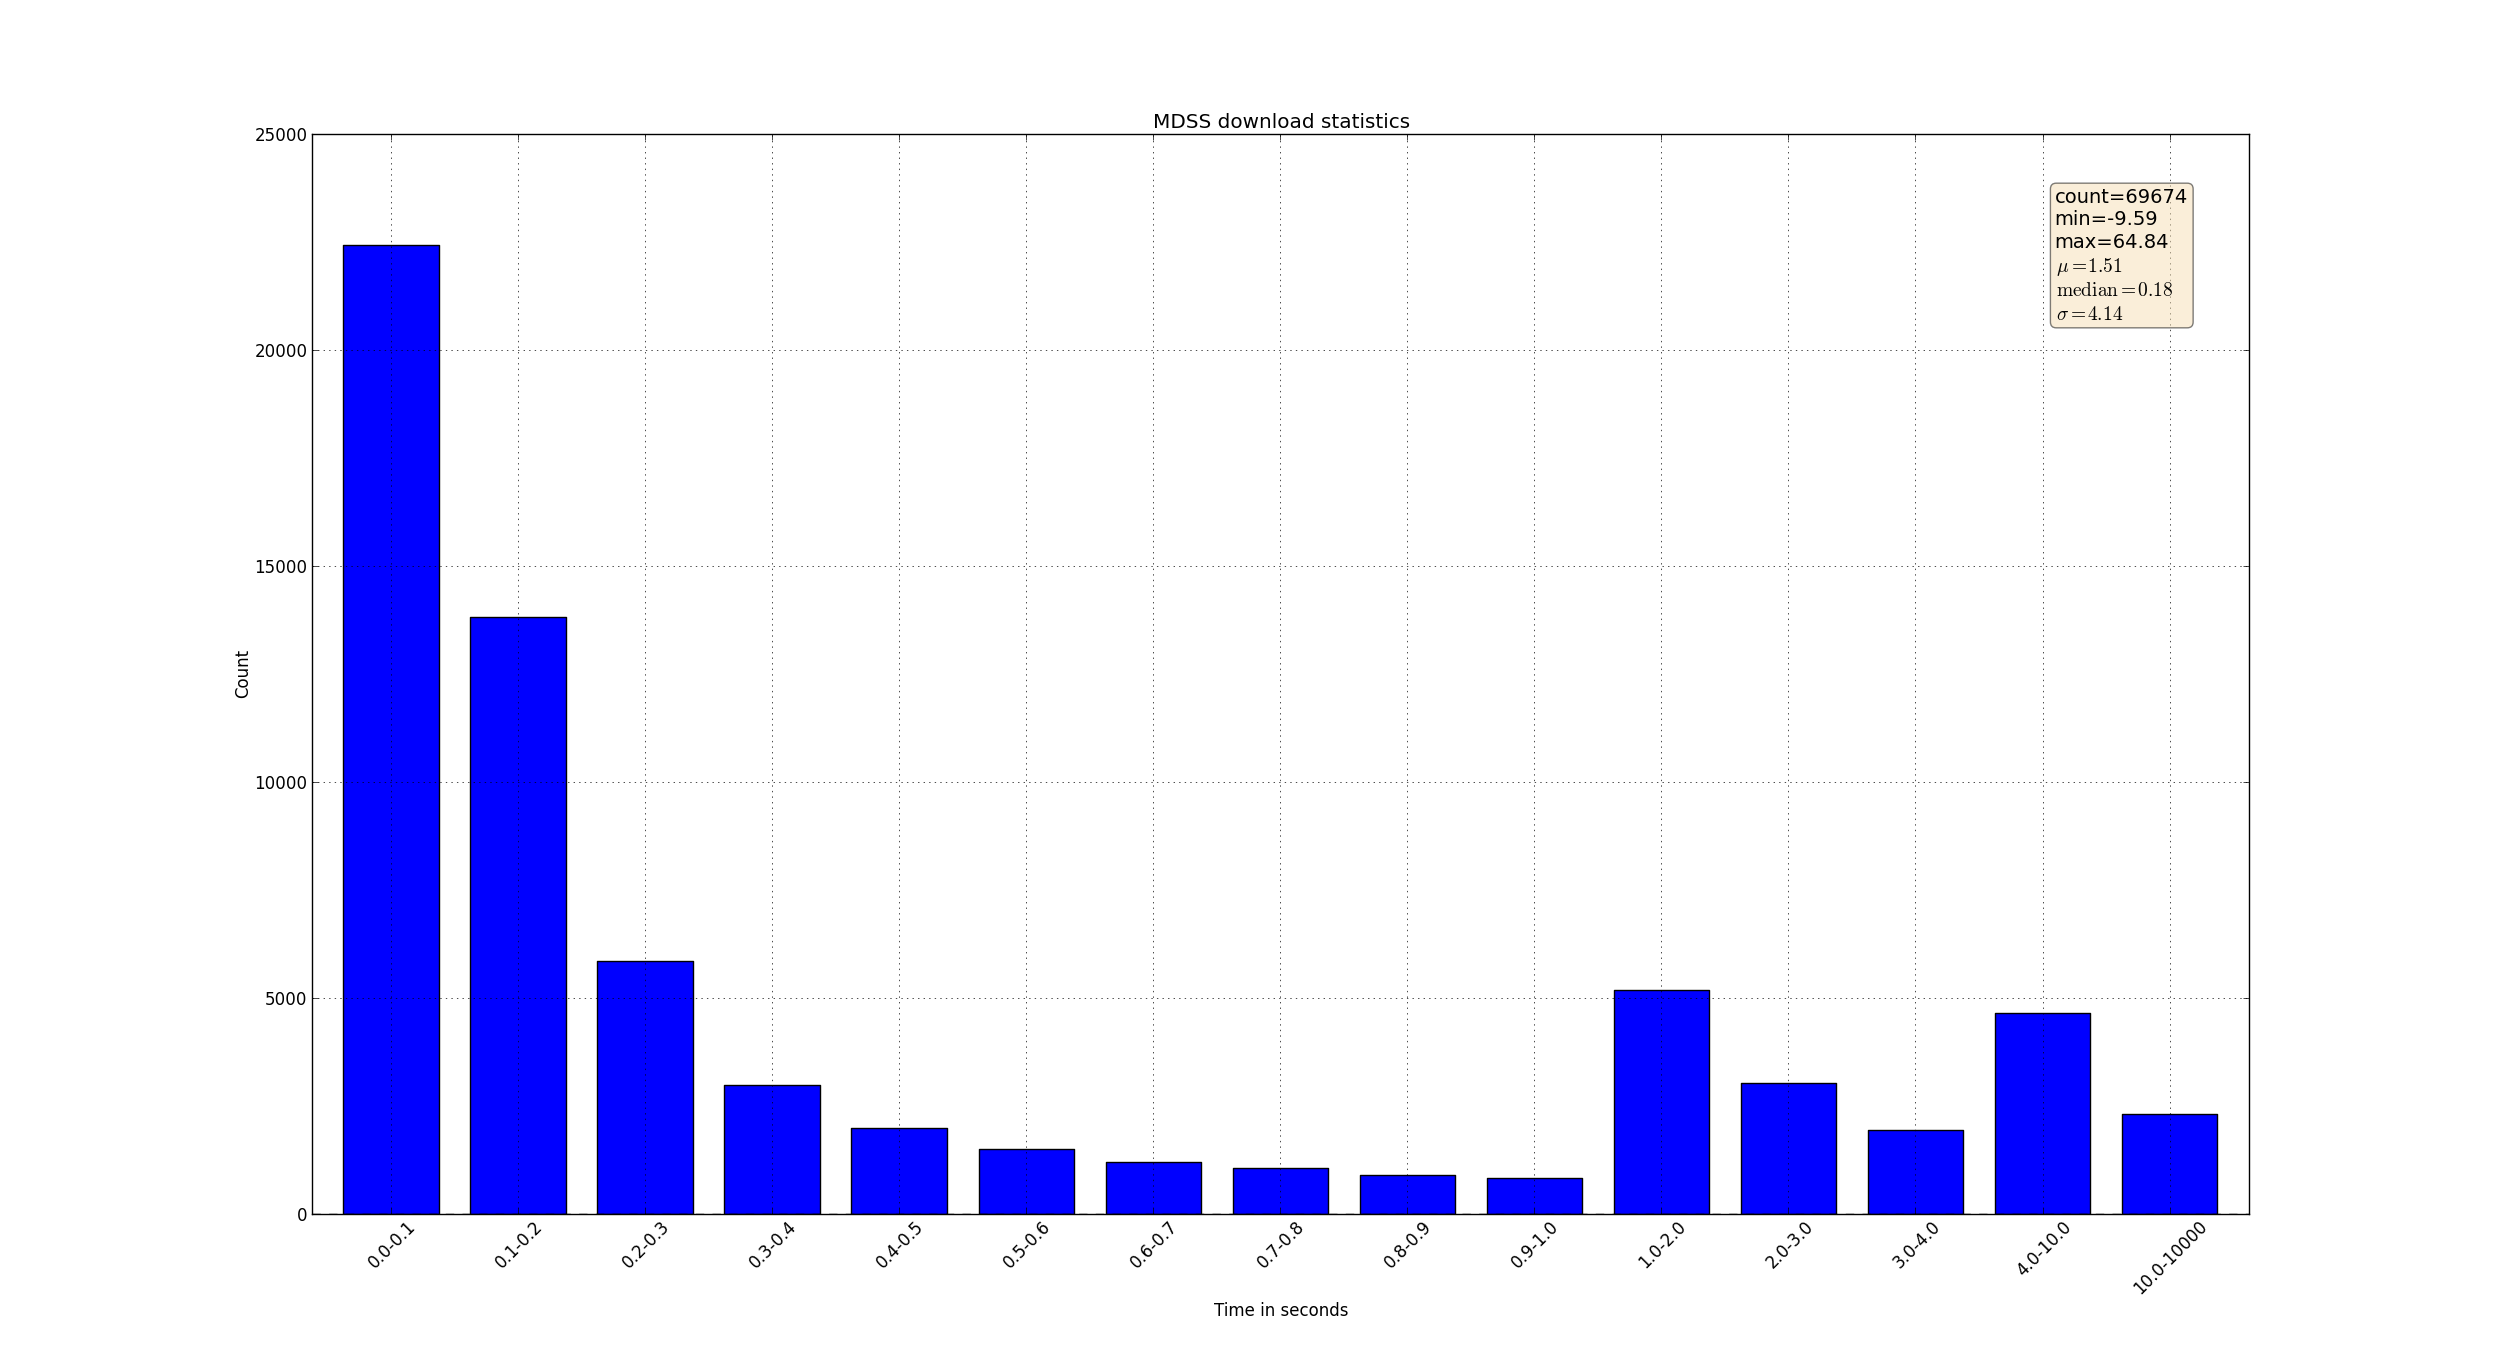
ax.set_title('MDSS download statistics') textstr = 'count=%s\nmin=%.2f\nmax=%.2f\n$\mu=%.2f$\n$\mathrm{median}=%.2f$\n$\sigma=%.2f$'%(time_series.count(),time_series.min(), time_series.max(),mu, median, sigma) # these are matplotlib.patch.Patch properties
props = dict(boxstyle='round', facecolor='wheat', alpha=0.5) # place a text box in upper right in axes coords
ax.text(0.90, 0.95, textstr, transform=ax.transAxes, fontsize=14,
verticalalignment='top', bbox=props) ax.figure.show()
#
ax.figure.set_size_inches(25, 13.5, forward = True)
print ax.figure.get_size_inches()
ax.figure.savefig('result.png', format='png',)
input('asdfasd') if __name__ == "__main__":
# print get_datetime("2014-10-23 09:19:34,251 pid=27850")
# parse('inpri_p_antiy.log', 'result.csv')
do_statistics('result.csv')
生成图像如下:
使用pandas处理数据并绘图的例子的更多相关文章
- 利用Python进行数据分析(12) pandas基础: 数据合并
pandas 提供了三种主要方法可以对数据进行合并: pandas.merge()方法:数据库风格的合并: pandas.concat()方法:轴向连接,即沿着一条轴将多个对象堆叠到一起: 实例方法c ...
- 【转载】使用Pandas对数据进行筛选和排序
使用Pandas对数据进行筛选和排序 本文转载自:蓝鲸的网站分析笔记 原文链接:使用Pandas对数据进行筛选和排序 目录: sort() 对单列数据进行排序 对多列数据进行排序 获取金额最小前10项 ...
- 【转载】使用Pandas进行数据提取
使用Pandas进行数据提取 本文转载自:蓝鲸的网站分析笔记 原文链接:使用python进行数据提取 目录 set_index() ix 按行提取信息 按列提取信息 按行与列提取信息 提取特定日期的信 ...
- 【转载】使用Pandas进行数据匹配
使用Pandas进行数据匹配 本文转载自:蓝鲸的网站分析笔记 原文链接:使用Pandas进行数据匹配 目录 merge()介绍 inner模式匹配 lefg模式匹配 right模式匹配 outer模式 ...
- 【转载】使用Pandas创建数据透视表
使用Pandas创建数据透视表 本文转载自:蓝鲸的网站分析笔记 原文链接:使用Pandas创建数据透视表 目录 pandas.pivot_table() 创建简单的数据透视表 增加一个行维度(inde ...
- Pandas 把数据写入csv
Pandas 把数据写入csv from sklearn import datasets import pandas as pd iris = datasets.load_iris() iris_X ...
- pandas学习(数据分组与分组运算、离散化处理、数据合并)
pandas学习(数据分组与分组运算.离散化处理.数据合并) 目录 数据分组与分组运算 离散化处理 数据合并 数据分组与分组运算 GroupBy技术:实现数据的分组,和分组运算,作用类似于数据透视表 ...
- Pandas DataFrame数据的增、删、改、查
Pandas DataFrame数据的增.删.改.查 https://blog.csdn.net/zhangchuang601/article/details/79583551 #删除列 df_2 = ...
- pandas 选取数据 修改数据 loc iloc []
pandas选取数据可以通过 loc iloc [] 来选取 使用loc选取某几列: user_fans_df = sample_data.loc[:,['uid','fans_count']] 使 ...
随机推荐
- Solr安装入门、查询详解
Solr安装入门:http://www.importnew.com/12607.html 查询详解:http://www.360doc.com/content/14/0306/18/203871_35 ...
- Oracle中TO_DATE用法
TO_DATE格式(以时间:2007-11-02 13:45:25为例) Year: yy two digits 两位年 显示值:07 yyy three digits 三位年 显示值:007 yyy ...
- mybaits入门
1.回顾jdbc开发 orm概述 orm是一种解决持久层对象关系映射的规则,而不是一种具体技术.jdbc/dbutils/springdao,hibernate/springorm,mybaits同属 ...
- ASP.NET Web API 入门示例详解
REST服务已经成为最新的服务端开发趋势,ASP.NET Web API即为.NET平台的一种轻量级REST架构. ASP.NET Web API直接借鉴了ASP.NET MVC的设计,两者具有非常类 ...
- 安装了VS2010 sp1 后再安装ASP.NET MVC 3.0的问题
安装了VS2010 sp1 后再安装ASP.NET MVC 3.0的问题(Final Result: Installation failed with error code: (0x80070643) ...
- 几款值得推荐的android(安卓)开源框架简介
技术不再多,知道一些常用的.不错的就够了. 该文章自有需要的时候,mark一下. 顺序不代表排名,根据自己需求进行选择即可. 1.volley 项目地址 https://github.com/sman ...
- CSS第一天总结
CSS是层叠样式表,其作用在我看来就是统一一个或多个元素或者ID.class等的属性,CSS可以定义的属性非常多,一个好看的网页离不开CSS的修饰. CSS简而言之就是三个部分:选择符.属性.属性值. ...
- C++ iostream的线程安全性问题
标准C里面的printf, fprintf之类的,会给FILE指针上锁(在unix平台上就是记录锁,按照msdn的说法windows上也有类似的锁),所以单次函数调用总是线程安全的: 要注意,这里只对 ...
- UVA 208 (DFS)
题意:找出1到T的所有路径: 坑点:一开始以为是到终点,读错了题意,没测试第二个样例,结果WA了4遍,坑大了: #include <iostream> #include <cmath ...
- JS运动基础(三) 弹性运动
加减速运动速度不断增加或减少速度减小到负值,会向反方向运动 弹性运动在目标点左边,加速:在目标点右边,减速根据距离,计算加速度 带摩擦力的弹性运动弹性运动+摩擦力 弹性:速度 += (目标点 - 当前 ...