
学习笔记之Model selection and evaluation
学习笔记之scikit-learn - 浩然119 - 博客园
- https://www.cnblogs.com/pegasus923/p/9997485.html
- 3. Model selection and evaluation — scikit-learn 0.20.3 documentation
- https://scikit-learn.org/stable/model_selection.html#model-selection
Accuracy paradox - Wikipedia
- https://en.wikipedia.org/wiki/Accuracy_paradox
- The accuracy paradox is the paradoxical finding that accuracy is not a good metric for predictive models when classifying in predictive analytics. This is because a simple model may have a high level of accuracy but be too crude to be useful. For example, if the incidence of category A is dominant, being found in 99% of cases, then predicting that every case is category A will have an accuracy of 99%. Precision and recall are better measures in such cases.[1][2] The underlying issue is that class priors need to be accounted for in error analysis. Precision and recall help, but precision too can be biased by very unbalanced class priors in the test sets.
Confusion matrix - Wikipedia
- https://en.wikipedia.org/wiki/Confusion_matrix
- In the field of machine learning and specifically the problem of statistical classification, a confusion matrix, also known as an error matrix,[4] is a specific table layout that allows visualization of the performance of an algorithm, typically a supervised learning one (in unsupervised learning it is usually called a matching matrix). Each row of the matrix represents the instances in a predicted class while each column represents the instances in an actual class (or vice versa).[2] The name stems from the fact that it makes it easy to see if the system is confusing two classes (i.e. commonly mislabeling one as another).
- It is a special kind of contingency table, with two dimensions ("actual" and "predicted"), and identical sets of "classes" in both dimensions (each combination of dimension and class is a variable in the contingency table).
- condition positive (P) the number of real positive cases in the data
- condition negative (N) the number of real negative cases in the data
- true positive (TP) eqv. with hit
- true negative (TN) eqv. with correct rejection
- false positive (FP) eqv. with false alarm, Type I error
- false negative (FN) eqv. with miss, Type II error
- sensitivity, recall, hit rate, or true positive rate (TPR)
- specificity, selectivity or true negative rate (TNR)


Sensitivity and specificity - Wikipedia
- https://en.wikipedia.org/wiki/Sensitivity_and_specificity
- Sensitivity and specificity are statistical measures of the performance of a binary classificationtest, also known in statistics as a classification function:
- Sensitivity (also called the true positive rate, the recall, or probability of detection[1] in some fields) measures the proportion of actual positives that are correctly identified as such (e.g., the percentage of sick people who are correctly identified as having the condition).
- Specificity (also called the true negative rate) measures the proportion of actual negatives that are correctly identified as such (e.g., the percentage of healthy people who are correctly identified as not having the condition).
- In general, Positive = identified and negative = rejected. Therefore:
- True positive = correctly identified
- False positive = incorrectly identified
- True negative = correctly rejected
- False negative = incorrectly rejected

- https://en.wikipedia.org/wiki/Precision_and_recall
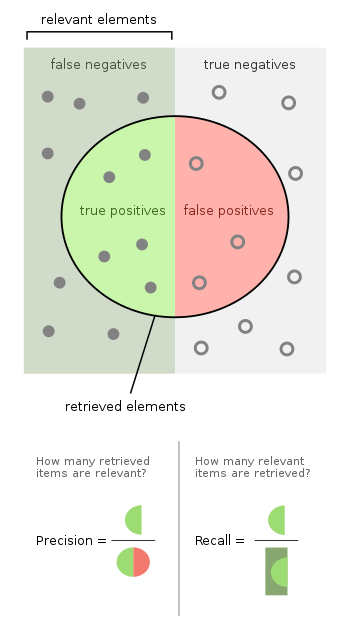
- In pattern recognition, information retrieval and binary classification, precision (also called positive predictive value) is the fraction of relevant instances among the retrieved instances, while recall (also known as sensitivity) is the fraction of relevant instances that have been retrieved over the total amount of relevant instances. Both precision and recall are therefore based on an understanding and measure of relevance.
- Suppose a computer program for recognizing dogs in photographs identifies 8 dogs in a picture containing 12 dogs and some cats. Of the 8 identified as dogs, 5 actually are dogs (true positives), while the rest are cats (false positives). The program's precision is 5/8 while its recall is 5/12. When a search engine returns 30 pages only 20 of which were relevant while failing to return 40 additional relevant pages, its precision is 20/30 = 2/3 while its recall is 20/60 = 1/3. So, in this case, precision is "how useful the search results are", and recall is "how complete the results are".
- In statistics, if the null hypothesis is that all items are irrelevant (where the hypothesis is accepted or rejected based on the number selected compared with the sample size), absence of type I and type II errors(i.e.: perfect sensitivity and specificity of 100% each) corresponds respectively to perfect precision (no false positive) and perfect recall (no false negative). The above pattern recognition example contained 8 − 5 = 3 type I errors and 12 − 5 = 7 type II errors. Precision can be seen as a measure of exactness or quality, whereas recall is a measure of completeness or quantity. The exact relationship between sensitivity and specificity to precision depends on the percent of positive cases in the population.
- In simple terms, high precision means that an algorithm returned substantially more relevant results than irrelevant ones, while high recall means that an algorithm returned most of the relevant results.
| True condition | ||||||
| Total population | Condition positive | Condition negative | Prevalence = Σ Condition positive/Σ Total population | Accuracy (ACC) = Σ True positive + Σ True negative/Σ Total population | ||
| Predicted condition |
Predicted condition positive |
True positive, Power |
False positive, Type I error |
Positive predictive value (PPV), Precision = Σ True positive/Σ Predicted condition positive | False discovery rate (FDR) = Σ False positive/Σ Predicted condition positive | |
| Predicted condition negative |
False negative, Type II error |
True negative | False omission rate (FOR) = Σ False negative/Σ Predicted condition negative | Negative predictive value (NPV) = Σ True negative/Σ Predicted condition negative | ||
| True positive rate (TPR), Recall, Sensitivity, probability of detection = Σ True positive/Σ Condition positive | False positive rate (FPR), Fall-out, probability of false alarm = Σ False positive/Σ Condition negative | Positive likelihood ratio (LR+) = TPR/FPR | Diagnostic odds ratio (DOR) = LR+/LR− | F1 score = 2 · Precision · Recall/Precision + Recall | ||
| False negative rate (FNR), Miss rate = Σ False negative/Σ Condition positive | Specificity (SPC), Selectivity, True negative rate (TNR) = Σ True negative/Σ Condition negative | Negative likelihood ratio (LR−) = FNR/TNR | ||||
Receiver operating characteristic - Wikipedia
- https://en.wikipedia.org/wiki/Receiver_operating_characteristic
- A receiver operating characteristic curve, or ROC curve, is a graphical plot that illustrates the diagnostic ability of a binary classifier system as its discrimination threshold is varied.
- The ROC curve is created by plotting the true positive rate (TPR) against the false positive rate (FPR) at various threshold settings. The true-positive rate is also known as sensitivity, recall or probability of detection[4] in machine learning. The false-positive rate is also known as the fall-out or probability of false alarm[4] and can be calculated as (1 − specificity). It can also be thought of as a plot of the power as a function of the Type I Error of the decision rule (when the performance is calculated from just a sample of the population, it can be thought of as estimators of these quantities). The ROC curve is thus the sensitivity as a function of fall-out. In general, if the probability distributions for both detection and false alarm are known, the ROC curve can be generated by plotting the cumulative distribution function (area under the probability distribution from {\displaystyle -\infty }
to the discrimination threshold) of the detection probability in the y-axis versus the cumulative distribution function of the false-alarm probability on the x-axis.
- ROC analysis provides tools to select possibly optimal models and to discard suboptimal ones independently from (and prior to specifying) the cost context or the class distribution. ROC analysis is related in a direct and natural way to cost/benefit analysis of diagnostic decision making.
- The ROC curve was first developed by electrical engineers and radar engineers during World War II for detecting enemy objects in battlefields and was soon introduced to psychology to account for perceptual detection of stimuli. ROC analysis since then has been used in medicine, radiology, biometrics, forecasting of natural hazards,[5]meteorology,[6] model performance assessment,[7] and other areas for many decades and is increasingly used in machine learning and data mining research.
- The ROC is also known as a relative operating characteristic curve, because it is a comparison of two operating characteristics (TPR and FPR) as the criterion changes.[8]
Machine Learning with Python: Confusion Matrix in Machine Learning with Python
- https://www.python-course.eu/confusion_matrix.php
学习笔记之Machine Learning Crash Course | Google Developers - 浩然119 - 博客园
- https://www.cnblogs.com/pegasus923/p/10508444.html
- Classification: ROC Curve and AUC | Machine Learning Crash Course | Google Developers
- https://developers.google.com/machine-learning/crash-course/classification/roc-and-auc
- 一键入门型介绍,基础知识介绍得很系统。
精确率与召回率,RoC曲线与PR曲线 - 刘建平Pinard - 博客园
- https://www.cnblogs.com/pinard/p/5993450.html
- 主要是概念上的介绍。
机器学习之分类性能度量指标 : ROC曲线、AUC值、正确率、召回率 - 简书
- https://www.jianshu.com/p/c61ae11cc5f6
- https://zhwhong.cn/2017/04/14/ROC-AUC-Precision-Recall-analysis/
- 详细介绍ROC/Theshold影响/AUC并有配图,能更好理解。
精确率、召回率、F1 值、ROC、AUC 各自的优缺点是什么? - 知乎
- https://www.zhihu.com/question/30643044
- 对ROC / PR / Threshold的调整 解释得很详细很到位。
模型评估方法基础总结 - AI遇见机器学习
- https://mp.weixin.qq.com/s/nZfu90fOwfNXx3zRtRlHFA
- 基础概念介绍。
- 一、留出法
- 二、交叉验证
- 1.简单交叉验证
- 2.S折交叉验证
- 3.留一交叉验证
- 三、自助法
- 四、调参与最终模型
- 我们在算法学习中,还经常会遇到有参数(parameter)需要设定(像是梯度上升的步长),参数配置的不同,往往也会影响到模型的性能。这中对算法参数的设定,就是我们通常所说的“参数调节”,简称调参(parameter tuning)。
- 而机器学习涉及的参数有两种:
- 第一种是我们需要人为设置的参数,这种参数称为超参数,数目通常在10个以内
- 另一类是模型参数,数目可能很多,在大型深度学习模型中甚至会有上百亿个参数。
全面理解模型性能评估方法 - 机器学习算法与自然语言处理
- https://mp.weixin.qq.com/s/5kWdmi8LgdDTjJ40lqz9_A
- 总结介绍各个方法,并有公式配图。
- 评估模型,不仅需要有效可行的实验估计方法,还需要有衡量模型泛化能力的评价标准,这便是性能度量(performance measure)。
- 性能度量反映任务需求,在对比不同模型的能力时,使用不同的性能度量往往会导致不同的评判结果,也即是说,模型的好坏其实也是相对的,什么样的模型是“合适”的,不仅和算法与数据有关,还和任务需求有关,而本章所述的性能度量,便是由任务需求出发,用于衡量模型的方法。
- 一、均方误差
- 二、错误率与精度
- 三、查准率、查全率
- 四、平衡点(Break-Even Point , BEP)与F1
- 五、多个二分类混淆矩阵的综合考查
- 六、ROC与AUC
- 七、代价敏感错误率与代价曲线
How to tune threshold to get different confusion matrix ?
- Note : be careful to avoid overfitting.
- classification - Scikit - changing the threshold to create multiple confusion matrixes - Stack Overflow
- https://stackoverflow.com/questions/32627926/scikit-changing-the-threshold-to-create-multiple-confusion-matrixes
- python - scikit .predict() default threshold - Stack Overflow
- https://stackoverflow.com/questions/19984957/scikit-predict-default-threshold
- python - How to set a threshold for a sklearn classifier based on ROC results? - Stack Overflow
- https://stackoverflow.com/questions/41864083/how-to-set-a-threshold-for-a-sklearn-classifier-based-on-roc-results?noredirect=1&lq=1
- python - how to set threshold to scikit learn random forest model - Stack Overflow
- https://stackoverflow.com/questions/49785904/how-to-set-threshold-to-scikit-learn-random-forest-model
学习笔记之Model selection and evaluation的更多相关文章
- scikit-learn:3. Model selection and evaluation
參考:http://scikit-learn.org/stable/model_selection.html 有待翻译,敬请期待: 3.1. Cross-validation: evaluating ...
- (转)Qt Model/View 学习笔记 (三)——Model类
Model类 基本概念 在model/view构架中,model为view和delegates使用数据提供了标准接口.在Qt中,标准接口QAbstractItemModel类中被定义.不管数据在底层以 ...
- ASP.NET MVC5 学习笔记-3 Model
1. Model 1.1 添加一个模型 注意,添加属性时可以输入"prop",会自动输入代码段. public class CheckoutAccount { public int ...
- 学习笔记之机器学习(Machine Learning)
机器学习 - 维基百科,自由的百科全书 https://zh.wikipedia.org/wiki/%E6%9C%BA%E5%99%A8%E5%AD%A6%E4%B9%A0 机器学习是人工智能的一个分 ...
- Scikit-learn:模型选择Model selection
http://blog.csdn.net/pipisorry/article/details/52250983 选择合适的estimator 通常机器学习最难的一部分是选择合适的estimator,不 ...
- 学习笔记之scikit-learn
scikit-learn: machine learning in Python — scikit-learn 0.20.0 documentation https://scikit-learn.or ...
- 【Ext.Net学习笔记】06:Ext.Net GridPanel的用法(GridPanel 折叠/展开行、GridPanel Selection、 可编辑的GridPanel)
GridPanel 折叠/展开行 Ext.Net GridPanel的行支持折叠/展开功能,这个功能个人觉得还说很有用处的,尤其是数据中包含图片等内容的时候. 下面来看看效果: 使用行折叠/展开功能之 ...
- Ext.Net学习笔记17:Ext.Net GridPanel Selection
Ext.Net学习笔记17:Ext.Net GridPanel Selection 接下来是Ext.Net的GridPanel的另外一个功能:选择. 我们在GridPanel最开始的用法中已经见识过如 ...
- Andrew Ng机器学习公开课笔记 -- Regularization and Model Selection
网易公开课,第10,11课 notes,http://cs229.stanford.edu/notes/cs229-notes5.pdf Model Selection 首先需要解决的问题是,模型 ...
随机推荐
- 使用nginx作为webservice接口代理
通常情况下,企业并不会直接开放系统接口给到外网,并且在企业内部同样有SOA或者ESB这样的接口统一管理的工具. 那么,大多数情况下,如果需要与外部系统,如云系统,或者其他企业的系统做接口时采取的方式如 ...
- 指导手册01:安装Hadoop
指导手册01:安装Hadoop Part 1:安装及配置虚拟机 1.安装Linux. (1)打开VMvirtualBox (2) 控制->新建虚拟机,输入虚拟机名称“marst+学号” 类型: ...
- 使用jsoup轻松爬数据
刚刚学习爬虫,感觉使用jsoup爬虫挺容易的.记录一下自己爬取数据的过程. Jsoup介绍: Jsoup 是一个 Java 的开源HTML解析器,可直接解析某个URL地址.HTML文本内容.使用Jso ...
- Linux分区知识及企业场景分区76
文件系统就相当于装修一样.这个硬盘拿过来了,分完区了,没有格式化. 没有格式化就相当于没有装修.[分区]不是必须的. 如果没有文件系统就不能放数据,文件系统可以理解为一个软件, 它的实现形式是软件,这 ...
- 安装软件碰见error2502 2503
把鼠标放到Win8屏幕的最左下角,等待Win8 Metro界面的缩略图出现后点击鼠标右键,在弹出的菜单中选择“命令提示符(管理员)” 打开的“命令提示符(管理员)” 找到自己将要安装的程序路径 ...
- nginx下运行php的程序时返回200访问却是空白页问题的解决方法
由于nginx与php-fpm之间的一个小bug,会导致这样的现象: 网站中的静态页面 *.html 都能正常访问,而 *.php 文件虽然会返回200状态码, 但实际输出给浏览器的页面内容却是空白. ...
- L2-020. 功夫传人*
L2-020. 功夫传人 参考博客 #include<vector> #include<cstring> #include<algorithm> using nam ...
- LVS DR模式搭建、keepalived+lvs
1.LVS DR模式搭建 条件: 即三台机器,在同一内网. 编辑脚本文件:/usr/local/sbin/lvs_dr.sh #! /bin/bashecho 1 > /proc/sys/net ...
- django jquery ajax 知识点
示例: 1 2 3 4 5 6 7 8 9 10 11 12 13 14 <div id='d'>1</div> <div> <div id='i1' nam ...
- 阿里java开发规范 强制约束
http://news.51cto.com/art/201901/591018.htm :阿里开发强制要求的11条索引创建规范,提高性能 https://blog.csdn.net/Lujunwei ...