
Android性能优化工具之Systrace
本文大部分内容来自:http://www.androidperformance.com/android-performance-tools-systrace-1.html?utm_source=tuicool
Systrace是Android4.1中新增的性能数据采样和分析工具。它可帮助开发者收集Android关键子系统(如surfaceflinger、WindowManagerService等Framework部分关键模块、服务,View系统等)的运行信息,从而帮助开发者更直观的分析系统瓶颈,改进性能。
Systrace的功能包括跟踪系统的I/O操作、内核工作队列、CPU负载以及Android各个子系统的运行状况等。在Android平台中,它主要由3部分组成:
- 内核部分:Systrace利用了Linux Kernel中的ftrace功能。所以,如果要使用Systrace的话,必须开启kernel中和ftrace相关的模块。
- 数据采集部分:Android定义了一个Trace类。应用程序可利用该类把统计信息输出给ftrace。同时,Android还有一个atrace程序,它可以从ftrace中读取统计信息然后交给数据分析工具来处理。
- 数据分析工具:Android提供一个systrace.py(python脚本文件,位于Android SDK目录/tools/systrace中,其内部将调用atrace程序)用来配置数据采集的方式(如采集数据的标签、输出文件名等)和收集ftrace统计数据并生成一个结果网页文件供用户查看。 从本质上说,Systrace是对Linux Kernel中ftrace的封装。应用进程需要利用Android提供的Trace类来使用Systrace.
关于Systrace的官方介绍和使用可以看这里:Systrace
1.Systrace简单使用
使用Systrace前,要先了解一下Systrace在各个平台上的使用方法,鉴于大家使用Eclipse和Android Studio的居多,所以直接摘抄官网关于这个的使用方法,不过不管是什么工具,流程是一样的:
- 手机准备好你要进行抓取的界面
- 点击开始抓取(命令行的话就是开始执行命令)
- 手机上开始操作
- 设定好的时间到了之后,会将生成Trace文件,使用Chrome将这个文件打开进行分析
Using Eclipse
- In Eclipse, open an Android application project.
- Switch to the DDMS perspective, by selecting Window > Perspectives > DDMS.
- In the Devices tab, select the device on which to run a trace. If no devices are listed, make sure your device is connected via USB cable and that debugging is enabled on the device.
- Click the Systrace icon at the top of the Devices panel to configure tracing.
- Set the tracing options and click OK to start the trace.
Using Android Studio
- In Android Studio, open an Android application project.
- Open the Device Monitor by selecting Tools > Android > Monitor.
- In the Devices tab, select the device on which to run a trace. If no devices are listed, make sure your device is connected via USB cable and that debugging is enabled on the device.
- Click the Systrace icon at the top of the Devices panel to configure tracing.
- Set the tracing options and click OK to start the trace.
Using Device Monitor
- Navigate to your SDK tools/ directory.
- Run the monitor program.
- In the Devices tab, select the device on which to run a trace. If no devices are listed, make sure your device is connected via USB cable and that debugging is enabled on the device.
- Click the Systrace icon at the top of the Devices panel to configure tracing.
- Set the tracing options and click OK to start the trace.
图解:
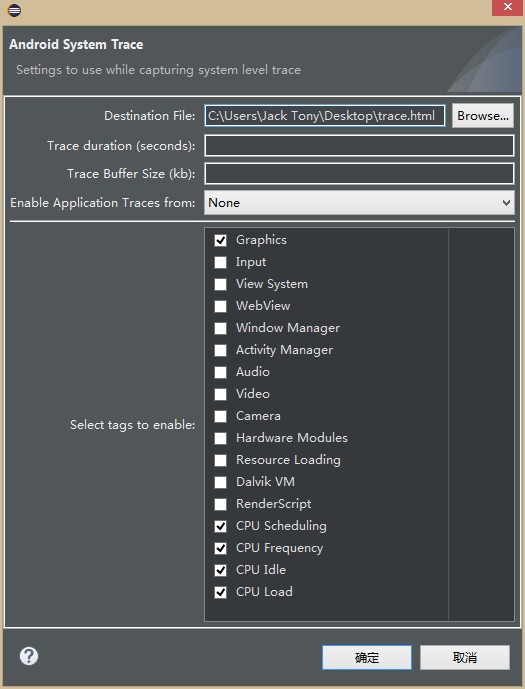
首先进入DDMS,然后点击设备,点击Systrace按钮,接着选择测试项,这里可以设定时间。点击确定后开始操作手机,在时间到了后会自动生成报表。


参考自:
http://blog.csdn.net/tommy_wxie/article/details/8636853
http://www.androidperformance.com/android-performance-tools-systrace-1.html?utm_source=tuicool
Android性能优化工具之Systrace的更多相关文章
- Linux/Android 性能优化工具 perf
/***************************************************************************** * Linux/Android 性能优化工 ...
- (转)Android性能优化——工具篇
Android性能优化是Android开发中经常遇见的一个问题,接下来将对Android性能优化方面的知识点做一个简单的梳理和总结,将从工具和代码两方面进行梳理.所谓工欲善其事必先利其器,本文首先来看 ...
- android 性能优化-工具篇
一.Traceview 使用TraceView主要有两种方式: 1.直接打开DDMS,选择一个进程,然后按上面的“Start Method Profiling”按钮,等红色小点变成黑色以后就表示Tra ...
- Android 性能优化之工具和优化点总结
Android性能优化学习 最近公司主抓性能优化工作,借此春风也学习到了许多Android性能优化方面的知识.由于组内队友的给力,优化的成果也是比较喜人.同时也学习和实践了不少知识,特此记录. 1.性 ...
- 【腾讯Bugly干货分享】Android性能优化典范——第6季
本文来自于腾讯bugly开发者社区,非经作者同意,请勿转载,原文地址:http://dev.qq.com/topic/580d91208d80e49771f0a07c 导语 这里是Android性能优 ...
- Android性能优化典范(二)
Google前几天刚发布了Android性能优化典范第2季的课程,一共20个短视频,包括的内容大致有:电量优化,网络优化,Wear上如何做优化,使用对象池来提高效率,LRU Cache,Bitmap的 ...
- android app性能优化大汇总(google官方Android性能优化典范 - 第2季)
Google前几天刚发布了Android性能优化典范第2季的课程,一共20个短视频,包括的内容大致有:电量优化,网络优化,Wear上如何做优化,使用对象池来提高效率,LRU Cache,Bitmap的 ...
- 正确使用Android性能分析工具——TraceView
http://blog.jobbole.com/78995/ 首页 最新文章 IT 职场 前端 后端 移动端 数据库 运维 其他技术 - 导航条 - 首页 最新文章 IT 职场 前端 - Ja ...
- Android性能优化典范 - 第2季
Google发布了Android性能优化典范第2季的课程,一共20个短视频,包括的内容大致有:电量优化,网络优化,Wear上如何做优化,使用对象池来提高效率,LRU Cache,Bitmap的缩放,缓 ...
随机推荐
- .NetCore下使用Polly结合IHttpClientFactory实现聚合服务
在使用微服务的过程中经常会遇到这样的情况,就目前我遇到的问题做下分析 情况一: 这里服务对于前后端分离情况来说,多使用查询服务,前端直接获取不同服务的数据展示,如果出现其中的服务失败,对业务数据无影响 ...
- 一步一步学习IdentityServer3 (4)
其实上述例子 很多都很找到 但是在实际生态环境中给例子有很多不一样的地方 比如自定已登录界面怎么做? 怎么访问自己的用户数据库实现登录? 怎么在接口中使用,在接口中又怎么实现与Idr3结合授权? 等等 ...
- 《深入分析JavaWeb技术内幕》学习笔记
第一章 深入Web请求过程 1.1 B/S网站架构概述 HTTP协议采用无状态的短连接的通信方式.通常一次请求就完成一次数据交互,通常也对应一个业务逻辑. 当在浏览器里输入一个URL,首先会请求DNS ...
- json多态序列化
https://blog.csdn.net/java_huashan/article/details/46428971 https://blog.csdn.net/bruce128/article/d ...
- 【AtCoder】AGC024
A - Fairness 如果奇数次是b - a 否则是a - b #include <bits/stdc++.h> #define fi first #define se second ...
- 主动学习(Active Learning)
主动学习简介 在某些情况下,没有类标签的数据相当丰富而有类标签的数据相当稀少,并且人工对数据进行标记的成本又相当高昂.在这种情况下,我们可以让学习算法主动地提出要对哪些数据进行标注,之后我们要将这些数 ...
- ClouderaManager中Event Server报No such file or directory
错误日志如下: 2015-06-24 06:13:10,176 ERROR com.cloudera.cmf.eventcatcher.server.EventCatcherService: Erro ...
- shiro双realm验证
假设现在有这样一种需求:存在两张表user和admin,分别记录普通用户和管理员的信息.并且现在要实现普通用户和管理员的分开登录,即需要两个Realm——UserRealm和AdminRealm,分别 ...
- Nessus漏洞扫描教程之使用Nmap工具扫描识别指纹
Nessus漏洞扫描教程之使用Nmap工具扫描识别指纹 Nmap工具的准备工作 当用户对Nessus工具有清晰的认识后,即可使用该工具实施扫描.但是,在扫描之前需要做一些准备工作,如探测网络中活动的主 ...
- Django(request和response)
原文链接: https://blog.csdn.net/weixin_31449201/article/details/81043326 Django中的请求与响应 一.请求request djang ...