
MySQL调优性能监控之show profile
用show profile查询工具指定具体的type
show profile在mysql5.7之后过时
show profile命令用于跟踪执行过的sql语句的资源消耗信息,可以帮助查看sql语句的执行情况,可以在做性能分析或者问题诊断的时候作为参考。在MySQL5.7中, show profile命令已经开始不推荐使用,MySQL使用performance_schema 中系统表的信息来替代show profile命令,这儿主要是研究资源性能监控的思路。
SHOW PROFILE [type [, type] ... ]

    [FOR QUERY n]

    [LIMIT row_count [OFFSET offset]]

type:

    ALL

  | BLOCK IO

  | CONTEXT SWITCHES

  | CPU

  | IPC

  | MEMORY

  | PAGE FAULTS

  | SOURCE

  | SWAPS
此工具默认是禁用的,首先打开show profile跟踪记录SQL执行情况的配置,可以通过服务器变量在会话级别动态的修改:
mysql> set profiling = 1;

Query OK, 0 rows affected, 1 warning (0.00 sec)
当设置完成之后,在服务器上执行的所有语句,都会测量其耗费的时间和其他一些查询执行状态变更相关的数据。
以下面查询语句举例:
mysql> select * from emp;

+-------+--------+-----------+------+------------+---------+---------+--------+

| empno | ename  | job       | mgr  | hiredate   | sal     | comm    | deptno |

+-------+--------+-----------+------+------------+---------+---------+--------+

|  7369 | SMITH  | CLERK     | 7902 | 1980-12-17 |  800.00 |    NULL |     20 |

|  7499 | ALLEN  | SALESMAN  | 7698 | 1981-02-20 | 1600.00 |  300.00 |     30 |

|  7521 | WARD   | SALESMAN  | 7698 | 1981-02-22 | 1250.00 |  500.00 |     30 |

|  7566 | JONES  | MANAGER   | 7839 | 1981-04-02 | 2975.00 |    NULL |     20 |

|  7654 | MARTIN | SALESMAN  | 7698 | 1981-09-28 | 1250.00 | 1400.00 |     30 |

|  7698 | BLAKE  | MANAGER   | 7839 | 1981-05-01 | 2850.00 |    NULL |     30 |

|  7782 | CLARK  | MANAGER   | 7839 | 1981-06-09 | 2450.00 |    NULL |     10 |

|  7788 | SCOTT  | ANALYST   | 7566 | 1987-07-13 | 3000.00 |    NULL |     20 |

|  7839 | KING   | PRESIDENT | NULL | 1981-11-17 | 5000.00 |    NULL |     10 |

|  7844 | TURNER | SALESMAN  | 7698 | 1981-09-08 | 1500.00 |    0.00 |     30 |

|  7876 | ADAMS  | CLERK     | 7788 | 1987-07-13 | 1100.00 |    NULL |     20 |

|  7900 | JAMES  | CLERK     | 7698 | 1981-12-03 |  950.00 |    NULL |     30 |

|  7902 | FORD   | ANALYST   | 7566 | 1981-12-03 | 3000.00 |    NULL |     20 |

|  7934 | MILLER | CLERK     | 7782 | 1982-01-23 | 1300.00 |    NULL |     10 |

+-------+--------+-----------+------+------------+---------+---------+--------+

14 rows in set (0.01 sec)
在mysql的命令行模式下只能显示两位小数的时间,可以使用如下命令查看具体的执行时间
mysql> show profiles;

+----------+------------+-------------------+

| Query_ID | Duration   | Query             |

+----------+------------+-------------------+

|        1 | 0.00130500 | show databases    |

|        2 | 0.00010250 | SELECT DATABASE() |

|        3 | 0.00027500 | show databases    |

|        4 | 0.00023075 | show tables       |

|        5 | 0.00041800 | show databases    |

|        6 | 0.00018925 | show tables       |

|        7 | 0.00376825 | select * from emp |

+----------+------------+-------------------+

7 rows in set, 1 warning (0.00 sec)
上面一共有7条sql语句操作,执行如下命令可以查看详细的每个步骤的时间,这儿以Query_ID = 1的语句举例子:
mysql> show profile for query 1 ;

+----------------------+----------+

| Status               | Duration |

+----------------------+----------+

| starting             | 0.000089 |

| checking permissions | 0.000025 |

| Opening tables       | 0.000062 |

| init                 | 0.000036 |

| System lock          | 0.000007 |

| optimizing           | 0.000004 |

| statistics           | 0.000023 |

| preparing            | 0.000039 |

| executing            | 0.000910 |

| Sending data         | 0.000019 |

| end                  | 0.000016 |

| query end            | 0.000006 |

| closing tables       | 0.000002 |

| removing tmp table   | 0.000004 |

| closing tables       | 0.000016 |

| freeing items        | 0.000013 |

| cleaning up          | 0.000036 |

+----------------------+----------+

17 rows in set, 1 warning (0.00 sec)
除了query n指定Query_ID外,还可以设置Type查看MYSQL语句执行的其他信息,type主要参数如下:
all:显示所有性能信息
block io:显示块io操作的次数
context switches:显示上下文切换次数,被动和主动
cpu:显示用户cpu时间、系统cpu时间
IPC:显示发送和接受的消息数量
Memory:暂未实现
page faults:显示页错误数量
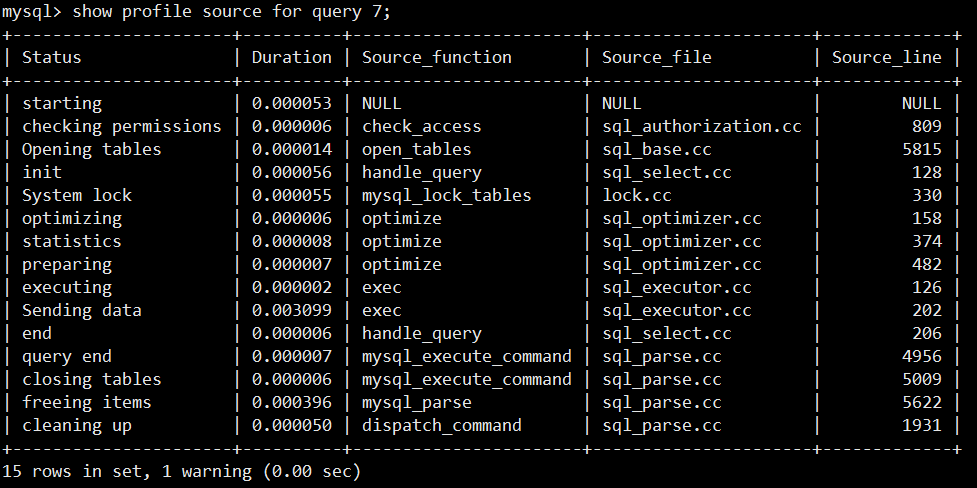
source:显示源码中的函数名称与位置
swaps:显示swap的次数
##all显示内容太宽,这儿暂不显示

mysql> show profile all for query 7;
block io
# block io

mysql> mysql> show  profile block io fo 7;

+----------------------+----------+--------------+---------------+

| Status               | Duration | Block_ops_in | Block_ops_out |

+----------------------+----------+--------------+---------------+

| starting             | 0.000053 |            0 |             0 |

| checking permissions | 0.000006 |            0 |             0 |

| Opening tables       | 0.000014 |            0 |             0 |

| init                 | 0.000056 |            0 |             0 |

| System lock          | 0.000055 |            0 |             0 |

| optimizing           | 0.000006 |            0 |             0 |

| statistics           | 0.000008 |            0 |             0 |

| preparing            | 0.000007 |            0 |             0 |

| executing            | 0.000002 |            0 |             0 |

| Sending data         | 0.003099 |            0 |             0 |

| end                  | 0.000006 |            0 |             0 |

| query end            | 0.000007 |            0 |             0 |

| closing tables       | 0.000006 |            0 |             0 |

| freeing items        | 0.000396 |            0 |             0 |

| cleaning up          | 0.000050 |            0 |             0 |

+----------------------+----------+--------------+---------------+

15 rows in set, 1 warning (0.00 sec)
context switches
#context switches

mysql> show profile context switches for query 1;

+----------------------+----------+-------------------+---------------------+

| Status               | Duration | Context_voluntary | Context_involuntary |

+----------------------+----------+-------------------+---------------------+

| starting             | 0.000089 |                 0 |                   0 |

| checking permissions | 0.000025 |                 0 |                   0 |

| Opening tables       | 0.000062 |                 0 |                   0 |

| init                 | 0.000036 |                 0 |                   0 |

| System lock          | 0.000007 |                 0 |                   0 |

| optimizing           | 0.000004 |                 0 |                   0 |

| statistics           | 0.000023 |                 0 |                   0 |

| preparing            | 0.000039 |                 0 |                   0 |

| executing            | 0.000910 |                 0 |                   0 |

| Sending data         | 0.000019 |                 0 |                   0 |

| end                  | 0.000016 |                 0 |                   0 |

| query end            | 0.000006 |                 0 |                   0 |

| closing tables       | 0.000002 |                 0 |                   0 |

| removing tmp table   | 0.000004 |                 0 |                   0 |

| closing tables       | 0.000016 |                 0 |                   0 |

| freeing items        | 0.000013 |                 0 |                   0 |

| cleaning up          | 0.000036 |                 0 |                   0 |

+----------------------+----------+-------------------+---------------------+

17 rows in set, 1 warning (0.00 sec)
cpu
#cpu

mysql> show profile cpu for query 7;

+----------------------+----------+----------+------------+

| Status               | Duration | CPU_user | CPU_system |

+----------------------+----------+----------+------------+

| starting             | 0.000053 | 0.000000 |   0.000000 |

| checking permissions | 0.000006 | 0.000000 |   0.000000 |

| Opening tables       | 0.000014 | 0.000000 |   0.000000 |

| init                 | 0.000056 | 0.000000 |   0.000000 |

| System lock          | 0.000055 | 0.000000 |   0.000000 |

| optimizing           | 0.000006 | 0.000000 |   0.000000 |

| statistics           | 0.000008 | 0.000000 |   0.000000 |

| preparing            | 0.000007 | 0.000000 |   0.000000 |

| executing            | 0.000002 | 0.000000 |   0.000000 |

| Sending data         | 0.003099 | 0.002000 |   0.000000 |

| end                  | 0.000006 | 0.000000 |   0.000000 |

| query end            | 0.000007 | 0.000000 |   0.000000 |

| closing tables       | 0.000006 | 0.000000 |   0.000000 |

| freeing items        | 0.000396 | 0.001000 |   0.000000 |

| cleaning up          | 0.000050 | 0.000000 |   0.000000 |

+----------------------+----------+----------+------------+

15 rows in set, 1 warning (0.00 sec)
ipc
#ipc

mysql> show profile ipc for query 1;

+----------------------+----------+---------------+-------------------+

| Status               | Duration | Messages_sent | Messages_received |

+----------------------+----------+---------------+-------------------+

| starting             | 0.000089 |             0 |                 0 |

| checking permissions | 0.000025 |             0 |                 0 |

| Opening tables       | 0.000062 |             0 |                 0 |

| init                 | 0.000036 |             0 |                 0 |

| System lock          | 0.000007 |             0 |                 0 |

| optimizing           | 0.000004 |             0 |                 0 |

| statistics           | 0.000023 |             0 |                 0 |

| preparing            | 0.000039 |             0 |                 0 |

| executing            | 0.000910 |             0 |                 0 |

| Sending data         | 0.000019 |             0 |                 0 |

| end                  | 0.000016 |             0 |                 0 |

| query end            | 0.000006 |             0 |                 0 |

| closing tables       | 0.000002 |             0 |                 0 |

| removing tmp table   | 0.000004 |             0 |                 0 |

| closing tables       | 0.000016 |             0 |                 0 |

| freeing items        | 0.000013 |             0 |                 0 |

| cleaning up          | 0.000036 |             0 |                 0 |

+----------------------+----------+---------------+-------------------+

17 rows in set, 1 warning (0.00 sec)
page faults
# page faults

mysql> show profile page faults for query 1;

+----------------------+----------+-------------------+-------------------+

| Status               | Duration | Page_faults_major | Page_faults_minor |

+----------------------+----------+-------------------+-------------------+

| starting             | 0.000089 |                 0 |                 0 |

| checking permissions | 0.000025 |                 0 |                 0 |

| Opening tables       | 0.000062 |                 0 |                 0 |

| init                 | 0.000036 |                 0 |                 0 |

| System lock          | 0.000007 |                 0 |                 0 |

| optimizing           | 0.000004 |                 0 |                 0 |

| statistics           | 0.000023 |                 0 |                 0 |

| preparing            | 0.000039 |                 0 |                 0 |

| executing            | 0.000910 |                 0 |                 1 |

| Sending data         | 0.000019 |                 0 |                 0 |

| end                  | 0.000016 |                 0 |                 0 |

| query end            | 0.000006 |                 0 |                 0 |

| closing tables       | 0.000002 |                 0 |                 0 |

| removing tmp table   | 0.000004 |                 0 |                 0 |

| closing tables       | 0.000016 |                 0 |                 0 |

| freeing items        | 0.000013 |                 0 |                 0 |

| cleaning up          | 0.000036 |                 0 |                 0 |

+----------------------+----------+-------------------+-------------------+

17 rows in set, 1 warning (0.00 sec)
source
swaps
# swaps

mysql> show profile swaps for query 7;

+----------------------+----------+-------+

| Status               | Duration | Swaps |

+----------------------+----------+-------+

| starting             | 0.000053 |     0 |

| checking permissions | 0.000006 |     0 |

| Opening tables       | 0.000014 |     0 |

| init                 | 0.000056 |     0 |

| System lock          | 0.000055 |     0 |

| optimizing           | 0.000006 |     0 |

| statistics           | 0.000008 |     0 |

| preparing            | 0.000007 |     0 |

| executing            | 0.000002 |     0 |

| Sending data         | 0.003099 |     0 |

| end                  | 0.000006 |     0 |

| query end            | 0.000007 |     0 |

| closing tables       | 0.000006 |     0 |

| freeing items        | 0.000396 |     0 |

| cleaning up          | 0.000050 |     0 |

+----------------------+----------+-------+

15 rows in set, 1 warning (0.00 sec)
MySQL调优性能监控之show profile的更多相关文章
- MySQL调优性能监控之performance schema
一.performance_schema的介绍 performance:性能 schema:图(表)示,以大纲或模型的形式表示计划或理论. MySQL的performance schema 用于监控M ...
- MySQL(调优慢查询、explain profile) 转
转自http://www.linuxidc.com/Linux/2012-09/70459.htm mysql profile explain slow_query_log分析优化查询 在做性能测试中 ...
- MySQL调优用户监控之show processlist
简介 show processlist显示这台MySQL正在连接的用户: mysql> show processlist; +----+------+-----------+-------+-- ...
- MySQL 调优/优化的 100 个建议
MySQL 调优/优化的 100 个建议 MySQL是一个强大的开源数据库.随着MySQL上的应用越来越多,MySQL逐渐遇到了瓶颈.这里提供 101 条优化 MySQL 的建议.有些技巧适合特定 ...
- mysql调优学习笔记
性能监控 使用show profile查询剖析工具,可以指定具体的type 此工具默认是禁用的,可以通过服务器变量在绘画级别动态的修改 set profiling=1; 当设置完成之后,在服务器上执行 ...
- MySQL 调优基础(一) CPU与进程
一般而言,MySQL 的调优可以分为两个层面,一个是在MySQL层面上进行的调优,比如SQL改写,索引的添加,MySQL各种参数的配置:另一个层面是从操作系统的层面和硬件的层面来进行调优.操作系统的层 ...
- MySQL调优系列基础篇
前言 有一段时间没有写博客了,整天都在忙,上班,录制课程,恰巧最近一段时间比较清闲,打算弄弄MYSQL数据库. 关于MySQL数据库,这里就不做过多的介绍,开源.免费等特性深受各个互联网行业喜爱,尤其 ...
- mysql调优 基础
MySQL调优可以从几个方面来做: 1. 架构层:做从库,实现读写分离: 2.系统层次:增加内存:给磁盘做raid0或者raid5以增加磁盘的读写速度:可以重新挂载磁盘,并加上noatime参数,这样 ...
- MySQL调优 —— Using temporary
DBA发来一个线上慢查询问题. SQL例如以下(为突出重点省略部分内容): select distinct article0_.id, 等字段 from article_table article ...
随机推荐
- Python 微信公众号文章爬取
一.思路 我们通过网页版的微信公众平台的图文消息中的超链接获取到我们需要的接口 从接口中我们可以得到对应的微信公众号和对应的所有微信公众号文章. 二.接口分析 获取微信公众号的接口: https:// ...
- 图数据库 Nebula Graph 在 Boss 直聘的应用
本文首发于 Nebula Graph 官方博客:https://nebula-graph.com.cn/posts/nebula-graph-risk-control-boss-zhipin/ 摘要: ...
- C#中的深度学习(五):在ML.NET中使用预训练模型进行硬币识别
在本系列的最后,我们将介绍另一种方法,即利用一个预先训练好的CNN来解决我们一直在研究的硬币识别问题. 在这里,我们看一下转移学习,调整预定义的CNN,并使用Model Builder训练我们的硬币识 ...
- 安装简易OpenShift单节点并配置DNS泛域名
1 楔子 公司有个项目部署在 OpenShift 容器云平台上,出现问题较多,于是萌生在公司环境搭建现场仿真环境,由于资源没有生产环境多,就使用单节点简单模拟下 本文主要内容包括以下: 使用 Dnsm ...
- 关于django的坑(一)
关于django orm 的坑: 关于设置数据库表自动更新 django的orm关于更新数据库的方法有update和save两种方法.想要表中自动更新需要一下几个条件: 使用 DateTimeFiel ...
- JAVE JDK安装步骤
1.安装JDK 选择安装目录 安装过程中会出现两次 安装提示 .第一次是安装 jdk ,第二次是安装 jre .建议两个都安装在同一个java文件夹中的不同文件夹中.(不能都安装在java文件夹的根目 ...
- JAVA Executor(线程池)框架
一.Executor概述 为更好控制线程,jdk提供一套线程管理框架Executor,帮助开发人员有效地进行线程控制.它们都位于java.util.concurrent包中,是jdk并发包的核心.其中 ...
- ConcurrentHashMap 并发之美
一.前言 她如暴风雨中的一叶扁舟,在高并发的大风大浪下疾驰而过,眼看就要被湮灭,却又在绝境中绝处逢生 编写一套即稳定.高效.且支持并发的代码,不说难如登天,却也绝非易事. 一直有小伙伴向我咨询关于Co ...
- Hbase学习Hbase基础介绍
一.产生背景 自1970年以来,关系数据库用于数据存储和维护有关问题的解决方案.大数据的出现后,好多公司实现处理大数据并从中受益,并开始选择像Hadoop的解决方案.Hadoop使用分布式文件系统,用 ...
- jquery-from+php 文件上传
闲话不多说上代码 前端代码 <!DOCTYPE HTML> <html lang="zh-CN"> <head> <meta charse ...