WPF、Silverlight项目中使用柱状图、饼状图、折线图
在开发的过程中,可能会遇到柱状图、饼状图、折线图来更好的显示数据,最近整理了一下,遂放出来望需要的朋友可以参考。本文仅仅是简单显示,如需复杂显示效果请参考官网代码示例。----本文代码使用WPF,Silverlight类似代码,使用第三方wpf_visifire_v5.1.2-0_trial控件。
后续会放上Html5示例。
代码下载地址:代码下载
先放上一组截图吧:
公共数据:
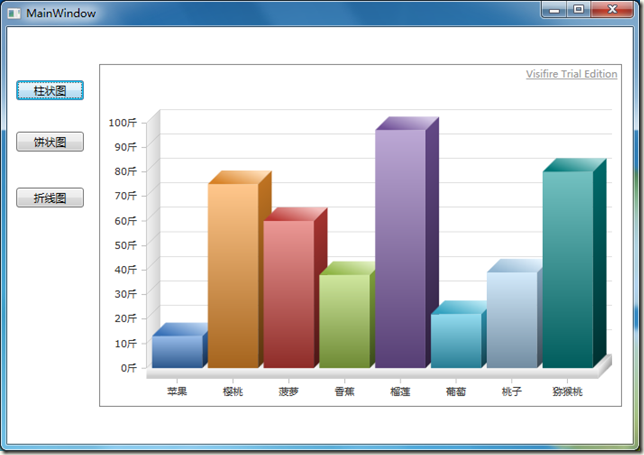
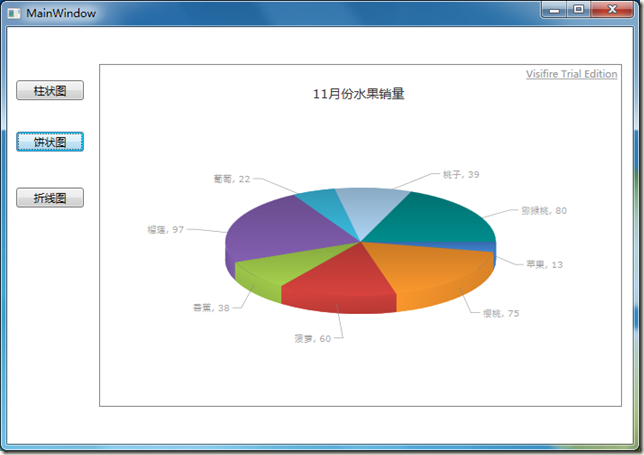
private List<string> strListx = new List<string>() { "苹果", "樱桃", "菠萝", "香蕉", "榴莲", "葡萄", "桃子", "猕猴桃" };
private List<string> strListy = new List<string>() { "13", "75", "60", "38", "97", "22", "39", "80" };
private List<DateTime> LsTime = new List<DateTime>()
{
new DateTime(2012,1,1),
new DateTime(2012,2,1),
new DateTime(2012,3,1),
new DateTime(2012,4,1),
new DateTime(2012,5,1),
new DateTime(2012,6,1),
new DateTime(2012,7,1),
new DateTime(2012,8,1),
new DateTime(2012,9,1),
new DateTime(2012,10,1),
new DateTime(2012,11,1),
new DateTime(2012,12,1),
};
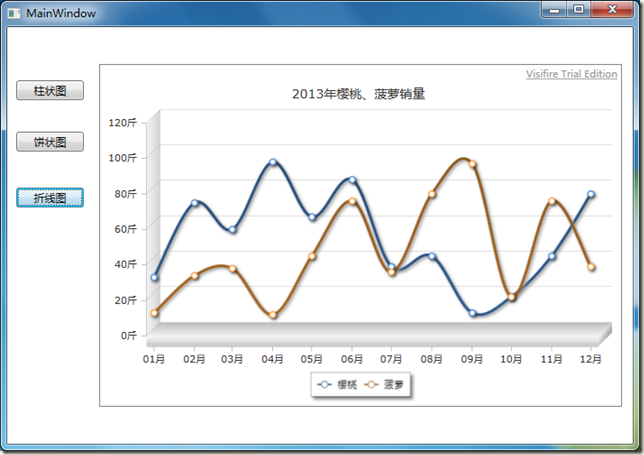
private List<string> cherry = new List<string>() { "33", "75", "60", "98", "67", "88", "39", "45", "13", "22", "45", "80" };
private List<string> pineapple = new List<string>() { "13", "34", "38", "12", "45", "76", "36", "80", "97", "22", "76", "39" };
柱状图:
public void CreateChartColumn(string name, List<string> valuex, List<string> valuey)

        {

            //创建一个图标

            Chart chart = new Chart();

            //设置图标的宽度和高度

            chart.Width = ;

            chart.Height = ;

            chart.Margin = new Thickness(, , , );

            //是否启用打印和保持图片

            chart.ToolBarEnabled = false;

            //设置图标的属性

            chart.ScrollingEnabled = false;//是否启用或禁用滚动

            chart.View3D = true;//3D效果显示

            //创建一个标题的对象

            Title title = new Title();

            //设置标题的名称

            title.Text = Name;

            title.Padding = new Thickness(, , , );

            //向图标添加标题

            chart.Titles.Add(title);

            Axis yAxis = new Axis();

            //设置图标中Y轴的最小值永远为0

            yAxis.AxisMinimum = ;

            //设置图表中Y轴的后缀

            yAxis.Suffix = "斤";

            chart.AxesY.Add(yAxis);

            // 创建一个新的数据线。

            DataSeries dataSeries = new DataSeries();

            // 设置数据线的格式

            dataSeries.RenderAs = RenderAs.StackedColumn;//柱状Stacked

            // 设置数据点

            DataPoint dataPoint;

            for (int i = ; i < valuex.Count; i++)

            {

                // 创建一个数据点的实例。

                dataPoint = new DataPoint();

                // 设置X轴点

                dataPoint.AxisXLabel = valuex[i];

                //设置Y轴点

                dataPoint.YValue = double.Parse(valuey[i]);

                //添加一个点击事件

                dataPoint.MouseLeftButtonDown += new MouseButtonEventHandler(dataPoint_MouseLeftButtonDown);

                //添加数据点

                dataSeries.DataPoints.Add(dataPoint);

            }

            // 添加数据线到数据序列。

            chart.Series.Add(dataSeries);

            //将生产的图表增加到Grid,然后通过Grid添加到上层Grid.

            Grid gr = new Grid();

            gr.Children.Add(chart);

            Simon.Children.Add(gr);

        }
饼状图:
public void CreateChartPie(string name, List<string> valuex, List<string> valuey)

        {

            //创建一个图标

            Chart chart = new Chart();

            //设置图标的宽度和高度

            chart.Width = ;

            chart.Height = ;

            chart.Margin = new Thickness(, , , );

            //是否启用打印和保持图片

            chart.ToolBarEnabled = false;

            //设置图标的属性

            chart.ScrollingEnabled = false;//是否启用或禁用滚动

            chart.View3D = true;//3D效果显示

            //创建一个标题的对象

            Title title = new Title();

            //设置标题的名称

            title.Text = name;

            title.Padding = new Thickness(, , , );

            //向图标添加标题

            chart.Titles.Add(title);

            //Axis yAxis = new Axis();

            ////设置图标中Y轴的最小值永远为0

            //yAxis.AxisMinimum = 0;

            ////设置图表中Y轴的后缀

            //yAxis.Suffix = "斤";

            //chart.AxesY.Add(yAxis);

            // 创建一个新的数据线。

            DataSeries dataSeries = new DataSeries();

            // 设置数据线的格式

            dataSeries.RenderAs = RenderAs.Pie;//柱状Stacked

            // 设置数据点

            DataPoint dataPoint;

            for (int i = ; i < valuex.Count; i++)

            {

                // 创建一个数据点的实例。

                dataPoint = new DataPoint();

                // 设置X轴点

                dataPoint.AxisXLabel = valuex[i];

                dataPoint.LegendText = "##" + valuex[i];

                //设置Y轴点

                dataPoint.YValue = double.Parse(valuey[i]);

                //添加一个点击事件

                dataPoint.MouseLeftButtonDown += new MouseButtonEventHandler(dataPoint_MouseLeftButtonDown);

                //添加数据点

                dataSeries.DataPoints.Add(dataPoint);

            }

            // 添加数据线到数据序列。

            chart.Series.Add(dataSeries);

            //将生产的图表增加到Grid,然后通过Grid添加到上层Grid.

            Grid gr = new Grid();

            gr.Children.Add(chart);

            Simon.Children.Add(gr);

        }
折线图:
public void CreateChartSpline(string name, List<DateTime> lsTime, List<string> cherry, List<string> pineapple)

        {

            //创建一个图标

            Chart chart = new Chart();

            //设置图标的宽度和高度

            chart.Width = ;

            chart.Height = ;

            chart.Margin = new Thickness(, , , );

            //是否启用打印和保持图片

            chart.ToolBarEnabled = false;

            //设置图标的属性

            chart.ScrollingEnabled = false;//是否启用或禁用滚动

            chart.View3D = true;//3D效果显示

            //创建一个标题的对象

            Title title = new Title();

            //设置标题的名称

            title.Text = name;

            title.Padding = new Thickness(, , , );

            //向图标添加标题

            chart.Titles.Add(title);

            //初始化一个新的Axis

            Axis xaxis = new Axis();

            //设置Axis的属性

            //图表的X轴坐标按什么来分类,如时分秒

            xaxis.IntervalType = IntervalTypes.Months;

            //图表的X轴坐标间隔如2,3,20等,单位为xAxis.IntervalType设置的时分秒。

            xaxis.Interval = ;

            //设置X轴的时间显示格式为7-10 11:20

            xaxis.ValueFormatString = "MM月";

            //给图标添加Axis

            chart.AxesX.Add(xaxis);

            Axis yAxis = new Axis();

            //设置图标中Y轴的最小值永远为0

            yAxis.AxisMinimum = ;

            //设置图表中Y轴的后缀

            yAxis.Suffix = "斤";

            chart.AxesY.Add(yAxis);

            // 创建一个新的数据线。

            DataSeries dataSeries = new DataSeries();

            // 设置数据线的格式。

            dataSeries.LegendText = "樱桃";

            dataSeries.RenderAs = RenderAs.Spline;//折线图

            dataSeries.XValueType = ChartValueTypes.DateTime;

            // 设置数据点

            DataPoint dataPoint;

            for (int i = ; i < lsTime.Count; i++)

            {

                // 创建一个数据点的实例。

                dataPoint = new DataPoint();

                // 设置X轴点

                dataPoint.XValue = lsTime[i];

                //设置Y轴点

                dataPoint.YValue = double.Parse(cherry[i]);

                dataPoint.MarkerSize = ;

                //dataPoint.Tag = tableName.Split('(')[0];

                //设置数据点颜色

                // dataPoint.Color = new SolidColorBrush(Colors.LightGray);

                dataPoint.MouseLeftButtonDown += new MouseButtonEventHandler(dataPoint_MouseLeftButtonDown);

                //添加数据点

                dataSeries.DataPoints.Add(dataPoint);

            }

            // 添加数据线到数据序列。

            chart.Series.Add(dataSeries);

            // 创建一个新的数据线。

            DataSeries dataSeriesPineapple = new DataSeries();

            // 设置数据线的格式。

            dataSeriesPineapple.LegendText = "菠萝";

            dataSeriesPineapple.RenderAs = RenderAs.Spline;//折线图

            dataSeriesPineapple.XValueType = ChartValueTypes.DateTime;

            // 设置数据点

            DataPoint dataPoint2;

            for (int i = ; i < lsTime.Count; i++)

            {

                // 创建一个数据点的实例。

                dataPoint2 = new DataPoint();

                // 设置X轴点

                dataPoint2.XValue = lsTime[i];

                //设置Y轴点

                dataPoint2.YValue = double.Parse(pineapple[i]);

                dataPoint2.MarkerSize = ;

                //dataPoint2.Tag = tableName.Split('(')[0];

                //设置数据点颜色

                // dataPoint.Color = new SolidColorBrush(Colors.LightGray);

                dataPoint2.MouseLeftButtonDown += new MouseButtonEventHandler(dataPoint_MouseLeftButtonDown);

                //添加数据点

                dataSeriesPineapple.DataPoints.Add(dataPoint2);

            }

            // 添加数据线到数据序列。

            chart.Series.Add(dataSeriesPineapple);

            //将生产的图表增加到Grid,然后通过Grid添加到上层Grid.

            Grid gr = new Grid();

            gr.Children.Add(chart);

            Simon.Children.Add(gr);

        }
WPF、Silverlight项目中使用柱状图、饼状图、折线图的更多相关文章
- Python的可视化包 – Matplotlib 2D图表(点图和线图,.柱状或饼状类型的图),3D图表(曲面图,散点图和柱状图)
Python的可视化包 – Matplotlib Matplotlib是Python中最常用的可视化工具之一,可以非常方便地创建海量类型地2D图表和一些基本的3D图表.Matplotlib最早是为了可 ...
- Intellij IDEA 中如何查看maven项目中所有jar包的依赖关系图(转载)
Intellij IDEA 中如何查看maven项目中所有jar包的依赖关系图 2017年04月05日 10:53:13 李学凯 阅读数:104997更多 所属专栏: Intellij Idea ...
- 【Excel】绘图案例_常见复合图:簇状图+堆积图+折线图
前言 最近有朋友让我帮忙用excel画图,老实说我很讨厌用excel画图,点来点去,复杂一些还不能复用,非常繁琐.当然,入门也很简单.需求时不同城市.不同产品的2016和2017销量及环比数据,这应该 ...
- HighCharts中的无主题的2D折线图
HighCharts中的无主题的2D折线图 1.设计源码 <!DOCTYPE html> <html> <head> <meta charset=" ...
- HighCharts中的Ajax请求的2D折线图
HighCharts中的Ajax请求的2D折线图 设计源码: <!DOCTYPE html> <html> <head> <meta charset=&quo ...
- PSP 进度条 柱状图 饼状图
9号 类别 开始时间 结束时间 间隔 净时间 燃尽图 8::00 8:20 0 20分钟 站立会议 8:20 8:50 0 30分钟 读构建之法 9:20 13:20 120分钟 120分钟 四人小组 ...
- AngularJS in Action读书笔记5(实战篇)——在directive中引入D3饼状图显示
前言: "宁肯像种子一样等待 也不愿像疲惫的陀螺 旋转得那样勉强" 这是前几天在查资料无意间看到的一位园友的签名,看完后又读了两遍,觉得很有味道.后来一寻根究底才知这是出资大诗 ...
- JupyterLab绘制:柱状图,饼状图,直方图,散点图,折线图
JupyterLab绘图 喜欢python的同学,可以到 https://v3u.cn/(刘悦的技术博客) 里面去看看,爬虫,数据库,flask,Django,机器学习,前端知识点,JavaScrip ...
- 使用WinForm Chart控件 制作饼装,柱状,折线图
http://blog.csdn.net/dream2050csdn/article/details/53510340 chart控件的属性很多,主要用到Chart控件图表区域的属性有五个属性 1.A ...
随机推荐
- How to Be Good at Mathematics
How to Be Good at Mathematics Community Q&A Sometimes, the hardest subject for some people is ma ...
- idea 搭建java项目
IntelliJ IDEA 12.0搭建Maven Web SSH2架构项目示例 以IDEA为环境,搭建SSH架构示例程序,用Maven管理依赖.这篇文章是一个示例,你需要首先搭建好M ...
- cocos2d-x 图形绘制
转自:http://blog.csdn.net/zhy_cheng/article/details/8480048 图形绘制的话,在cocos2d-x自带的TestCpp里有,包括绘制点,直线,多边形 ...
- Codeforces Round #327 (Div. 2) A. Wizards' Duel 水题
A. Wizards' Duel Time Limit: 20 Sec Memory Limit: 256 MB 题目连接 http://codeforces.com/contest/591/prob ...
- Android之使用AchartEngineActivity引擎绘制柱状图、曲线图
1.简介 AChartEngine(简称ACE)是Google的一个开源图表库(for Android).它功能强大,支持散点图.折线 .关于里面类的具体使用,请下载响应的文档说明(主页上有). 2. ...
- 解决PowerDesigner 反向工程没有注释(备注)
本文转载自:http://www.cnblogs.com/zhangxb/archive/2012/04/20/2458898.html 1. 列注释 原来代码: {OWNER, TABLE, S, ...
- MySQL 灵异事件一则 -- desc报语法错误
今天有一开发同学找到我,说查询SQL中倒序报错,不明原因,于是奔赴工位现场研究情况. 果然,只要SQL中带有desc 就会报错,而ASC没问题. 哪怕desc放在句首用作explain也会报错. 报错 ...
- UNIX标准化及实现之POSIX标准可选头文件
POSIX标准定义的可选头文件 头文件 说明 <aio.h> 异步I/O <mqueue.h> 消息队列 <pthread.h> 线程 <sched.h> ...
- 简化LINUX的命令输入 简化linux命令
在LINUX中,有很多常用的命令,常用的命令我们可以熟练的记忆,但是对于不经常使用的命令恐怕是需要翻阅手册了,但是我们可以简化这些命令的输入来达到简便记忆的效果. 这里以BSH为例: 编辑/etc/b ...
- 10+ commonly using find command switches with example Unix/Linux
http://crybit.com/find-command-usage-with-example-unixlinux/ find command is one of the best search ...