VS2010调试 --指南 Reference from : http://blog.csdn.net/kingzone_2008/article/details/8133048
1 导言
在软件开发周期中,测试和修正缺陷(defect,defect与bug的区别:Bug是缺陷的一种表现形式,而一个缺陷是可以引起多种Bug的) 的时间远多于写代码的时间。通常,debug是指发现缺陷并改正的过程。修正缺陷紧随debug之后,或者说二者是相关的。如果代码中存在缺陷,我们首先 要识别造成缺陷的根本原因(root cause),这个过程就称作调试(debugging)。找到根本原因后,就可以修正缺陷。
那么如何调试代码呢?Visual Studio提供了很多用于调试的工具。有时调试需要花费大量时间去识别root cause。VS提供了许多辅助调试的便捷的工具。调试器(Debugger)包含错误列表、添加断点、可视化的程序流程、控制执行流程、Data Tips、监视窗口(watch windows)、多线程调试、线程窗口、并行调试概览以及IntelliTrace调试概览。我希望本文能够对调试功能的使用者有所裨益。请注意,本文 使用VS2010。某些功能在旧版本中也是一致的,但是VS2010新增了许多features(Labeling breakpoint, Pinned DataTip, Multithreaded Debugging, Parallel debugging and IntelliTrace)。
2 如何启动调试?
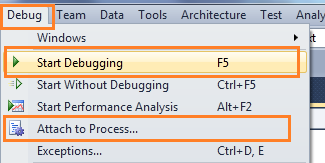
图 启动调试(Start Debugging)
“附加到进程(Attach to Process)”是另一种启动调试的方法。Attach Process会为应用程序启动一个调试会话。可能我们更熟悉ASP.NET Web应用的Attach Process调试。我发了另外两篇相关的帖子。如下:
- Debug Your ASP.NET Application that Hosted on IIS
- Remote IIS Debugging: Debug your ASP.NET Application which is hosted on "Remote IIS Server"
通常我们通过在可能存在问题代码处加断点来启动调试。因此,我们从断点开始讲起。
3 断点(Breakpoints)
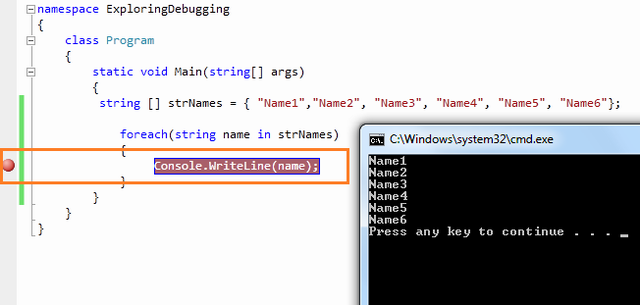
图 设置断点(Set Breakpoint)
3.1 使用断点进行调试
在中断模式下,你有多条可使用的命令,使用相应命令进行进一步的调试。

图 断点工具条(Breakpoint Toolbar)
3.1.1 逐过程(Step Over)
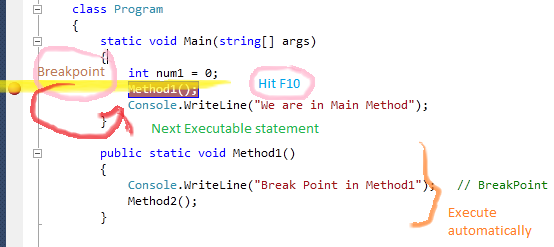
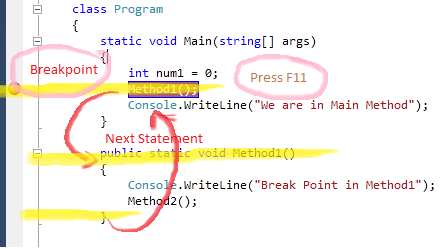
3.1.2 逐语句(Step Into)
3.1.3 跳出(Step Out)
3.1.4 继续(Continue)
3.1.5 设置下一语句(Set Next Statement)
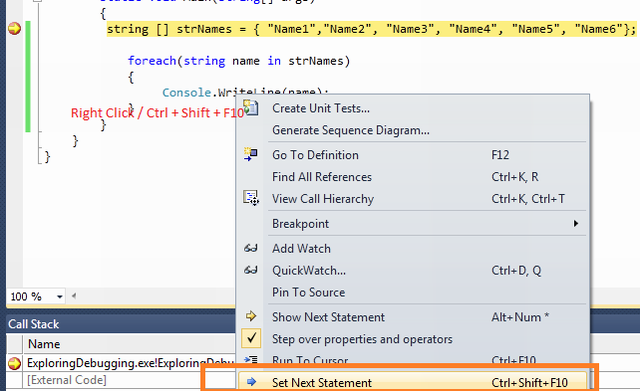
3.1.6 显示下一语句(Show Next Statement [Ctrl+*])
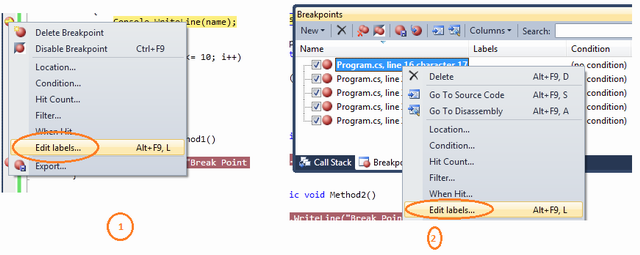
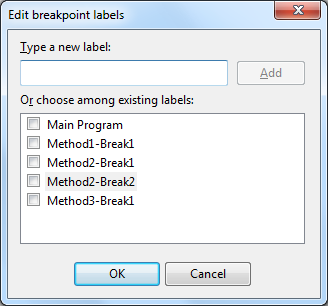
3.2 断点标签(Labeling in Break Point)
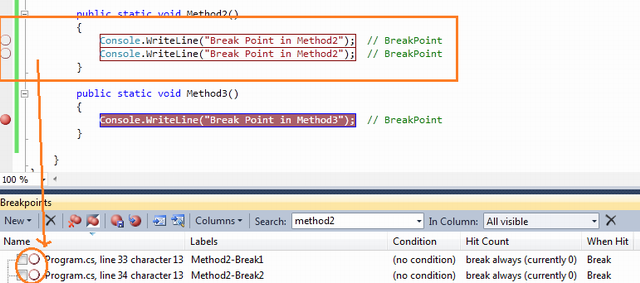
加了与某一功能相关的不同类型的断点,我们可以根据需要使能(enable)、取消(disable)、过滤(filter)这些断点。例如,假设我们要
调试一下代码块。
- class Program
- {
- static void Main(string[] args)
- {
- string[] strNames = { "Name1", "Name2", "Name3", "Name4", "Name5", "Name6" };
- foreach (string name in strNames)
- {
- Console.WriteLine(name); // BreakPoint
- }
- int temp = 4;
- for (int i = 1; i <= 10; i++)
- {
- if (i > 6)
- temp = 5;
- }
- }
- public static void Method1()
- {
- Console.WriteLine("Break Point in Method1"); // BreakPoint
- }
- public static void Method2()
- {
- Console.WriteLine("Break Point in Method2"); // BreakPoint
- Console.WriteLine("Break Point in Method2"); // BreakPoint
- }
- public static void Method3()
- {
- Console.WriteLine("Break Point in Method3"); // Breakpoint
- }
- }
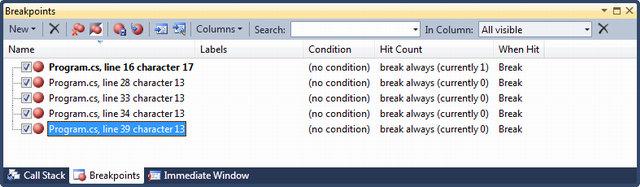
执行程序将停在第一个断点处。下图给出了断点列表。
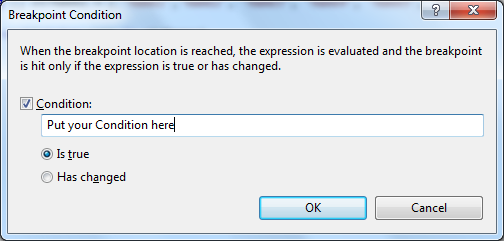
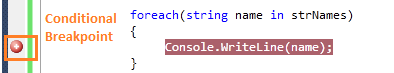
3.3 条件断点(Conditional Breakpoint)
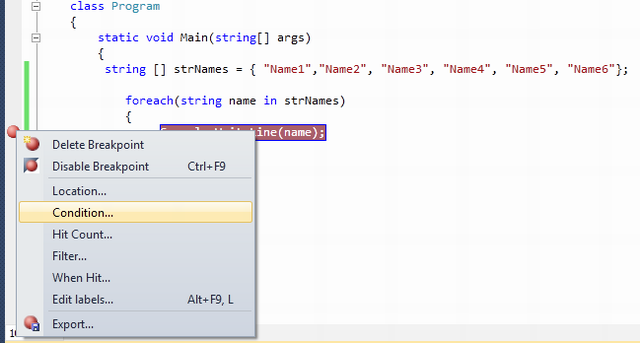
- class Program
- {
- static void Main(string[] args)
- {
- string [] strNames = { "Name1","Name2", "Name3", "Name4", "Name5", "Name6"};
- foreach(string name in strNames)
- {
- Console.WriteLine(name); // Breakpoint is here
- }
- }
- }
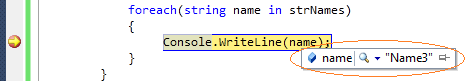
你在Console.WriteLine()语句处设置了断点。当执行程序时,每次for-each循环都会停住。如果你想让代码只在name="Name3"时停住,该怎么办呢?非常简单,你只需使用条件name.Equals("Name3")。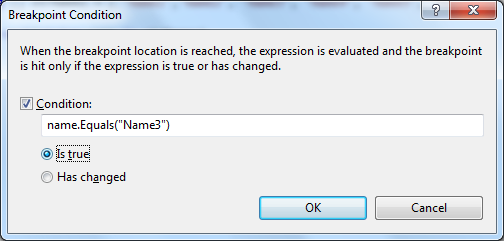
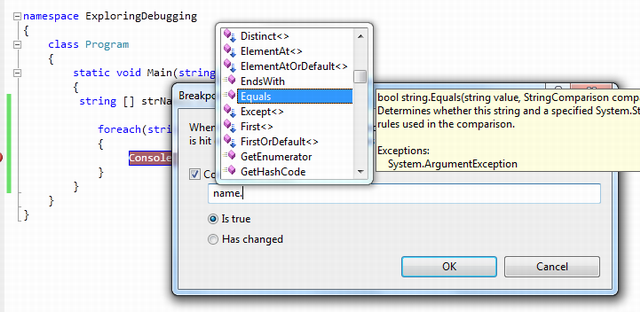
- Is True
- Has Changed
3.4 导入/导出断点(Import / Export Breakpoint)
3.5 断点命中计数(Breakpoint Hit Count)
3.6 Breakpoint When Hit
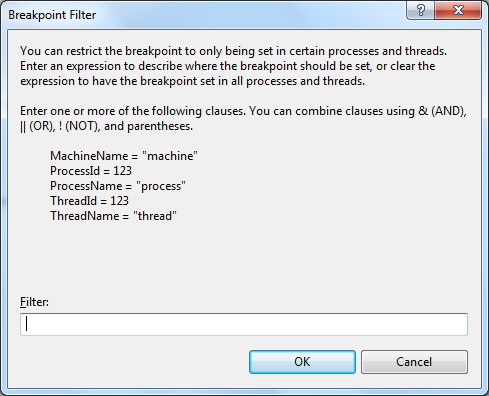
3.7 断点筛选器(Breakpoint Filter)
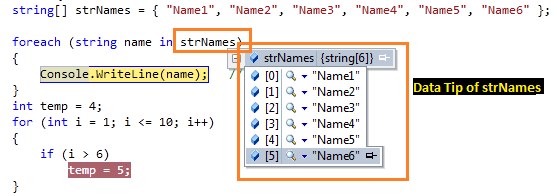
4 数据便签(Data Tip)
值。你甚至可以看到一些复杂对象(如dataset,datatable等等)的细节。数据便签左上角有一个“+”号用于展开它的子对象或者值。
4.1 Pin Inspect Value During Debugging
4.2 Drag-Drop Pin Data Tip
4.3 Adding Comments
4.4 Last Session Debugging Value
4.5 Import Export Data Tips
4.6 Change Value Using Data Tips
4.7 Clear Data Tips
5 监视窗口(Watch Windows)
5.1 局部变量(Locals)
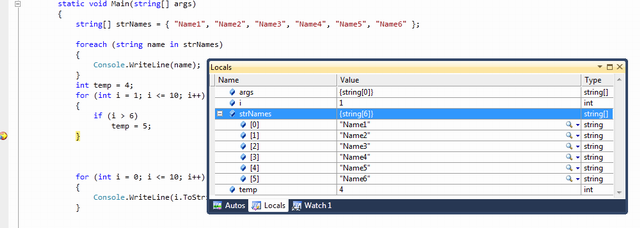
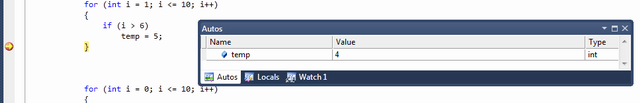
5.2 自动窗口(Autos)
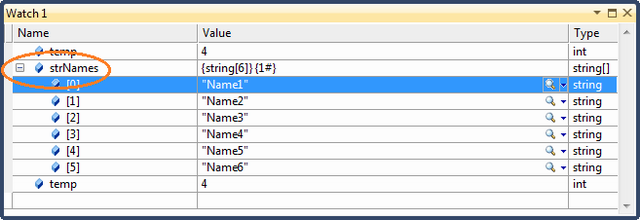
5.3 监视(Watch)
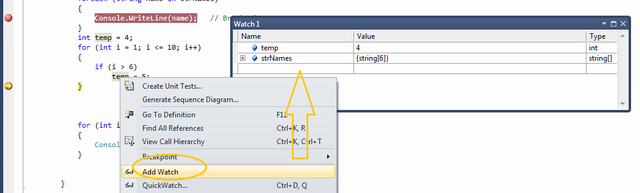
有4个可同时使用的监视窗口。
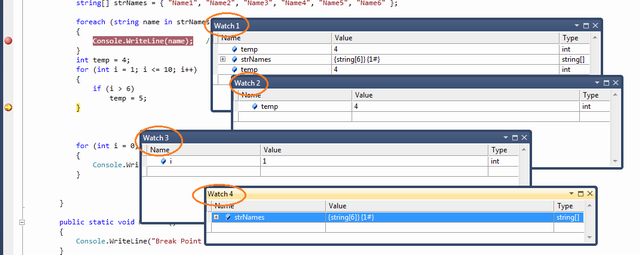
图:多个监视窗口
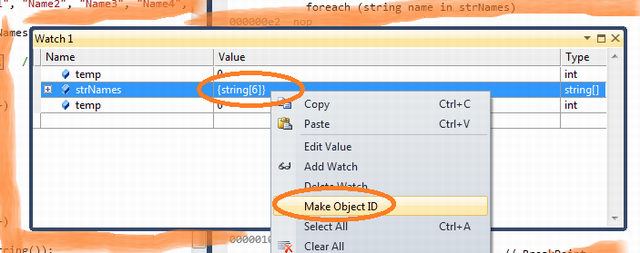
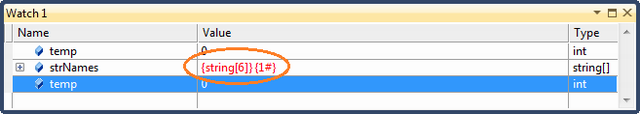
5.3.1 Creating Object ID
ID)。这可以用于在任何时间监控任意对象,甚至是该对象位于范围(scope)之外。在监视窗口(watch
window)右击特定对象变量,再单击“Make Object ID”即可创建Object ID。
5.4
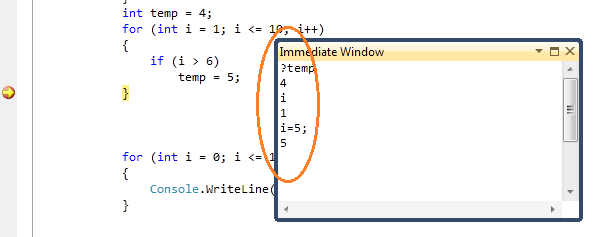
6 即时窗口(Immediate Window)
7 调用堆栈(Call Stack)
8 调试多线程程序(Debugging Multithreaded Program)
8.1 Exploring Threads Window
8.2 Flag Just My Code
8.3 Break Point Filter - Multithread Debugging
9 调试并行程序(Debugging Parallel Program)
9.1 Parallel Task and Parallel Stacks
10 Debugging with IntelliTrace
10.1 Overview
10.2 Mapping with IntelliTrace
10.3 Filter IntelliTrace Data
11 调试常用快捷键(Useful Shortcut Keys For VS Debugging)
| Shortcut Keys | Descriptions |
| Ctrl-Alt-V, A | Displays the Auto window |
| Ctrl-Alt-B | Displays the Breakpoints dialog |
| Ctrl-Alt-C | Displays the Call Stack |
| Ctrl-Shift-F9 | Clears all of the breakpoints in the project |
| Ctrl-F9 | Enables or disables the breakpoint on the current line of code |
| Ctrl-Alt-E | Displays the Exceptions dialog |
| Ctrl-Alt-I | Displays the Immediate window |
| Ctrl-Alt-V, L | Displays the Locals window |
| Ctrl-Alt-Q | Displays the Quick Watch dialog |
| Ctrl-Shift-F5 | Terminates the current debugging session, rebuilds if necessary, and starts a new debugging session. |
| Ctrl-F10 | Starts or resumes execution of your code and then halts execution when it reaches the selected statement. |
| Ctrl-Shift-F10 | Sets the execution point to the line of code you choose |
| Alt-NUM * | Highlights the next statement |
| F5 | If not currently debugging, this runs the startup project or projects and attaches the debugger. |
| Ctrl-F5 | Runs the code without invoking the debugger |
| F11 | Step Into |
| Shift-F11 | Executes the remaining lines out from procedure |
| F10 | Executes the next line of code but does not step into any function calls |
| Shift-F5 | Available in break and run modes, this terminates the debugging session |
| Ctrl-Alt-H | Displays the Threads window to view all of the threads for the current process |
| F9 | Sets or removes a breakpoint at the current line |
| Ctrl-Alt-W, 1 | Displays the Watch 1 window to view the values of variables or watch expressions |
| Ctrl-Alt-P | Displays the Processes dialog, which allows you to attach or detach the debugger to one or more running processes |
| Ctrl-D,V | IntelliTrace Event |
到此本文结束。希望你喜欢本文。请分享你的反馈和建议。
12 深入学习(Further Study)
13 总结(Summary)
讲了基础部分。在深入学习小节中,深入讲解了并行调试过程。如果你感兴趣,请阅读。我的主要目的是涵盖Visual
Studio中提供的几乎所有调试工具。希望你从本文中学到了一些新知识。
“自动窗口”(Autos):当前使用的变量
“局部窗口”(Locals):在范围内的所有变量
“监视N”(Watch):可定制(N从1到4)
Step Into(逐语句):执行并移动到下一条语句(实际上,跳入上一条语句的代码块,此代码块的第一条)
Step Over(逐过程):执行并跳到下一条语句,但不进入上一条语句的代码块
Step Out(跳出):执行到代码块结尾
命令窗口(Command)
即时窗口(Immediate):主要用于计算表达式
参考资料:
[1] Mastering Debugging in Visual Studio 2010 - A Beginner's Guide
[2] bug和缺陷的区别
VS2010调试 --指南 Reference from : http://blog.csdn.net/kingzone_2008/article/details/8133048的更多相关文章
- pycharm的断点调试【转自https://blog.csdn.net/weixin_39198406/article/details/78873120】
1. show execution point (F10)显示目前项目所有断点2. step over (F8)下一步但仅限于设置断点的文件3. step into (F7)执行下一行4. step ...
- Windows下QT4.8.4编译环境的搭建(转载http://blog.csdn.net/bestgonghuibin/article/details/38933141)
开始使用QT了,所以第一步就是把环境搭起来,这里小记一下,以免以后忘记. 1. 下载安装文件 要使用QT功能,那么必须要下载QT的源码,还必须要一个是用QT的编译环境,可以是VS2010,也可以是专用 ...
- Win32消息循环机制等【转载】http://blog.csdn.net/u013777351/article/details/49522219
Dos的过程驱动与Windows的事件驱动 在讲本程序的消息循环之前,我想先谈一下Dos与Windows驱动机制的区别: DOS程序主要使用顺序的,过程驱动的程序设计方法.顺序的,过程驱动的程序有一个 ...
- PL/SQL常用设置 可看引用位置更清晰直观 引自:http://blog.csdn.net/xiaoqforever/article/details/27695569
引自:http://blog.csdn.net/xiaoqforever/article/details/27695569 1,登录后默认自动选中My Objects 默认情况下,PLSQL Deve ...
- http://blog.csdn.net/luoshengyang/article/details/6651971
文章转载至CSDN社区罗升阳的安卓之旅,原文地址:http://blog.csdn.net/luoshengyang/article/details/6651971 在Android系统中,提供了独特 ...
- 学习mongoDB的一些感受(转自:http://blog.csdn.net/liusong0605/article/details/11581019)
曾经使用过mongoDB来保存文件,最一开始,只是想总结一下在开发中如何实现文件与mongoDB之间的交互.在此之前,并没有系统的了解过mongoDB,虽然知道我们用它来存储文件这些非结构化数据,但是 ...
- IntelliJ Idea 常用快捷键列表 (需整理下) https://blog.csdn.net/dc_726/article/details/42784275
[常规] https://blog.csdn.net/dc_726/article/details/42784275https://jingyan.baidu.com/article/59a015e3 ...
- git创建使用1https://blog.csdn.net/Hanani_Jia/article/details/77950594
这篇文章是我自己写的关于GitHub的内容,从我刚听到这个直到设置成功每一步都有详细的步骤来解释,其中有一些截图或者代码来自于网上. 首先,我先对GitHub来一个简单的介绍,GitHub有一个很强大 ...
- 软件测试之BUG分析定位概述(QA如何分析定位BUG)【转自 https://blog.csdn.net/kaka1121/article/details/51538979】
你是否遇到这样的场景? QA发现问题后找到DEV说: 不好了,你的程序出问题了! DEV(追查半小时之后): 唉,是你们测试环境配置的问题 唉,是你们数据不一致 唉,是你们**程序版本不对 唉,是** ...
随机推荐
- html5 的<audio> 音频 audio的“坑”
<audio>标签是html5的一个非常有意义的特性.告别的flash的时代.它的属性有: autoplay:音频就绪后马上播放 controls:出现该属性,向用户显示播放的控件. lo ...
- 用AJAX自定义日历
需求分析 在一些购物网站中,都会有促销活动,这些活动都在日历上标注出来,如何通过Ajax让日历 通过读取数据库中的信息,正确的把促销活动标注在日历上,本文通过自定义日历来实现这 个问题. 技术难点 日 ...
- 提升PHP性能的21种方法
提升PHP性能的21种方法. 1.用单引号来包含字符串要比双引号来包含字符串更快一些.因为PHP会在双引号包围的字符串中搜寻变量,单引号则不会.2.如果能将类的方法定义成static,就尽量定义成st ...
- 干净的 ef for Oracle appconfg配置
<?xml version="1.0" encoding="utf-8"?> <configuration> <configSec ...
- Import和SQL*Loader这2个工具的异同
问:请讲述Import和SQL*Loader这2个工具的异同? 解答: 相同点:这两个ORACLE工具都是用来将数据导入数据库的. 区别是: IMPORT工具只能处理由另一个ORACLE工具EXPOR ...
- 六、mysql字段类型选择
.char类型字段会自动删除字符串后面所带的空格,而varchar不会 .char比varchar快..... .myisam 建议 char类型,memory char跟varchar一样,都作为c ...
- mysql group by优化
mysql> explain select actor.first_name,actor.last_name,count(*) from sakila.film_actor inner join ...
- 子查询优化成join关联查询时要注意一对多关系
mysql> select * from t where t.id in (select t1.tid from t1); +------+ | id | +------+ | +------+ ...
- 大学生IT博客大赛最技术50强与最生活10强文章
姓名 学校 文章标题 文章地址 刘成伟 井冈山大学 [mystery]-linux黑客之网络嗅探底层原理 http://infohacker.blog.51cto.com/6751239/115511 ...
- 从JAVA多线程理解到集群分布式和网络设计的浅析
对于JAVA多线程的应用非常广泛,现在的系统没有多线程几乎什么也做不了,很多时候我们在何种场合如何应用多线程成为一种首先需要选择的问题,另外关于java多线程的知识也是非常的多,本文中先介绍和说明一些 ...