Microsoft.SQL.Server2012.Performance.Tuning.Cookbook学习笔记(一)
一、Creating a trace or workload
注意点:
In the Trace Properties dialog box, there is a checkbox option in the General tab with the caption Server processes trace data, to specify whether
trace data should be processed on the server. If not checked, trace data is processed at the client side.
When trace data is processed at the client side, it is possible for some events to be missed if the server load is high. If this option is checked, then trace
data is processed on the server and all the events included in trace definition are guaranteed to be captured without miss. However, this guarantee comes
with performance penalty, because processing trace data on server has an impact on the performance of SQL Server, and hence enabling this option is
not recommended on production server.
Also, running SQL Server Profiler on production server itself should be avoided as running SQL Server Profiler is resource consuming. Instead, you should run
SQL Server Profiler from a client computer and connect it to your SQL Server from there.

When large amount of event data is captured, the trace file can grow very quickly and become very large. Enabling the Enable file rollover option can prevent a trace file from becoming very large by limiting a file to the maximum file size specified. When the file size is reached to the maximum file size specified, SQL Server creates a new roll-over file with the same name appended with a suffix of an incremental number for the same trace. Thus, when we have this option enabled and the size of trace data is greater than maximum file, we have multiple trace files for the same trace.
It's best to store the trace file on a separate disk other than the one which is used to store data files and log files of SQL server databases. Storing the trace file on the same physical disk where database files are stored can degrade the performance of normal I/O operations of other databases.
提示
Configuring a trace by enabling the Save to table checkbox in the Trace Properties dialog box and saving trace data directly to trace table is less
efficient. If you want your trace data to be saved in a trace table then consider saving the trace data first in a trace file; then export your trace data from
trace file to trace table by opening the trace file in SQL Server Profiler and selecting the Save As command from the File menu with the Trace Table…
option. When you want to save your trace in a trace table, always consider to save your trace in a separate database.
SQL Profiler
SQL Server Profiler is a graphical user interface tool for working with SQL Trace. Behind the scene, it uses the same SQL Trace engine, but additionally provides graphical user interface to the user for working with traces. SQL Server Profiler provides functionalities, such as displaying collected event data on its graphical interface, saving traces either in a file or in an SQL Server table, opening previously saved traces, extracting T-SQL statements from a trace,and many more. Finding and analyzing long running or costly queries, finding deadlocks and their related information, looking for which indexes are scanned, and looking for database connection requests are some of the practical applications of SQL Server Profiler.
To get list of all available event classes, you can query sys.trace_events catalog view.You can join sys.trace_events and sys.trace_categories
catalog views on category_id column to make correlation between the two views.
select e.trace_event_id, c.name from  sys.trace_events e

join sys.trace_categories c on e.category_id = c.category_id
Commonly-used event classes
The following list gives brief descriptions of commonly used event classes:
- Audit Login: This event occurs when a user connects and logs in to SQL Server
- Audit Logout: This event occurs when a users disconnects and logs out from
- SQL Server
- RPC:Starting: This event occurs when a Remote Procedure Call (RPC) starts executing
- RPC:Completed: This event occurs when a Remote Procedure Call (RPC) completes its execution
- SQL:BatchStarting: This event occurs when a T-SQL batch starts executing
- SQL:StmtStarting: This event occurs when a statement inside a T-SQL batch starts executing
- SQL:StmtCompleted: This event occurs when a statement inside a T-SQL batch completes its execution
- SQL:BatchCompleted: This event occurs when a T-SQL batch completesits execution
- SP:Starting: This event occurs when a stored procedure starts executing
- SP:StmtStarting: This event occurs when a statement inside a stored procedure starts executing
- SP:StmtCompleted: This event occurs when a statement inside a stored procedure completes its execution
- SP:Completed: This event occurs when a stored procedure completes its execution
Commonly-used data columns
The following list gives brief descriptions of commonly used event classes:
- ApplicationName: This data column represents the name of the client application causing a trace event to occur
- DatabaseID: This data column represents the internal system assigned ID of the database for which a trace event occurs
- DatabaseName: This data column represents the name of the database for which a trace event occurs
- HostName: This data column represents the name of the host or computer where the client component connecting to SQL Server causes a trace event to occur
- LoginName: This data column represents the name of the login under whose security context, particular T-SQL statement(s) executes that causes trace event to occur
- ObjectID: This data column represents the internal system assigned ID of an object for which a trace event occurs
- ObjectName: This data column represents the name of an object for which a trace event occurs
- SessionLoginName: This data column represents the name of the login who initiated the connection and under whose security context a trace event occurs
- SPID: This data column represents the Server Process ID or Session ID of the connection which causes a trace event to occur
Filter example:
Because two SQL Server logins named James and Peter with permissions on AdventureWorks2012 database are required, create them by performing the following steps:
1. Open SQL Server Management Studio.
2. Connect to the instance of SQL Server with login account having sysadmin rights.
3. Execute the following T-SQL script to create the logins and their corresponding users
in the AdventureWorks2012 database for James and Peter:

--Creating Login and User in

--AdventureWorks2012 database for James

USE [master]

GO

CREATE LOGIN [James] WITH PASSWORD=N'JamesPass123'

,DEFAULT_DATABASE=[AdventureWorks2012]

,CHECK_EXPIRATION=OFF

,CHECK_POLICY=OFF

GO

USE [AdventureWorks2012]

GO

CREATE USER [James] FOR LOGIN [James]

GO

ALTER ROLE [db_owner] ADD MEMBER [James]

GO

--Creating Login and User in AdventureWorks2012 database for Peter

USE [master]

GO

CREATE LOGIN [Peter] WITH PASSWORD=N'PeterPass123'

,DEFAULT_DATABASE=[AdventureWorks2012]

,CHECK_EXPIRATION=OFF

,CHECK_POLICY=OFF

GO

USE [AdventureWorks2012]

GO

CREATE USER [Peter] FOR LOGIN [Peter]

GO

ALTER ROLE [db_owner] ADD MEMBER [Peter]

GO
Now, we will create a trace and capture only events that occur for AdventureWorks2012 database from James' session only. To do this, follow these steps:
1. Start SQL Server Profiler.
2. Select New Trace… from the File menu. In the Connect to Server dialog box, provide connection details of SQL Server hosting the AdventureWorks2012 database and click on Connect.
3. In the General tab of Trace Properties, enter FilteringEvents as the Trace name and select Blank template for the Use the template: drop-down menu as shown
in following:

4. In Events Selection tab, check the checkbox for event class SQL:BatchCompleted under the TSQL event category as shown in following screenshot:

5. Click on Column Filters… button.
6. In the Edit Filter dialog box, select DatabaseName from the list of available data columns on the left. Expand the Like option and enter string value
AdventureWorks2012; then press the OK button as shown in the following screenshot:

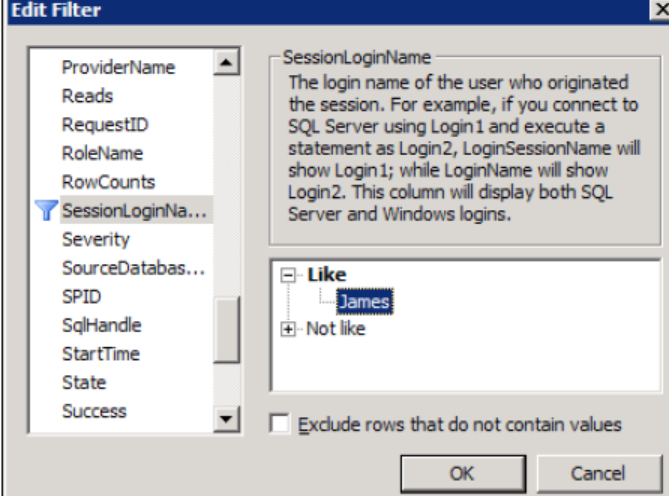
7. In the Edit Filter dialog box, select SessionLoginName from the list of available data columns on the left. Expand the Like option and enter string value James; then press the OK button as shown in following screenshot:
8. Click on the Organize Columns… button in Events Selection tab of Trace Properties dialog box. Select TextData data column and then keep clicking on Up button repeatedly to move the column up the order in the list, until the column appears as the second item, at the top of the list underneath EventClass data column. Do this same exercise also for the data columns DatabaseName and SessionLoginName so that the final order of the data columns should look like as shown in following screenshot. Press OK in the Organize Columns dialog box:

9. Click on the Run button to run the trace in the Trace Properties dialog box.
Now, we will open two instances of SQL Server Management Studio one by one that connect to SQL Server with the logins James and Peter respectively and run a few queries.
1. Open the first instance of SSMS and connect to SQL Server with the login credentials of James. In the query window, type and execute the T-SQL statements as shown in following script:
USE [AdventureWorks2012]

GO

SELECT * FROM [Sales].[Customer]

GO

USE [master]

GO

SELECT * FROM sys.databases

GO
2. Open a second instance of SSMS and connect to SQL Server with the login credentials of Peter. In the query window, type and execute the same T-SQL
queries as shown in previous step.
3. Switch to SQL Server Profiler window that is running the trace. Examine the trace data as shown in following screenshot:

Tips:Use of DatabaseID
We can alternatively use DatabaseID data column instead of DatabaseName to specify a filter on a particular database. For this, we must know system
assigned ID value for a specific database. This value can be retrieved by either calling DB_ID('AdventureWorks2012') metadata function or querying sys.databases catalog view.
The following section lists some of data columns that are commonly used in trace filters:
- ApplicationName: A filter can be specified on this data column so that only trace events raised by a particular client application are captured
- DatabaseID: A filter can be specified on this data column so that only trace eventsraised for a specific database are captured
- DatabaseName: A filter can be specified on this data column so that only trace events raised for a specific database are captured
- HostName: A filter can be specified on this data column so that only trace events raised from a specific host or client machine are captured
- LoginName: A filter can be specified on this data column so that only trace events raised by a specific login are captured
- ObjectID: A filter can be specified on this data column so that only trace events raised for a specific object are captured
- ObjectName: A filter can be specified on this data column so that only trace events raised for a specific object are captured
- SessionLoginName: A filter can be specified on this data column so that only trace events raised by a specific login are captured
- SPID: A filter can be specified on this data column so that only trace events raised from a specific session connection are captured
Microsoft.SQL.Server2012.Performance.Tuning.Cookbook学习笔记(一)的更多相关文章
- Microsoft.SQL.Server2012.Performance.Tuning.Cookbook学习笔记(二)
Creating trace with system stored procedures Following are the stored procedures which you should kn ...
- 《Microsoft Sql server 2008 Internals》读书笔记--第六章Indexes:Internals and Management(1)
<Microsoft Sql server 2008 Internals>索引文件夹: <Microsoft Sql server 2008 Internals>读书笔记--文 ...
- Spark SQL 之 Performance Tuning & Distributed SQL Engine
Spark SQL 之 Performance Tuning & Distributed SQL Engine 转载请注明出处:http://www.cnblogs.com/BYRans/ 缓 ...
- SQL Server2012 T-SQL基础教程--读书笔记(1-4章)
SQL Server2012 T-SQL基础教程--读书笔记(1-4章) SqlServer T-SQL 示例数据库:点我 Chapter 01 T-SQL 查询和编程背景 1.3 创建表和定义数据的 ...
- SQL Server2012 T-SQL基础教程--读书笔记(8 - 10章)
SQL Server2012 T-SQL基础教程--读书笔记(8 - 10章) 示例数据库:点我 CHAPTER 08 数据修改 8.1 插入数据 8.1.1 INSERT VALUES 语句 8.1 ...
- SQL Server2012 T-SQL基础教程--读书笔记(5-7章)
SQL Server2012 T-SQL基础教程--读书笔记(5-7章) SqlServer T-SQL 示例数据库:点我 Chapter 05 表表达式 5.1 派生表 5.1.1 分配列别名 5. ...
- SQL必知必会学习笔记
2.5 select SELECT 要返回的列或表达式 是FROM 从中检索数据的表 仅在从表选择数据时使用WHERE 行级过滤 ...
- Inside Microsoft SQL Server 2008: T-SQL Querying 读书笔记之查询优化
一. 自顶向下优化方法论 1. 分析实例级别的等待 在实例级找出什么类型的等待占用大部分的时间,通过sys.dm_os_wait_stats select wait_type, --等待类型 wait ...
- sql分类及基本sql操作,校对规则(mysql学习笔记二)
sql针对操作对象分为不同语言 数据操作(管理)语言 DML或者将其细分为 ( 查询 DQL 管理(增,删,改) DML) 数据定义语言(对保存数据的格式进行定义) DDL 数据库控制语言(针对数 ...
随机推荐
- pycharm解决无法调用同文件夹下的文件
一.将所有的文件放在project这个根目录下面 二.添加一个空的__init__.py 文件 三.选中project根目录,点击右键选择make_directory as-->sources ...
- Angular js 具体应用(一)
1,首先引用Angular 百度静态资源库搜索Angular 复制链接,在HTML中嵌入script 最好写在正文下面 <script type="text/javascript& ...
- Flask – SQLite:增加成员
目录 简介 结构 展示 技术 运行 代码 创建数据库表单 views视图 models模块 home主页 list列表页 result消息结果页 studentst添加成员 简介 结构 $ tree ...
- 传统保险企业基于 Dubbo 的微服务实践
本文整理自中国人寿保险(海外)股份有限公司深圳中心技术总监家黄晓彬在 Dubbo 社区开发者日深圳站的现场分享. 中国人寿保险(海外)股份有限公司负责香港.澳门.新加坡和印尼的业务开发,和国内业务不同 ...
- LUGOU P3907 圈的异或
传送门 解题思路 其实就是找出所有的环判断,因为数据范围很小直接暴力做,注意要判断自环. 代码 #include<iostream> #include<cstdio> #inc ...
- 交互题(apio2016Gap)
题目链接 //Serene #include<algorithm> #include<iostream> #include<cstring> #include& ...
- Wndows下Apache+php+Mysql环境的搭建及其涉及的知识
一.安装Apache 1. 在网上搜索以下3个文件,以及找一个地方新建一个文件夹 好吧,这里有下载链接:http://pan.baidu.com/s/1hr9IdSS 文件夹内有:apache,mys ...
- 书写更加高效的CSS,走出误区
根据一些CSS写作经验,如何提高渲染效率及所占用消耗的资源,我们来浅谈一下CSS的渲染效率,书写高效的CSS. 1.十六进制的颜色值对位数与大小写 编写十六进制颜色值时你可能会用小写字母或省略成3位数 ...
- SDUT-3403_数据结构实验之排序六:希尔排序
数据结构实验之排序六:希尔排序 Time Limit: 1000 ms Memory Limit: 65536 KiB Problem Description 我们已经学习了各种排序方法,知道在不同的 ...
- 如何用maven tycho构建自己的Eclipse RCP应用
在你写了一个Eclipse插件之后,也许你就会想如何把它变成一个P2的项目或者是一个Java App让大家可以安装到自己的Eclipse上,dangdangdang~~ 这是你就可以利用maven-t ...