pyecharts数据分析及展示
仅仅从网上爬下数据当然是不够用的,主要还得对数据进行分析与展示,大部分人都看重薪资,但是薪资数据有的是*k/月,有的是*万/月,还有*万/年等等,就要对数据进行清理
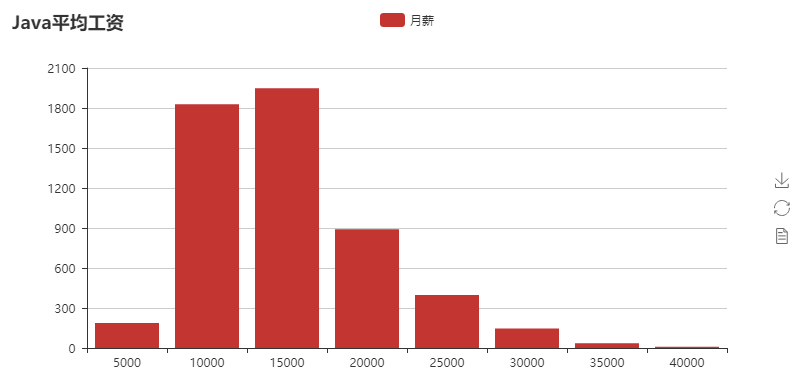
将所有单位统一化,全部换算成统一单位,然后分类薪资范围,在计算各个范围的数量,最后绘图展示
import pymysql

import numpy as np

from pyecharts import Bar

from pyecharts import Pie

class Mysqlhelper(object):

    config = {

        "host": "localhost",

        "user": "root",

        "password": "",

        "db": "test",

        "charset": "utf8"

    }

    def __init__(self):

        self.connection = None

        self.cursor = None

    # 从数据库中查询多行数据

    def getlist(self, sql, *args):

        try:

            self.connection = pymysql.connect(**Mysqlhelper.config)  # **接函数所有参数

            self.cursor = self.connection.cursor()

            self.cursor.execute(sql, args)

            return self.cursor.fetchall()

        except Exception as ex:

            print(ex, ex)

        finally:

            self.close()

    def close(self):

        if self.cursor:

            self.cursor.close()

        if self.connection:

            self.connection.close()

if __name__ == "__main__":

    count=0

    list = []

    list1 = []

    list2 = [5000,10000,15000,20000,25000,30000,35000,40000]

    salary0 = []

    salary1 = []

    salary2 = []

    salary3 = []

    salary4 = []

    salary5 = []

    salary6 = []

    salary7 = []

    city=[]

    helper = Mysqlhelper()

    rows = helper.getlist("select * from t_job")

    #print(rows)

    for n in rows:

        if n[4][-1]=='月':

            list.append(n[4])

        elif n[4][-1]=='年':

            pass

        elif n[4][-1]=='天':

            pass

        else:

            pass

    for sale in list:

        #print(sale)

        money = sale.split('/')

        #print(money[0])

        money1 = money[0].split('-')

        #print(money1)

        if money[0][-1] == '万':

            a = float(money1[0]) * 10000

            b = float(money1[1][:-1]) * 10000

            aveage = (a + b) / 2

            count+=1

            list1.append(aveage)

        elif money[0][-1]=='千':

            a = float(money1[0]) * 1000

            b = float(money1[1][:-1]) * 1000

            #print(a)

            #print(b)

            aveage = (a + b) / 2

            #print(aveage)

            count += 1

            list1.append(aveage)

    #print(count)

    #print(list1)

    for i in list1:

        print(i)

        if 0 < i <= 5000:

            salary0.append(i)

        elif 5000 < i <= 10000:

            salary1.append(i)

        elif 10000 < i <= 15000:

            salary2.append(i)

        elif 15000 < i <= 20000:

            salary3.append(i)

        elif 20000 < i <= 25000:

            salary4.append(i)

        elif 25000 < i <= 30000:

            salary5.append(i)

        elif 30000 < i <= 35000:

            salary6.append(i)

        elif 35000 < i <= 40000:

            salary7.append(i)

    print(min(list1))

    print(max(list1))

    a = len(salary0)

    b = len(salary1)

    c = len(salary2)

    d = len(salary3)

    e = len(salary4)

    f = len(salary5)

    g = len(salary6)

    h = len(salary7)

    list3=[a,b,c,d,e,f,g,h]

    print(list2)   #x轴

    print(a,b,c,d,e,f,g,h)

    print(list3)   #数量

    bar = Bar('Python平均工资')

    bar.add("月薪", list2,list3)

    # bar.show_config()

    bar.render('Python工资柱状图.html')

    pie = Pie()

    pie.add("", list2, list3, is_label_show=True)

    #pie.show_config()

    pie.render('Python工资饼状图.html')

    '''

    #print(rows)

    citycount=[]

    cityname=['北京','异地招聘','海淀区','朝阳区','丰台区','昌平区','东城区','延庆区',

              '房山区','通州区','顺义区','大兴区','怀柔区','西城区','平谷区','门头沟区']

    beijing=[]

    yidi=[]

    haidian=[]

    chaoyang=[]

    fengtai=[]

    changping=[]

    dongcheng=[]

    yanqing=[]

    fangshan=[]

    tongzhou=[]

    shunyi=[]

    daxing=[]

    huairou=[]

    xicheng=[]

    pinggu=[]

    mentougou=[]

    for n in rows:

        #print(n[3])

        area=n[3].split('-')

        print(area)

        if len(area)==1:

            print(area[0])

            city.append(area[0])

        else:

            print(area[1])

            city.append(area[1])

    print(city)

    print(len(city))

    for i in city:

        if i=='北京':

            beijing.append(i)

        elif i=='异地招聘':

            yidi.append(i)

        elif i=='海淀区':

            haidian.append(i)

        elif i == '朝阳区':

            chaoyang.append(i)

        elif i=='丰台区':

            fengtai.append(i)

        elif i=='昌平区':

            changping.append(i)

        elif i=='东城区':

            dongcheng.append(i)

        elif i=='延庆区':

            yanqing.append(i)

        elif i=='房山区':

            fangshan.append(i)

        elif i=='通州区':

            tongzhou.append(i)

        elif i=='顺义区':

            shunyi.append(i)

        elif i=='大兴区':

            daxing.append(i)

        elif i=='怀柔区':

            huairou.append(i)

        elif i=='西城区':

            xicheng.append(i)

        elif i=='平谷区':

            pinggu.append(i)

        elif i=='门头沟区':

            mentougou.append(i)

    #print(beijing)

    #print(len(beijing))

    a = len(beijing)

    b = len(yidi)

    c = len(haidian)

    d = len(chaoyang)

    e = len(fengtai)

    f = len(changping)

    g = len(dongcheng)

    h = len(yanqing)

    j = len(fangshan)

    k = len(tongzhou)

    l = len(shunyi)

    m = len(daxing)

    n = len(huairou)

    o = len(xicheng)

    p = len(pinggu)

    q = len(mentougou)

    citycount=[a,b,c,d,e,f,g,h,j,k,l,m,n,o,p,q]

    print(cityname)

    print(citycount)

    pie = Pie()

    pie.add("", cityname, citycount, is_label_show=True)

    # pie.show_config()

    pie.render('北京各区Python职位占比饼状图.html')

    bar = Bar('北京各区职位数量')

    bar.add("数量", cityname, citycount)

    # bar.show_config()

    bar.render('北京各区Python职位占比柱状图.html')

    '''
前面写的是数据库的操作函数,其实可以封装成一个py文件,以后使用直接调用即可。
结果。:
我也分析了boss直聘网站的一些数据,类似于经验要求和学历要求等等,也可以自己分析想要的数据。
import pymysql

import numpy as np

from pyecharts import Bar

from pyecharts import Pie

import jieba

from collections import Counter

from os import  path

class Mysqlhelper(object):

    config={

        "host":"localhost",

        "user":"root",

        "password":"",

        "db":"test",

        "charset":"utf8"

    }

    def __init__(self):

        self.connection=None

        self.cursor=None

    # 从数据库中查询多行数据

    def getlist(self, sql, *args):

        try:

            self.connection = pymysql.connect(**Mysqlhelper.config)  # **接函数所有参数

            self.cursor = self.connection.cursor()

            self.cursor.execute(sql, args)

            return self.cursor.fetchall()

        except Exception as ex:

            print(ex,ex)

        finally:

            self.close()

    def close(self):

        if self.cursor:

            self.cursor.close()

        if self.connection:

            self.connection.close()

if __name__=="__main__":

    sale=[]

    exp=[]

    edu=[]

    one = []

    three = []

    five = []

    onein = []

    noexp = []

    qita=[]

    benke=[]

    dazhuan=[]

    noedu=[]

    boshi=[]

    other=[]

    helper = Mysqlhelper()

    rows = helper.getlist("select * from boss_job")

    #print(rows)

    for data in rows:

        #print(data[2])

        #print(data[5])

        #print(data[6])

        sale.append(data[2])

        exp.append(data[5])

        edu.append(data[6])

        if data[5]=='1-3年':

            one.append(data[5])

        elif data[5]=='3-5年':

            three.append(data[5])

        elif data[5]=='5-10年':

            five.append(data[5])

        elif data[5]=='经验不限':

            noexp.append(data[5])

        elif data[5]=='1年以内':

            onein.append(data[5])

        else:

            qita.append(data[5])

            pass

        if data[6]=='本科':

            benke.append(data[6])

        elif data[6]=='大专':

            dazhuan.append(data[6])

        elif data[6]=='博士':

            boshi.append(data[6])

        elif data[6]=='学历不限':

            noedu.append(data[6])

        else:

            other.append(data[6])

    #     with open('./data/jingyan.txt', 'a', encoding='utf-8') as fp:

    #         fp.write(data[5])

    #         fp.write(',')

    #         fp.flush()

    #         fp.close()

    print(exp)

    print(edu)

    print(len(exp))

    print(len(edu))

    '''

    d = path.dirname(__file__)

    jingyan_text = open(path.join(d, "data//jingyan.txt"), encoding='utf-8').read()

    print(len(jingyan_text))

    jieba.load_userdict("data//jingyan_dict.txt")

    seg_list = jieba.cut_for_search(jingyan_text)

    print(u"[全模式]: ", "/ ".join(seg_list))

    '''

    # sanguo_words = [x for x in jieba.cut(jingyan_text)if x!=','and len(x) >=2]

    # c = Counter(sanguo_words).most_common(20)

    # print(c)

    # print(''.join(jieba.cut(jingyan_text)))

    print(one)

    print(three)

    print(five)

    print(noexp)

    print(onein)

    print(qita)

    a=len(one)

    b=len(three)

    c=len(five)

    d=len(noexp)

    e=len(onein)

    f=len(qita)

    expcount=[f,e,a,b,c,d]

    expfenlei=['应届生','1年以内','1-3年','3-5年','5-10年','经验不限']

    print(expcount)

    print(a+b+c+d+e+f)

    print(other)

    g=len(benke)

    h=len(dazhuan)

    j=len(boshi)

    k=len(noedu)

    m=len(other)

    educount=[h,g,k,j,m]

    edufenlei=['大专','本科','硕士','博士','学历不限']

    print(educount)

    '''

    bar = Bar('工作年限')

    bar.add("要求", expfenlei, expcount)

    # bar.show_config()

    bar.render('工作年限柱状图.html')

    pie = Pie()

    pie.add("工作", expfenlei, expcount, is_label_show=True)

    # pie.show_config()

    pie.render('工作年限饼状图.html')

    '''

    bar = Bar('学历要求')

    bar.add("学历", edufenlei, educount)

    # bar.show_config()

    bar.render('学历要求柱状图.html')

    pie = Pie()

    pie.add("学历", edufenlei, educount, is_label_show=True)

    # pie.show_config()

    pie.render('学历要求饼状图.html')
我使用的是最基本的数组方法,不知道有什么简单方法么,例如jieba分词模块,等等

可以看出本科生需求还是很大的。。。
pyecharts数据分析及展示的更多相关文章
- 数据分析与展示——NumPy库入门
这是我学习北京理工大学嵩天老师的<Python数据分析与展示>课程的笔记.嵩老师的课程重点突出.层次分明,在这里特别感谢嵩老师的精彩讲解. NumPy库入门 数据的维度 维度是一组数据的组 ...
- 【学习笔记】PYTHON数据分析与展示(北理工 嵩天)
0 数据分析之前奏 课程主要内容:常用IDE:本课程主要使用:Anaconda Anaconda:一个集合,包括conda.某版本Python.一批第三方库等 -支持近800个第三方库 -适合科学计算 ...
- python数据分析及展示(一)
一.IDE选择 Anaconda软件:开源免费,https://www.anaconda.com下载,根据系统进行安装.由于下载速度慢,可以去清华大学开源软件镜像站下载. Spyder软件设置:Too ...
- 数据分析与展示---Pandas库数据特征分析
说明:0轴axis=0和1轴axis=1 简介 一:数据的排序 二:数据的基本统计分析 三:数据的累积统计分析 四:数据的相关分析 一:数据的排序 a b c d a b c d 二:数据的基本统计分 ...
- 数据分析与展示---Matplotlib基本绘图函数
一:基本绘图函数(这里介绍16个,还有许多其他的) 二:pyplot饼图plt.pie的绘制 三:pyplot直方图plt.hist的绘制 (一)修改第二个参数bins:代表直方图的个数,均分为多段, ...
- Python数据分析与展示(1)-数据分析之表示(1)-NumPy库入门
Numpy库入门 从一个数据到一组数据 维度:一组数据的组织形式 一维数据:由对等关系的有序或无序数据构成,采用线性方式组织. 可用类型:对应列表.数组和集合 不同点: 列表:数据类型可以不同 数组: ...
- awk - 数据分析和展示
目录 NAME 格式 常用选项 表达式 PATTERN(模式) 流程控制语句 数组 print,printf格式化输出 常用示例 NAME gawk - pattern scanning and pr ...
- 数据分析与展示——Pandas数据特征分析
Pandas数据特征分析 数据的排序 将一组数据通过摘要(有损地提取数据特征的过程)的方式,可以获得基本统计(含排序).分布/累计统计.数据特征(相关性.周期性等).数据挖掘(形成知识). .sort ...
- 数据分析与展示——Matplotlib基础绘图函数示例
Matplotlib库入门 Matplotlib基础绘图函数示例 pyplot基础图表函数概述 函数 说明 plt.plot(x,y,fmt, ...) 绘制一个坐标图 plt.boxplot(dat ...
随机推荐
- spring对数据库的操作、spring中事务管理的介绍与操作
jdbcTemplate的入门 创建maven工程 此处省略 导入依赖 <!-- https://mvnrepository.com/artifact/org.springframework/s ...
- Laravel SMS 短信发送包
Laravel Sms Laravel 贴合实际需求同时满足多种通道的短信发送组件 我们基于业务需求在 overtrue/easy-sms 基础进行扩展开发,主要实现如下目标: 支持短信验证码直接在 ...
- Selenium2学习(四)-- xpath定位
前言 在上一篇简单的介绍了用工具查看目标元素的xpath地址,工具查看比较死板,不够灵活,有时候直接复制粘贴会定位不到.这个时候就需要自己手动的去写xpath了,这一篇详细讲解xpath的一些语法. ...
- JS支持可变参数(任意多个)
<script type="text/javascript"> function abc(){ //js中有个变量arguments,可以访问所有传入的值 for(va ...
- 插上翅膀,让Excel飞起来——xlwings(四)
前言 当年看<别怕,Excel VBA其实很简单>相见恨晚,看了第一版电子版之后,买了纸质版,然后将其送人.而后,发现出了第二版,买之收藏.之后,发现Python这一编程语言,简直是逆天, ...
- scrum 第二次冲刺
scrum 第二次冲刺 1.本周工作 本周正式开始了开发工作.首先设计了类图,建好了数据库,将整个小组的分工传到了禅道上,我主要负责后台的挂号操作. 本周分工如下: 首先搭建好了ssm框架,其中遇到了 ...
- python+pymssql+selenium 获取短信验证码登录(实战练习)
登录页面输入手机号, 获取短信验证码(验证码有10分钟有效期) 1 连接sql server数据库,获取10分钟之内的有效短信验证码 2 页面输入手机号,并获取验证码.若存在有效验证码则输入验证码,若 ...
- Windos下Android(ADT Bundle)配置NDK的两种方法------ADT、Cygwin、NDK配置汇总(转)
转自:http://blog.csdn.net/yanzi1225627/article/details/16897877 Android开发环境由windows下ADT Bundle搭建,且按前文h ...
- js、Jquery处理自动计算的输入框事件
js在处理的时候可以使用oninput去获取当前输入框输入的值, jquery的时候使用了keypress和keydown但是发现都不能在输入后触发事件去获取输入框的值,这时候需要使用 ‘input ...
- public class Promise<T>: Thenable, CatchMixin
public class Promise<T>: Thenable, CatchMixin