
How Garbage Collection Really Works
Java Memory Management, with its built-in garbage collection, is one of the language's finest achievements. It allows developers to create new objects without worrying explicitly about memory allocation and deallocation, because the garbage collector automatically reclaims memory for reuse. This enables faster development with less boilerplate code, while eliminating memory leaks and other memory-related problems. At least in theory.
Ironically, Java garbage collection seems to work too well, creating and removing too many objects. Most memory-management issues are solved, but often at the cost of creating serious performance problems. Making garbage collection adaptable to all kinds of situations has led to a complex and hard-to-optimize system. In order to wrap your head around garbage collection, you need first to understand how memory management works in a Java Virtual Machine (JVM).
How Garbage Collection Really Works
Many people think garbage collection collects and discards dead objects. In reality, Java garbage collection is doing the opposite! Live objects are tracked and everything else designated garbage. As you'll see, this fundamental misunderstanding can lead to many performance problems.
Let's start with the heap, which is the area of memory used for dynamic allocation. In most configurations the operating system allocates the heap in advance to be managed by the JVM while the program is running. This has a couple of important ramifications:
- Object creation is faster because global synchronization with the operating system is not needed for every single object. An allocation simply claims some portion of a memory array and moves the offset pointer forward (see Figure 2.1). The next allocation starts at this offset and claims the next portion of the array.
- When an object is no longer used, the garbage collector reclaims the underlying memory and reuses it for future object allocation. This means there is no explicit deletion and no memory is given back to the operating system.
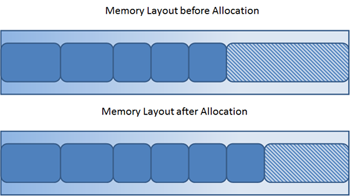 Figure 2.1: New objects are simply allocated at the end of the used heap.
All objects are allocated on the heap area managed by the JVM. Every item that the developer uses is treated this way, including class objects, static variables, and even the code itself. As long as an object is being referenced, the JVM considers it alive. Once an object is no longer referenced and therefore is not reachable by the application code, the garbage collector removes it and reclaims the unused memory. As simple as this sounds, it raises a question: what is the first reference in the tree?
Garbage-Collection Roots — The Source of All Object Trees
Every object tree must have one or more root objects. As long as the application can reach those roots, the whole tree is reachable. But when are those root objects considered reachable? Special objects called garbage-collection roots (GC roots; see Figure 2.2) are always reachable and so is any object that has a garbage-collection root at its own root.
There are four kinds of GC roots in Java:
- Local variables are kept alive by the stack of a thread. This is not a real object virtual reference and thus is not visible. For all intents and purposes, local variables are GC roots.
- Active Java threads are always considered live objects and are therefore GC roots. This is especially important for thread local variables.
- Static variables are referenced by their classes. This fact makes them de facto GC roots. Classes themselves can be garbage-collected, which would remove all referenced static variables. This is of special importance when we use application servers, OSGi containers or class loaders in general. We will discuss the related problems in the Problem Patterns section.
- JNI References are Java objects that the native code has created as part of a JNI call. Objects thus created are treated specially because the JVM does not know if it is being referenced by the native code or not. Such objects represent a very special form of GC root, which we will examine in more detail in the Problem Patterns section below.
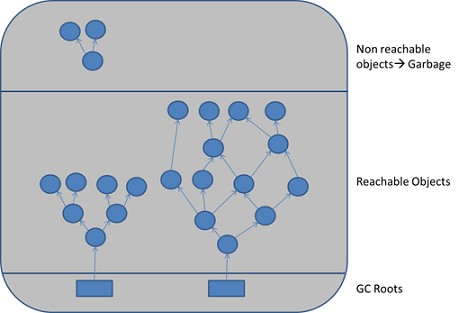 Figure 2.2: GC roots are objects that are themselves referenced by the JVM and thus keep every other object from being garbage-collected.
Therefore, a simple Java application has the following GC roots:
- Local variables in the main method
- The main thread
- Static variables of the main class
Marking and Sweeping Away Garbage
To determine which objects are no longer in use, the JVM intermittently runs what is very aptly called a mark-and-sweep algorithm . As you might intuit, it's a straightforward, two-step process:
- The algorithm traverses all object references, starting with the GC roots, and marks every object found as alive.
- All of the heap memory that is not occupied by marked objects is reclaimed. It is simply marked as free, essentially swept free of unused objects.
Garbage collection is intended to remove the cause for classic memory leaks: unreachable-but-not-deleted objects in memory. However, this works only for memory leaks in the original sense. It's possible to have unused objects that are still reachable by an application because the developer simply forgot to dereference them. Such objects cannot be garbage-collected. Even worse, such a logical memory leak cannot be detected by any software (see Figure 2.3). Even the best analysis software can only highlight suspicious objects. We will examine memory leak analysis in the Analyzing the Performance Impact of Memory Utilization and Garbage Collection section, below.
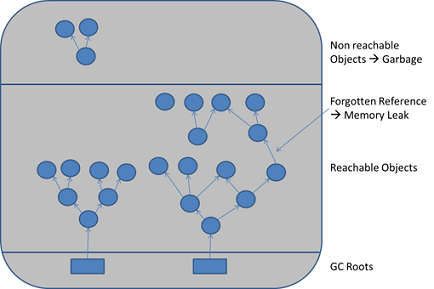 Figure 2.3: When objects are no longer referenced directly or indirectly by a GC root, they will be removed. There are no classic memory leaks. Analysis cannot really identify memory leaks; it can only point out suspicious objects.
Java Memory Management, with its built-in garbage collection, is one of the language's finest achievements. It allows developers to create new objects without worrying explicitly about memory allocation and deallocation, because the garbage collector automatically reclaims memory for reuse. This enables faster development with less boilerplate code, while eliminating memory leaks and other memory-related problems. At least in theory.
Ironically, Java garbage collection seems to work too well, creating and removing too many objects. Most memory-management issues are solved, but often at the cost of creating serious performance problems. Making garbage collection adaptable to all kinds of situations has led to a complex and hard-to-optimize system. In order to wrap your head around garbage collection, you need first to understand how memory management works in a Java Virtual Machine (JVM).
How Garbage Collection Really Works
Many people think garbage collection collects and discards dead objects. In reality, Java garbage collection is doing the opposite! Live objects are tracked and everything else designated garbage. As you'll see, this fundamental misunderstanding can lead to many performance problems.
Let's start with the heap, which is the area of memory used for dynamic allocation. In most configurations the operating system allocates the heap in advance to be managed by the JVM while the program is running. This has a couple of important ramifications:
- Object creation is faster because global synchronization with the operating system is not needed for every single object. An allocation simply claims some portion of a memory array and moves the offset pointer forward (see Figure 2.1). The next allocation starts at this offset and claims the next portion of the array.
- When an object is no longer used, the garbage collector reclaims the underlying memory and reuses it for future object allocation. This means there is no explicit deletion and no memory is given back to the operating system.
Figure 2.1: New objects are simply allocated at the end of the used heap.
All objects are allocated on the heap area managed by the JVM. Every item that the developer uses is treated this way, including class objects, static variables, and even the code itself. As long as an object is being referenced, the JVM considers it alive. Once an object is no longer referenced and therefore is not reachable by the application code, the garbage collector removes it and reclaims the unused memory. As simple as this sounds, it raises a question: what is the first reference in the tree?
Garbage-Collection Roots — The Source of All Object Trees
Every object tree must have one or more root objects. As long as the application can reach those roots, the whole tree is reachable. But when are those root objects considered reachable? Special objects called garbage-collection roots (GC roots; see Figure 2.2) are always reachable and so is any object that has a garbage-collection root at its own root.
There are four kinds of GC roots in Java:
- Local variables are kept alive by the stack of a thread. This is not a real object virtual reference and thus is not visible. For all intents and purposes, local variables are GC roots.
- Active Java threads are always considered live objects and are therefore GC roots. This is especially important for thread local variables.
- Static variables are referenced by their classes. This fact makes them de facto GC roots. Classes themselves can be garbage-collected, which would remove all referenced static variables. This is of special importance when we use application servers, OSGi containers or class loaders in general. We will discuss the related problems in the Problem Patterns section.
- JNI References are Java objects that the native code has created as part of a JNI call. Objects thus created are treated specially because the JVM does not know if it is being referenced by the native code or not. Such objects represent a very special form of GC root, which we will examine in more detail in the Problem Patterns section below.
Figure 2.2: GC roots are objects that are themselves referenced by the JVM and thus keep every other object from being garbage-collected.
Therefore, a simple Java application has the following GC roots:
- Local variables in the main method
- The main thread
- Static variables of the main class
Marking and Sweeping Away Garbage
To determine which objects are no longer in use, the JVM intermittently runs what is very aptly called a mark-and-sweep algorithm . As you might intuit, it's a straightforward, two-step process:
- The algorithm traverses all object references, starting with the GC roots, and marks every object found as alive.
- All of the heap memory that is not occupied by marked objects is reclaimed. It is simply marked as free, essentially swept free of unused objects.
Garbage collection is intended to remove the cause for classic memory leaks: unreachable-but-not-deleted objects in memory. However, this works only for memory leaks in the original sense. It's possible to have unused objects that are still reachable by an application because the developer simply forgot to dereference them. Such objects cannot be garbage-collected. Even worse, such a logical memory leak cannot be detected by any software (see Figure 2.3). Even the best analysis software can only highlight suspicious objects. We will examine memory leak analysis in the Analyzing the Performance Impact of Memory Utilization and Garbage Collection section, below.
Figure 2.3: When objects are no longer referenced directly or indirectly by a GC root, they will be removed. There are no classic memory leaks. Analysis cannot really identify memory leaks; it can only point out suspicious objects.How Garbage Collection Really Works的更多相关文章
- Java Garbage Collection Basics--转载
原文地址:http://www.oracle.com/webfolder/technetwork/tutorials/obe/java/gc01/index.html Overview Purpose ...
- AutoReleasePool 和 ARC 以及Garbage Collection
AutoReleasePool autoreleasepool并不是总是被auto 创建,然后自动维护应用创建的对象. 自动创建的情况如下: 1. 使用NSThread的detachNewThread ...
- 2.5 – Garbage Collection 自动垃圾回收 Stop-the-world vs. incremental vs. concurrent 垃圾回收策略
2.5 – Garbage Collection 自动垃圾回收 Lua 5.3 Reference Manual http://www.lua.org/manual/5.3/manual.html# ...
- Garbage Collection Optimization for High-Throughput and Low-Latency Java Applications--转载
原文地址:https://engineering.linkedin.com/garbage-collection/garbage-collection-optimization-high-throug ...
- Why you need to understand garbage collection
Why you need to understand garbage collection I’ve been interviewing lots of C# developers recently, ...
- Unity性能优化(3)-官方教程Optimizing garbage collection in Unity games翻译
本文是Unity官方教程,性能优化系列的第三篇<Optimizing garbage collection in Unity games>的翻译. 相关文章: Unity性能优化(1)-官 ...
- [翻译]Java垃圾收集精粹(Java Garbage Collection Distilled)
source URL: http://www.infoq.com/articles/Java_Garbage_Collection_Distilled Name: Java Garbage Colle ...
- The Impact of Garbage Collection on Application Performance
As we’ve seen, the performance of the garbage collector is not determined by the number of dead obje ...
- [Java] 垃圾回收 ( Garbage Collection ) 的步骤演示
关于 JVM 垃圾回收机制的基础内容,可参考上一篇博客 垃圾回收机制 ( Garbage Collection ) 简介 上一篇博客,介绍了堆的内存被分为三个部分:年轻代.老年代.永生代.这篇博文将演 ...
随机推荐
- Codeforces 570C 贪心
题目:http://codeforces.com/contest/570/problem/C 题意:给你一个字符串,由‘.’和小写字母组成.把两个相邻的‘.’替换成一个‘.’,算一次变换.现在给你一些 ...
- 内网公告牌获取天气信息解决方案(C# WebForm)
需求:内网公告牌能够正确显示未来三天的天气信息 本文关键字:C#/WebForm/Web定时任务/Ajax跨域 规划: 1.天定时读取百度接口获取天气信息并存储至Txt文档: 2.示牌开启时请求Web ...
- BackTrack5-r3改源
默认源服务器是国外的,更新起来会很慢,所以要改成国内的. 所需要的文件包地址:http://pan.baidu.com/s/1i3ouc9v(64位更新包)进入BT系统图形模式-将(语言选择器)文件拖 ...
- Protobuf - 使用scons编译proto文件
使用protobuf过程中,需要先对消息结构进行定义,文件以.proto格式结尾.然后要使用google提供的protoc命令行,把.proto文件转成对应的代码文件. protoc --proto_ ...
- win7 64位安装pygame
需要的工具包 Python安装包 Pip安装包(版本无要求) Pygame安装包(版本需要与python匹配) http://jingyan.baidu.com/article/425e69e6ed3 ...
- 学习笔记-- android动画简述
android支持三种类型的动画: ·属性动画 一种补间动画,通过在目标对象的任何属性的两个值之间应用赠了变化,可以生成一种动画效果.这种动画可以用来生成各种效果,例如:改变视图的颜色.透明条.淡入 ...
- Xshell访问虚拟机内Linux
这段时间在家,需要用到Linux,身边的电脑硬盘很小,装双系统用的频率也不高还浪费磁盘空间,还是使用虚拟机,通过Xshell管理虚拟机内Ubuntu还是比较方便的.很早之前学习hadoop的时候就是用 ...
- js中的break ,continue, return (转)
面向对象编程语法中我们会碰到break ,continue, return这三个常用的关键字,那么关于这三个关键字的使用具体的操作是什么呢?我们在使用这三关键字的时候需要注意和需要理解的规则是什么呢? ...
- CPU的栈机制的一个小问题
比如要实现下面这个功能. 我们如果要在10000H处写入自行数据2266H,不能用“mov 内存单元, 寄存器”这类指令.怎么做? 代码: mov ax, 1000h mov ss, ax mov s ...
- java 枚举类型 构造函数及用法
// 1. 定义枚举类型 public enum Light { // 利用构造函数传参 RED (1), GREEN (3), YELLOW (2); // 定义私有变量 private int n ...