Lab 10-1
This lab includes both a driver and an executable. You can run the executable from anywhere, but in order for the program to work properly, the driver must be placed in the C:\Windows\System32 directory where it was originally found on the victim computer. The executable is Lab10-01.exe, and the driver is Lab10-01.sys.
Questions and Short Answers
Does this program make any direct changes to the registry? (Use procmon to check.)
A: If you run procmon to monitor this program, you will see that the only call to write to the registry is to
RegSetValuefor the valueHKLM\SOFTWARE\Microsoft\Cryptography\RNG\Seed. Some indirect changes are made by the calls toCreateServiceA, but this program also makes direct changes to the registry from the kernel that go undetected by procmon.The user-space program calls the
ControlServicefunction. Can you set a breakpoint with WinDbg to see what is executed in the kernel as a result of the call toControlService?A: To set a breakpoint to see what happens in the kernel, you must open the executable within an instance of WinDbg running in the virtual machine, while also debugging the kernel with another instance of WinDbg in the host machine. When Lab10-01.exe is stopped in the virtual machine, you first use the
!drvobjcommand to get a handle to the driver object, which contains a pointer to the unload function. Next, you can set a breakpoint on the unload function within the driver. The breakpoint will be triggered when you restart Lab10-01.exe.What does this program do?
A: This program creates a service to load a driver. The driver code then creates (or modifies, if they exist) the registry keys
\Registry\Machine\SOFTWARE\Policies\Microsoft\WindowsFirewall\StandardProfileand\Registry\Machine\SOFTWARE\Policies\Microsoft\WindowsFirewall\DomainProfile. Setting these registry keys disables the Windows XP firewall.
Detailed Analysis
We begin with some basic static analysis. Examining the executable, we see very few imports other than the standard ones included with every executable. The imports of interest are OpenSCManagerA, OpenServiceA, ControlService, StartServiceA, and CreateServiceA. These indicate the program creates a service, and probably starts and manipulates that service. There appears to be little additional interaction with the system.

The strings output reveals a few interesting strings. The first is C:\Windows\System32\Lab10-01.sys, which suggests that Lab10-01.sys probably contains the code for the service.
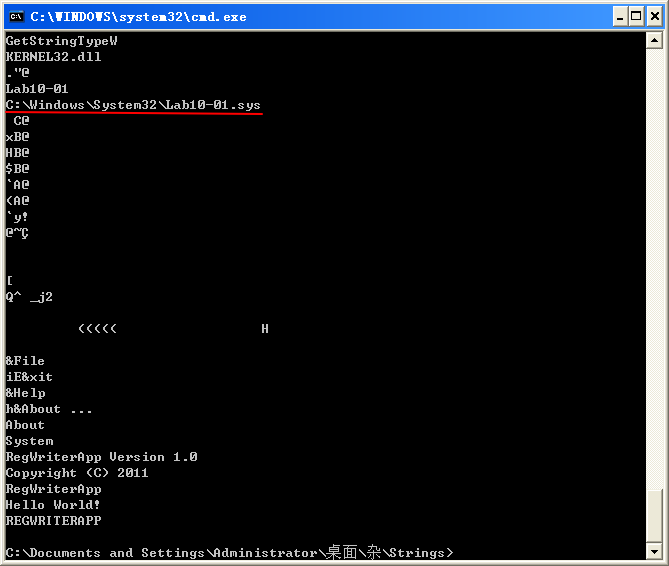
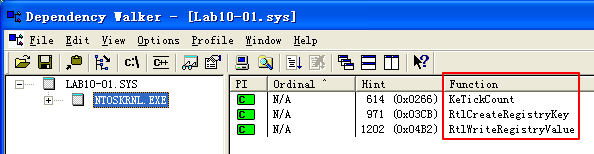
Examining the driver file, we see that it imports only three functions. The first function is KeTickCount, which is included in almost every driver and can be ignored. The two remaining functions, RtlCreateRegistryKey and RtlWriteRegistryValue, tell us that the driver probably accesses the registry.
The driver file also contains a number of interesting strings, as follows:
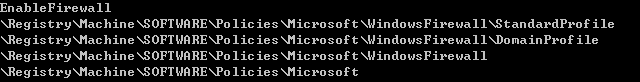
These strings look a lot like registry keys, except that they start with \Registry\Machine, instead of one of the usual registry root keys, such as HKLM. When accessing the registry from the kernel, the prefix \Registry\Machine is equivalent to accessing HKEY_LOCAL_MACHINE from a user-space program. An Internet search reveals that setting the EnableFirewall value to 0 disables the built-in Windows XP firewall.
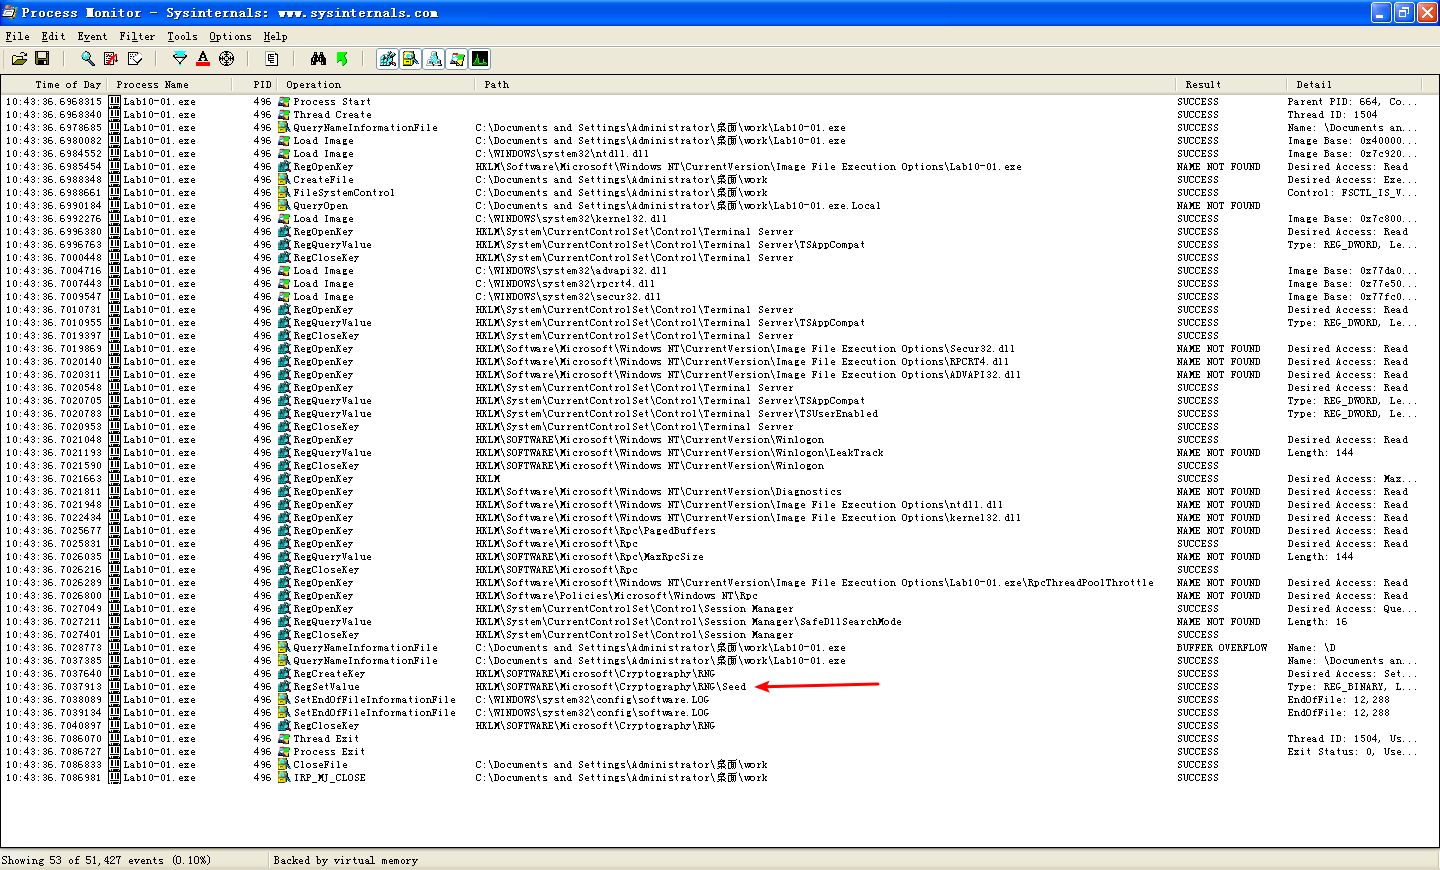
Since these strings suggest that the malware writes to the registry, we open procmon to test our hypothesis. This shows several calls to functions that read the registry, but only one call to write to the registry: RegSetValue on the value HKLM\SOFTWARE\Microsoft\Cryptography\RNG\Seed. This registry value is changed all the time and is meaningless for malware analysis, but since kernel code is involved, we need to make sure that the driver isn’t modifying the registry covertly.
将文件 Lab10-01.sys 拷贝到目录
C:\WINDOWS\system32下。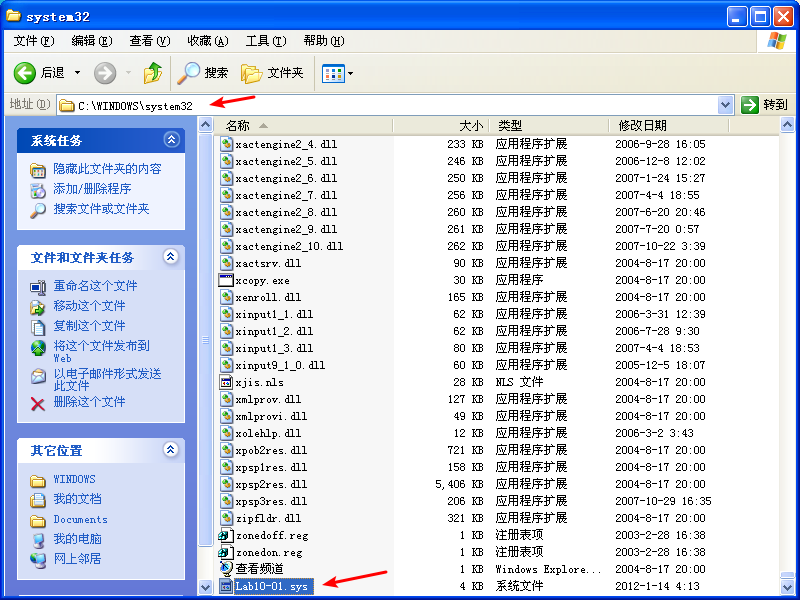
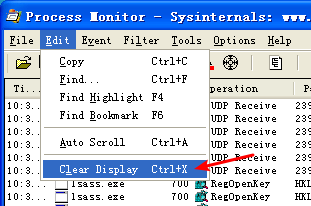
打开 procmon,清楚显示。
添加过滤

启动程序 Lab10-01.exe
Next, we open the executable, navigate to the main function shown in Listing 10-1L, and see that it makes only four function calls.

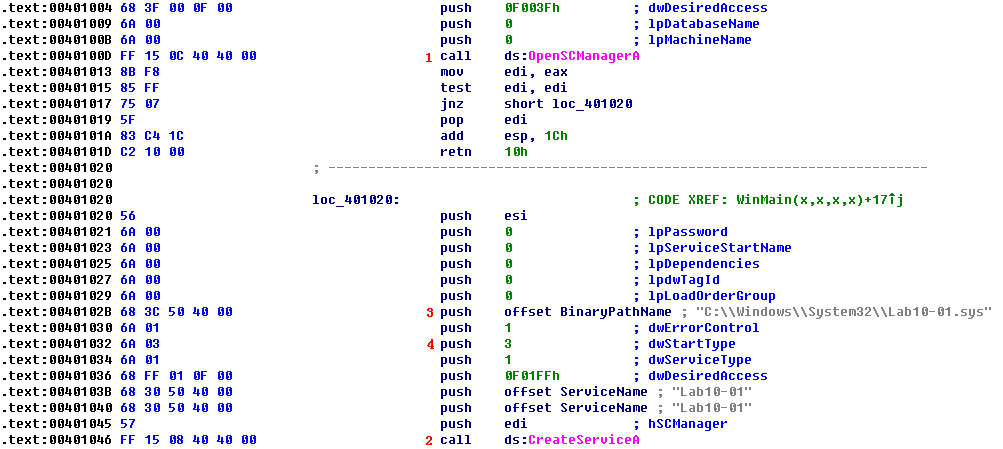
Listing 10-1L: main method of Lab10-01.exe
关于上图中 \({\color{red}1}\) 处说明:Establish a connection to the service control manager on the specified computer and opens the specified database.
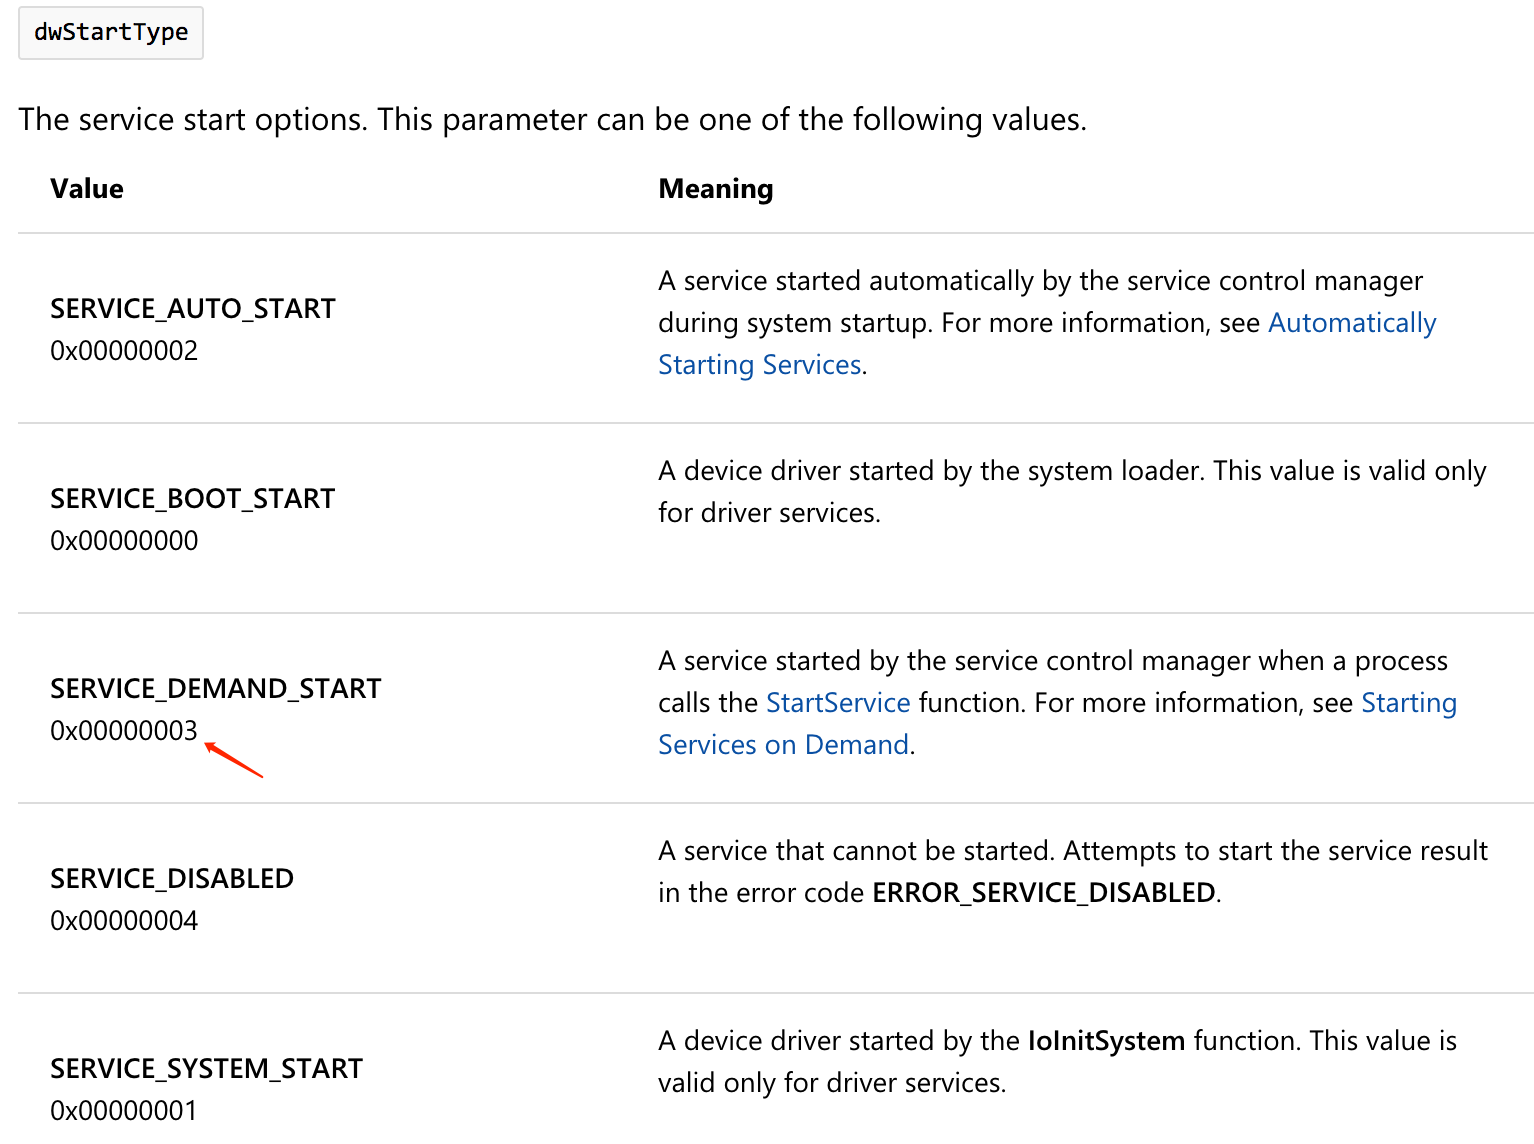
First, it calls OpenSCManagerA at \({\color{red}1}\) to get a handle to the service manager, and then it calls CreateServiceA at \({\color{red}2}\) to create a service called Lab10-01. The call to CreateServiceA tells us that the service will use code in C:\Windows\System32\Lab10-01.sys at \({\color{red}3}\) and that the service type is 3 at \({\color{red}4}\), or SERVICE_KERNEL_DRIVER, which means that this file will be loaded into the kernel.
If the call to CreateServiceA fails, the code calls OpenServiceA with the same service name, as shown in Listing 10-2L at \({\color{red}1}\). This opens a handle to the Lab10-01 service if the CreateServiceA call failed because the service already existed.

Listing 10-2L: Call to OpenServiceA to get a handle to the service for Lab10-01
Next, the program calls StartServiceA to start the service, as shown in Listing 10-3L at \({\color{red}1}\). Finally, it calls ControlService at \({\color{red}2}\). The second parameter to ControlService is what type of control message is being sent. In this case, the value is 0x01 at \({\color{red}3}\), which we look up in the documentation and find that it means SERVICE_CONTROL_STOP. This will unload the driver and call the driver’s unload function.
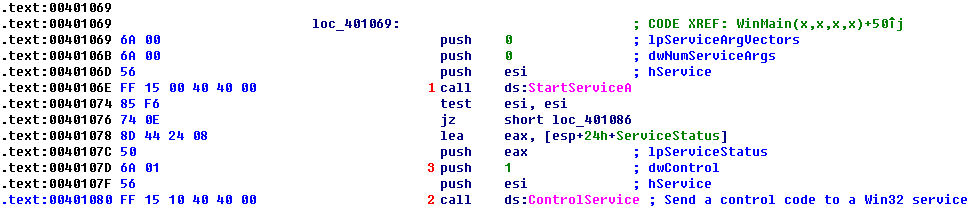
Listing 10-3L: Call to ControlService from Lab10-01.exe
SERVICE_CONTROL_STOP
0x00000001
Notifies a service that it should stop. The hService handle must have the SERVICE_STOP access right.After sending the stop request to a service, you should not send other controls to the service.
Viewing Lab10-01.sys in IDA Pro
Before we try to analyze the driver with WinDbg, we can open the driver in IDA Pro to examine the DriverEntry function. When we first open the driver and navigate to the entry point, we see the code in Listing 10-4L.
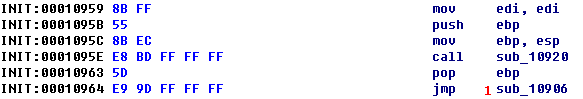
Listing 10-4L: Code at the entry point of Lab10-01.sys
This function is the entry point of the driver, but it’s not the DriverEntry function. The compiler inserts wrapper code around the DriverEntry. The real DriverEntry function is located at sub_10906 \({\color{red}1}\).
As shown in Listing 10-5L, the main body of the DriverEntry function appears to move an offset value into a memory location, but otherwise it doesn’t make any function calls or interact with the system.

Listing 10-5L: The DriverEntry routine for Lab10-01.sys
Analyzing Lab10-01.sys in WinDbg
Now, we can use WinDbg to examine Lab10-01.sys to see what happens when ControlService is called to unload Lab10-01.sys. The code in the user-space executable loads Lab10-10.sys and then immediately unloads it. If we use the kernel debugger before running the malicious executable, the driver will not yet be in memory, so we won’t be able to examine it. But if we wait until after the malicious executable is finished executing, the driver will already have been unloaded from memory.
In order to analyze Lab10-01.sys with WinDbg while it is loaded in memory, we’ll load the executable into WinDbg within the virtual machine. We set a breakpoint between the time that the driver is loaded and unloaded, at the ControlService call, with the following command:
0:000> bp 00401080附 IDA Pro 查看 Lab10-01.exe 图:

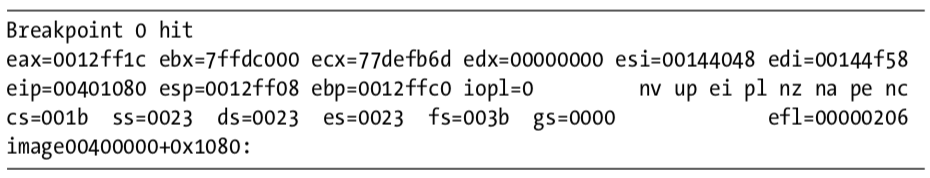
Then we start the program and wait until the breakpoint is hit. When the breakpoint is hit, we are presented with the following information in WinDbg:
Once the program is stopped at the breakpoint, we move out of the virtual machine in order to connect the kernel debugger and get information about Lab10-01.sys. We open another instance of WinDbg and select File -> Kernel Debug with pipe set to \\.\pipe\com_1 and a baud rate of 115200 to connect the instance of WinDbg running in the host machine to the kernel of the guest machine. We know that our service is called Lab10-01, so we can get a driver object by using the !drvobj command, as shown in Listing 10-6L.
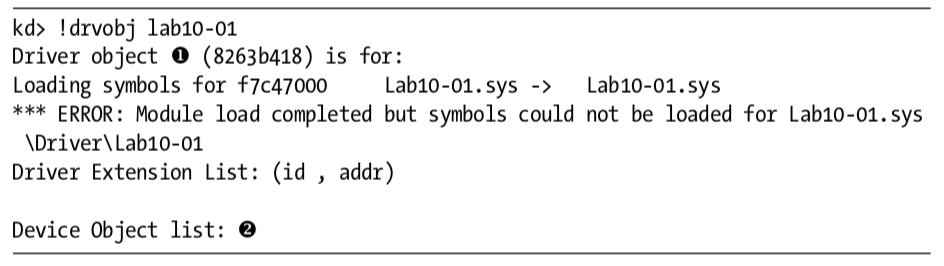
Listing 10-6L: Locating the device object for Lab10-01
The output of the !drvobj command gives us the address of the driver object at \({\color {red} 1}\). Because there are no devices listed in the device object list at \({\color {red} 2}\), we know that this driver does not have any devices that are accessible by user-space applications.
NOTE
To resolve any difficulty locating the service name, you can get a list of driver objects currently in the kernel with the
!object \Drivercommand.
Once we have the address of the driver object, we can view it using the dt command, as shown in Listing 10-7L.
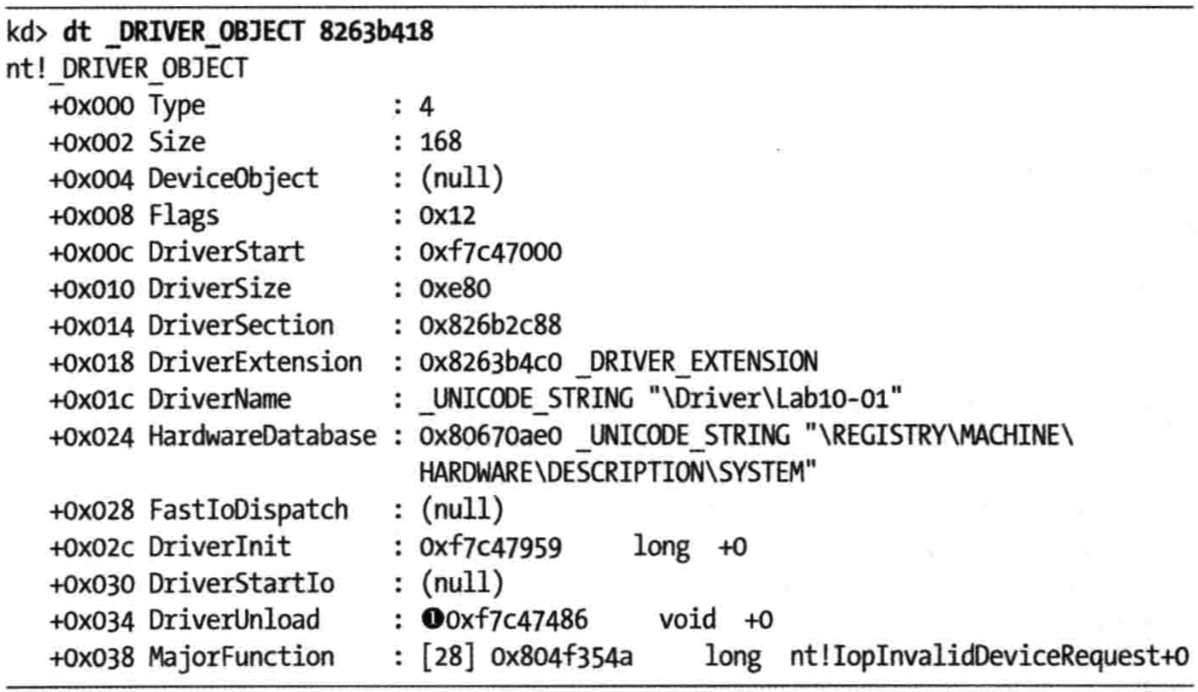
Listing 10-7L: Viewing the driver object for Lab10-01.sys in WinDbg
We’re trying to identify the function called when the driver is unloaded—information at offset 0x034, DriverUnload, as shown at \({\color {red} 1}\). Then we set a breakpoint using the following command:
kd> bp 0xf7c47486Having set the breakpoint, we resume running our kernel. Then we return to the version of WinDbg running on the executable on our virtual machine and resume it as well. Immediately, the entire guest OS freezes because the kernel debugger has hit our kernel breakpoint. At this point, we can go to the kernel debugger to step through the code. We see that the program calls the RtlCreateRegistryKey function three times to create several registry keys, and then calls the RtlWriteRegistryValue twice to set the EnableFirewall value to 0 in two places. This disables the Windows XP firewall from the kernel in a way that is difficult for security programs to detect.
If the unload function at 0xf7c47486 were long or complex, it would have been difficult to analyze in WinDbg. In many cases, it’s easier to analyze a function in IDA Pro once you have identified where the function is located, because IDA Pro does a better job of analyzing the functions. However, the function location in WinDbg is different than the function location in IDA Pro, so we must perform some manual calculations in order to view the function in IDA Pro. We must calculate the offset of the function from the beginning of the file as it is loaded in WinDbg using the lm command, as follows:
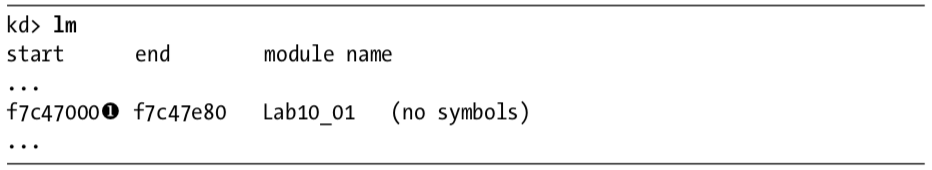
As you can see, the file is loaded at 0xf7c47000 at \({\color {red} 1}\), and from earlier, we know the unload function is located at 0xf7c47486. We subtract 0xf7c47000 from 0xf7c47486 to get the offset (0x486), which we then use to navigate to the unload function in IDA Pro. For example, if the base load address in IDA Pro is 0x00100000, then we navigate to address 0x00100486 to find the unload function in IDA Pro. We can then use static analysis and IDA Pro to confirm what we discovered in WinDbg.
Alternatively, we can change the base address in IDA Pro by selecting Edit -> Segments -> Rebase Program and changing the base address value from 0x00100000 to 0xf7c47000.
NOTE
If you tried to use a deferred breakpoint using the
bu $iment(Lab10-01), you may have run into trouble because WinDbg changes hyphens to underscores when it encounters them in filenames. The correct command to break on the entry point of the driver in this lab would bebu $iment(Lab10_01). This behavior is not documented anywhere and may be inconsistent across versions of WinDbg.
Preference
PRACTICAL MALWARE ANALYSIS: KERNEL DEBUGGING WITH WINDBG (LAB 10-01)
Lab 10-1的更多相关文章
- RH033读书笔记(9)-Lab 10 Understanding the Configuration Tools
Lab 10 Understanding the Configuration Tools Sequence 1: Configuring the Network with system-config- ...
- RH133读书笔记(10)-Lab 10 Exploring Virtualization
Lab 10 Exploring Virtualization Goal: To explore the Xen virtualization environment and the creation ...
- 7 天玩转 ASP.NET MVC — 第 3 天
目录 第 1 天 第 2 天 第 3 天 第 4 天 第 5 天 第 6 天 第 7 天 0. 前言 我们假定你在开始学习时已经阅读了前两天的学习内容.在第 2 天我们完成了关于显示 Employee ...
- 网络编程:基于C语言的简易代理服务器实现(proxylab)
本文记录了一个基于c socket的简易代理服务器的实现.(CS:APP lab 10 proxy lab) 本代理服务器支持keep-alive连接,将访问记录保存在log文件. Github: h ...
- vmware目录2
http://www.globalknowledge.com/training/course.asp?pageid=9&courseid=17880&country=United+St ...
- 很好的vmware目录
http://www.globalknowledge.com/training/course.asp?pageid=9&courseid=18023&country=United+St ...
- python迭代器生成器
1.生成器和迭代器.含有yield的特殊函数为生成器.可以被for循环的称之为可以迭代的.而可以通过_next()_调用,并且可以不断返回值的称之为迭代器 2.yield简单的生成器 #迭代器简单的使 ...
- Cygwin Run in the Windows(Simulation of UNIX)
Preface Environment Cygwin Run in the Windows(Simulation of UNIX) Resource Cygwin Install:http://cyg ...
- Ionic Cordova 环境配置window
1.安装java jdk http://www.oracle.com/technetwork/java/javase/downloads/jdk8-downloads-2133151.html 2.安 ...
- Java标签学习
今天早上看Java编程思想第四章控制执行流程,本来很简单的一些东西,但是突然看到了goto发现自己以前还真的没怎么用过,不过Java中对goto作为保留关键字,而是提供了一个叫标签的东西,我们一起来看 ...
随机推荐
- PHP菜鸟如何开始学习PHP语言
把我自己学习PHP的经验分享出来,既给想学习PHP的朋友提供一个思路,也算是整理一下自己的思路,好给后续的教程开个头吧~ 学习其实也是有方法的,举个例子:在您上学期间,班里一定有学霸,也有学渣,也有普 ...
- Python使用DDA算法和中点Bresenham算法画直线
title: "Python使用DDA算法和中点Bresenham算法画直线" date: 2018-06-11T19:28:02+08:00 tags: ["图形学&q ...
- VMware Workstation 14永久激活密钥
VMware Workstation是一款功能强大的桌面虚拟计算机软件,简单来说就是最强的中文虚拟机了,可以在桌面上运行不同的操作系统 VMware workstation 14永久激活密钥 : CG ...
- Visual Studio 2019 16.0 正式版下载
Visual Studio 2019 16.0 最新版 现在流行 官方版直接下载 在线选择性安装https://www.visualstudio.com/zh-hans/downloads/ Vis ...
- [经验共享] MapGIS实用小功能图解——由excel文件导成MapGIS点文件
项目小组的几个成员都是学地下水和环境的,对于GIS懂得不是很多,于是把一些我们经常用到的mapgis实用小功能做成帮助文档,方便大家使用,发布共享! 1.整理好EXCEL文件(注意X,Y坐标的正确性( ...
- what?iView的DropDown没有element的split-button?提issure?等不及了,自己实现一个
开始正文之前,有必要先说自己实现这个组件的必要性描述. 话说大家做表格时,增删查改按钮都是放在哪里的?最简单的方式应该是这样: 是不是感觉奇丑无比啊,于是改成了这样: 但是这种操作按钮一多后就没位置放 ...
- idea常用操作大全
1.智能提示忽略大小写 Ctrl+Alt+s打开setting setting-->Editor-->General-->Code Completion 或者直接搜索Code Com ...
- C#隐藏父类
一.override和new 关键字隐藏父类的方法 正常情况下,父类virtual的方法,子类override class Animal { public virtual void EatFood() ...
- ORA-19606: Cannot copy or restore to snapshot control file
delete obsolete; 发现出现报错 ORA-19606: Cannot copy or restore to snapshot control file 解决办法:CONFIGURE SN ...
- 2019.04.16打卡(java 数组)
1. 要求输出数组中数据的平均值,并输出所有大于平均值的数据 代码 package block; import java.util.*; public class Average { public ...