通过python统计nginx日志定位php网站响应慢的问题
# 公司网站反映很慢,可能是一些页面的访问方法或者页面引起,通过程序统计nginx访问日志的页面和具体的action方法访问次数以及平均响应时间可以为程序开发的同事提供参考定位具体的代码
# 默认的nginx日志
log_format main '$remote_addr - $remote_user [$time_local] "$request" '
'$status $body_bytes_sent "$http_referer" '
'"$http_user_agent" "$http_x_forwarded_for"';
现在加上响应时间,方便统计
log_format access '$remote_addr - $remote_user [$time_local] "$request" '
'$status $body_bytes_sent "$http_referer" '
'"$http_user_agent" "$http_x_forwarded_for" "$http_host" "$upstream_response_time" "$request_time"' ;
发现统计出来的响应时间$upstream_response_time无法参与计算,于是去掉引号,变为如下,方便计算:
log_format  main  '$remote_addr - $remote_user [$time_local] "$request" '

             '$status $body_bytes_sent "$http_referer" '

             '"$http_user_agent" "$http_x_forwarded_for" "$http_host" $upstream_response_time $request_time';
不需要去掉双引号也可以,用python处理一下去掉两边的双引号即可,如下:
_time = _time.lstrip('"').rstrip('"')
具体的python代码
#encoding=utf-8 from decimal import Decimal
# 找到日志中的top n,日志格式如下
# 192.168.5.46 - - [01/Dec/2017:09:47:21 +0800] "GET /api_moblie_idol.php?action=get_user_guangying_comment&app_platform=android&channelId=S007&starid=6730&version=164&unique_id=A73308A15313C8E34B518CA515288A13&messageid=5a20ae347a11737a288b4738>ui_cid=03908d9fa39c8de124aa01688109b26c&page=7&type=latest HTTP/1.0" 200 70 "-" "-" "223.89.74.82" "data.android.idol001.com" 0.050 0.052
# 统计访问网站php页面和方法的次数,并且生成响应时间
def log_analysis(log_file, dpath, topn = 10):
path=log_file
shandle = open(path, 'r')
count = 1 log_dict = {}
log_dict2 = {}
total_time = 0.0 while True:
# 最好加上strip()碰到换行就无法识别了
line = shandle.readline().strip()
# 如果到了文件末尾就终止
if line == '':
break
nodes = line.split() # 192.168.9.187 - - [30/Nov/2017:18:28:35 +0800] "GET /api_moblie_idol.phpnique_id=5ACE6943 HTTP/1.0" 200 13950 "-" "idol/5900 (iPhone; iOS 10.3.2; Scale/3.00)" "171.221.169.54" "data.idol001.com" "0.144" "0.144" _url, _time = nodes[6], nodes[-2] # 使用?分割页面,获取url,通过action和&分割出action动作
_tmp = _url.split('action')
if len(_tmp) != 2:
continue
_url = _url.split('?')[0] _method = _tmp[1].split('&')[0] # print 'url:%s, method:%s, time:%s' % (_url,_method,_time) # 如果不是数字就跳出本次循环
if _time == '-':
continue try:
# {(url,method):count}当做字典的key
# 统计url,method的次数
if (_url, _method) not in log_dict:
log_dict[(_url, _method)] = 1
else:
log_dict[(_url, _method)] = log_dict[(_url, _method)] + 1 # 统计url,method的累计时间 if (_url, _method) not in log_dict2:
log_dict2[(_url, _method)] = Decimal(_time)
else:
log_dict2[(_url, _method)] = Decimal(_time) + Decimal(log_dict2[(_url, _method)])
except Exception,e:
continue # print log_dict
# print log_dict2
# 关闭文件句柄
shandle.close()
# 对字典进行排序
# ('/index', 'post'): 2
rst_list = log_dict.items()
# print rst_list for j in range(topn):
# 冒泡法根据rst_list中的count排序,找出访问量最大的10个IP
for i in range(0,len(rst_list) - 1):
if rst_list[i][1] > rst_list[i+1][1]:
temp = rst_list[i]
rst_list[i] = rst_list[i+1]
rst_list[i+1] = temp # 获取 topn 个数
need_list = rst_list[-1:-topn - 1:-1] rt_list = []
for _line, _num in need_list:
_tmp_dict = {}
_avg_time = Decimal(log_dict2[_line])/Decimal(_num)
# print '_avg= %s' % _avg_time
_tmp_dict['_num'] = _num
_tmp_dict['_avg'] = _avg_time
rt_list.append((_line,_tmp_dict)) # print rt_list
# 打印出top 10访问日志,并写入网页中
title = 'nginx访问日志'
tbody = ''
for k,v in rt_list:
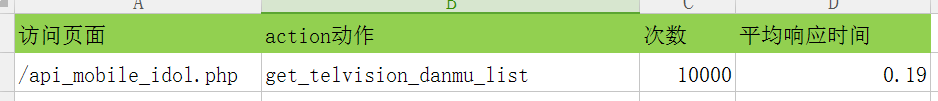
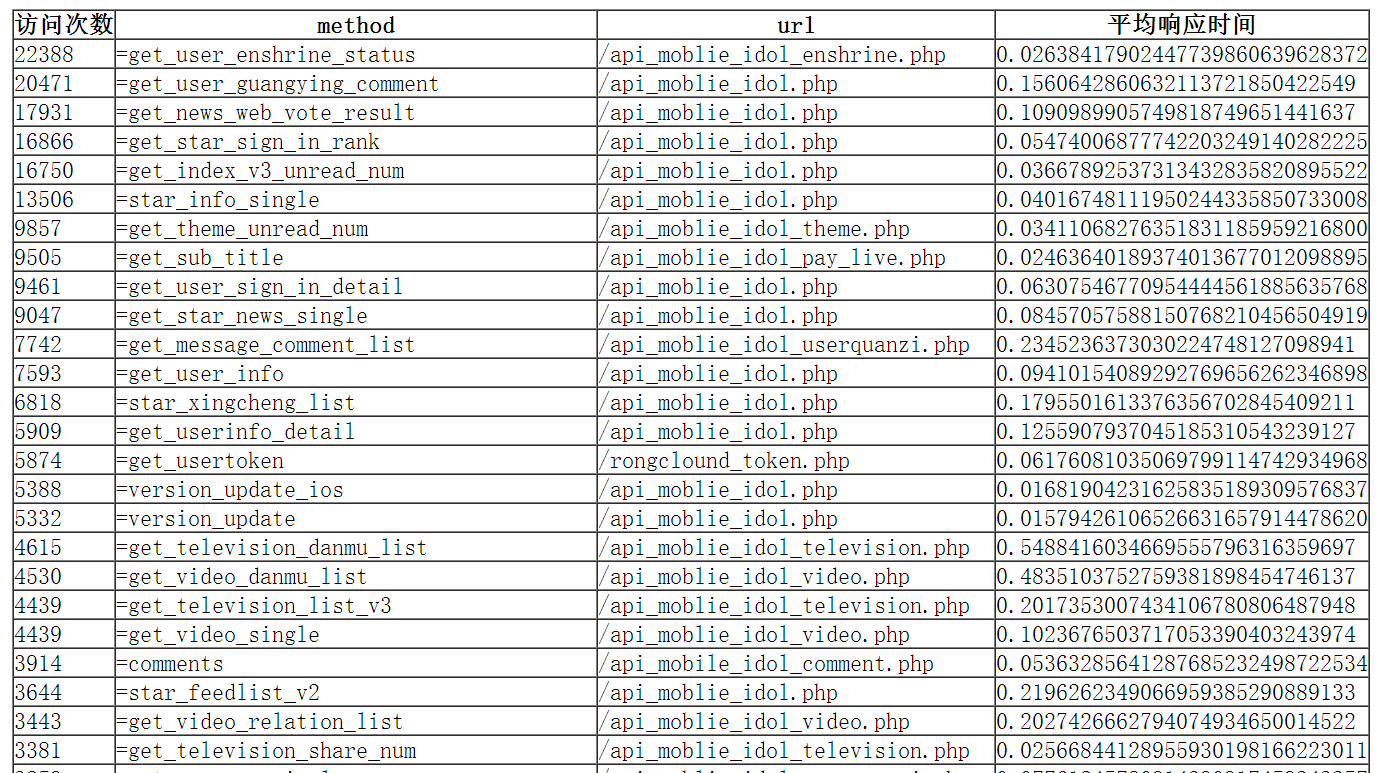
print v['_num'],k[1],k[0],v['_avg']
tbody += '<tr>\n<td>%s</td><td>%s</td><td>%s</td><td>%s</td>\n<tr>\n' % (v['_num'],k[1],k[0],v['_avg']) html_tpl = '''
<!DOCTYPE html>
<html>
<head>
<meta charset="utf-8">
<title>{title}</title>
</head>
<body>
<table border="1" cellspacing="0" cellpadding="0" color='pink'>
<thead>
<tr cellspacing="0" cellpadding="0">
<th>访问次数</th>
<th>method</th>
<th>url</th>
<th>平均响应时间</th>
</tr>
</thead>
{tbody}
</table>
</body>
</html>
'''
html_handle = open(dpath,'w')
html_handle.write(html_tpl.format(title = title, tbody = tbody))
html_handle.close() # 函数入口
if __name__ == '__main__':
# nginx日志文件
log_file = 'access_android_idol001_com.log'
dpath = 'top1000.html'
# topn 表示去top多少个
# 不传,默认10个
topn = 1000
log_analysis(log_file,dpath,topn)
最终的效果:
通过python统计nginx日志定位php网站响应慢的问题的更多相关文章
- 使用Python 统计nginx日志前十ip访问量并以柱状图显示
脚本内容: import matplotlib.pyplot as plt # nginx_file = '10.6.11.91_access.log-2018-12-27' ip = {} #筛选n ...
- 统计nginx日志里流量
用awk可以,比如,我想统计nginx日志里,今天下午3点0分,这一分钟内,访问的流量(文件的大小) grep "07/Nov/2013:15:00:" *.log|awk '{ ...
- Python切割nginx日志_小组_ThinkSAAS
Python切割nginx日志_小组_ThinkSAAS Python切割nginx日志
- 统计nginx日志
.根据访问IP统计UV awk '{print $1}' access.log|sort | uniq -c |wc -l .统计访问URL统计PV awk '{print $7}' access.l ...
- linux统计nginx日志中请求访问量命令
Nginx 三种分配策略:轮询.权重.ip_hash(比如你登录了一个网站,登录信息已经保存到 a 机器,但当你做后续操作时的请求会到 b 机器,那么就获取不到你原来登录的信息,此时你就需要重新登录了 ...
- 利用python分析nginx日志
最近在学习python,写了个脚本分析nginx日志,练练手.写得比较粗糙,但基本功能可以实现. 脚本功能:查找出当天访问次数前十位的IP,并获取该IP来源,并将分析结果发送邮件到指定邮箱. 实现前两 ...
- 统计nginx日志单IP访问请求数排名
下面是我截取一段nginx日志 /Jan/::: +] "-" "Mozilla/5.0 (X11; Ubuntu; Linux x86_64; rv:31.0) Gec ...
- Grafana和influxdb监控nginx日志中的请求响应时间图形化监控
监控效果如图: 监控方法: 通过logstash过滤nginx日志,然后解析出nginx日志中的request time字段 然后output到influxdb时序数据库中 通过grafana展示数据 ...
- python统计nginx脚本信息
#!/usr/bin/env python # -*- coding: utf-8 -*- import urllib2 import json import subprocess import th ...
随机推荐
- html基本进阶知识【转】
inline和block的区别: 网页一般是两种元素组合起来的,一种是内联元素,也就是行内显示,加上width和height没效果.一种是区块元素,可以加上对应的width和height,通常使用在网 ...
- [Android] Android 使用 Greendao 操作 db sqlite(1)-- 直接在MainActivity中调用
继续接上文: Android 使用 Greendao 操作 db sqlite 布局文件: activity_test_green.xml <?xml version="1.0&quo ...
- 一个Silverlight工程的各文件解析
创建一个解决方案,这个解决方案包括一个ASP.NET网站项目和一个Silverlight应用程序项目. 1)ASP.net项目: -------------Default.aspx:ASP.net默认 ...
- 数据建模工具系列 之 让SQL Power Architect支持Vertica
几款数据建模软件评估 下面是流行几款数据建模软件: 软件 特点 支持Vertica? 免费? ERWin 功能强大, 操作较繁琐 不支持Vertica 商业软件,价格高 Power Designer ...
- nginx接入let's encrypt
按以下步骤: 一.放开443端口 我的是云服务器,默认没开放443端口,需要先在控制台放开 二.使用let’s encrypt 生成证书 执行以下命令: git clone https://githu ...
- Android 常见异常及解决办法
Ø 前言 本文主要记录 Android 的常见异常及解决办法,以备以后遇到相同问题时可以快速解决. 1. java.lang.NullPointerException: Attempt to i ...
- REST POST PUT差别
rest api http://www.cnblogs.com/zhangpengshou/archive/2012/07/09/2583096.html Rest模式get,put,post,del ...
- vivalidi 一款由Web技术诞生的Web浏览器
vivalidi https://vivaldi.com/ A million ways to customize everything The world is a colorful place b ...
- C#水晶报表教程
http://apps.hi.baidu.com/share/detail/24298108 水晶报表是一个功能强大的报表工具,现在已经被Microsoft Visual Studio 2005(下文 ...
- 20155324 2016-2017-2 《Java程序设计》第6周学习总结
20155324 2016-2017-2 <Java程序设计>第6周学习总结 教材学习内容总结 InputStream与OutputStream 串流设计 1.串流:Java将输入/输出抽 ...