使用 Kafka 和 ELK 搭建测试日志系统(1)
本文仅供自己学习,不合适转载。
这是两篇文章的第一部分。
1. 安装 ELK
1.1 安装 ElasticSearch
在海航云上创建一个 Ubutu 16.4 虚机,2核4GB内存。
(1)执行以下命令,更新系统
sudo apt-get update -y

sudo apt-get upgrade -y
(2)安装 Java
sudo add-apt-repository -y ppa:webupd8team/java

sudo apt-get update

sudo apt-get install oracle-java8-installer -y
(3)安装ES
wget https://artifacts.elastic.co/downloads/elasticsearch/elasticsearch-5.2.2.deb

sudo dpkg -i elasticsearch-5.2..deb
修改/etc/elasticsearch/elasticsearch.yml:
- 将 network.host 修改为本机 ip 即 192.168.10.102
- 将 http.port 修改为 9200
- 将 cluster.name 修改为 elk-test
重启 ES并检查服务状态:
root@elk:/home/ubuntu# service elasticsearch restart

root@elk:/home/ubuntu# service elasticsearch status

● elasticsearch.service - Elasticsearch

   Loaded: loaded (/usr/lib/systemd/system/elasticsearch.service; disabled; vendor preset: enab

   Active: active (running) since Sat -- :: CST; 3s ago

     Docs: http://www.elastic.co

  Process:  ExecStartPre=/usr/share/elasticsearch/bin/elasticsearch-systemd-pre-exec (code=

 Main PID:  (java)

    Tasks:

   Memory: .1G

      CPU: .511s
1.2 安装 Nginx 和 Logstash
创建另一台虚机,安装 Nginx 和 Logstash。
1.2.1 安装 Nginx
apt-get install nginx
Ubuntu安装之后的文件结构大致为:
- 所有的配置文件都在/etc/nginx下,并且每个虚拟主机已经安排在了/etc/nginx/sites-available下
- 程序文件在/usr/sbin/nginx
- 日志放在了/var/log/nginx中
- 并已经在/etc/init.d/下创建了启动脚本nginx
- 默认的虚拟主机的目录设置在了/var/www/nginx-default (有的版本 默认的虚拟主机的目录设置在了/var/www, 请参考/etc/nginx/sites-available里的配置)
启动并查看服务状态:
root@elk:/home/ubuntu# /etc/init.d/nginx start

[ ok ] Starting nginx (via systemctl): nginx.service.

root@elk:/home/ubuntu# /etc/init.d/nginx status

● nginx.service - A high performance web server and a reverse proxy server

   Loaded: loaded (/lib/systemd/system/nginx.service; enabled; vendor preset: enabled)

   Active: active (running) since Sat -- :: CST; 1min 8s ago

 Main PID:  (nginx)

   CGroup: /system.slice/nginx.service

           ├─ nginx: master process /usr/sbin/nginx -g daemon on; master_process on;

           ├─ nginx: worker process

           └─ nginx: worker process

Sep  :: elk systemd[]: Starting A high performance web server and a reverse pro...r...

Sep  :: elk systemd[]: Started A high performance web server and a reverse prox...ver.

Sep  :: elk systemd[]: Started A high performance web server and a reverse prox...ver.

Hint: Some lines were ellipsized, use -l to show in full.
为了测试起见,将端口修改为 88.修改文件/etc/nginx/sites-available/default,并重启 Nginx 服务:
server {

        listen  default_server;

        listen [::]: default_server;
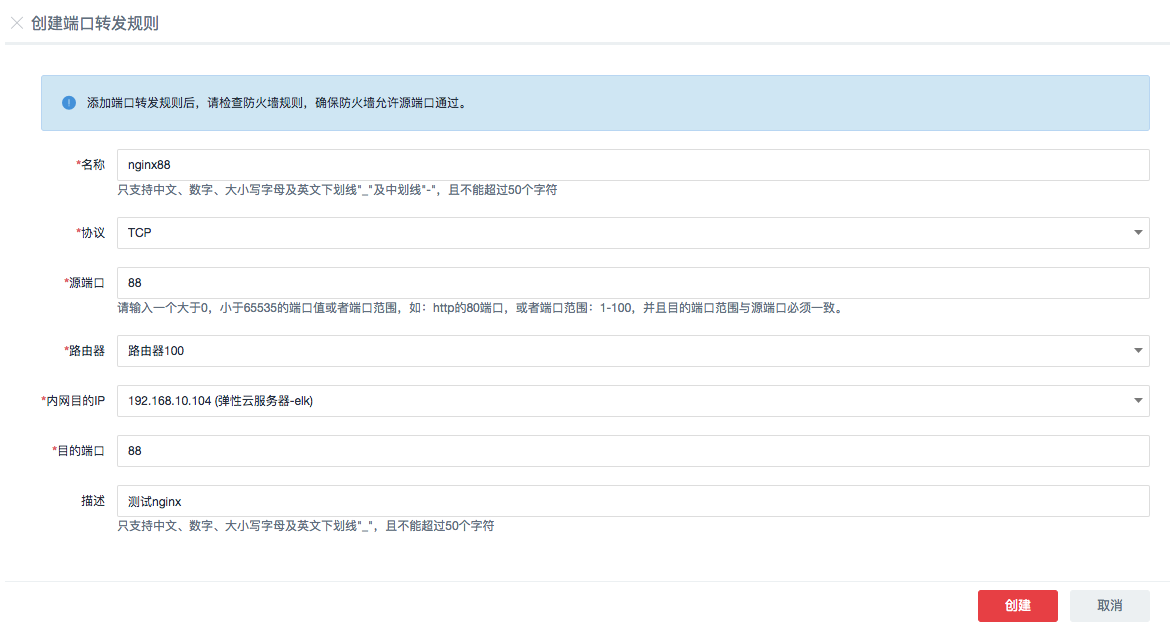
鉴于该服务器没有设置公网IP,在其路由器上设置端口转发规则,使得可以通过路由器的EIP的88端口访问到它上面的Nginx服务:
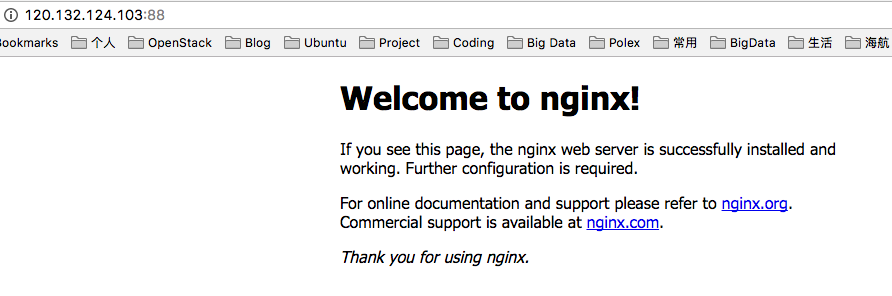
在浏览器上测试,Nginx 可用:
1.2.2 安装和配置 Logstash
wget https://artifacts.elastic.co/downloads/logstash/logstash-5.2.2.tar.gz

tar zxvf logstash-5.2..tar.gz

ln -s logstash-5.2. logstash
创建文件 nginxlog2es.conf,内容如下。它会将 Nginx 的日志文件 /var/log/nginx/access.log_json 中的日志发到 ES 服务器 192.168.10.102:9200:
input {

    file {

        path => "/var/log/nginx/access.log_json"

        codec => "json"

    }

}

filter {

    mutate {

        split => [ "upstreamtime", "," ]

    }

    mutate {

        convert => [ "upstreamtime", "float" ]

    }

}

output {

  stdout { codec => rubydebug }

  elasticsearch {

        hosts => ["192.168.10.102:9200"]

        index => "logstash-%{type}-%{+YYYY.MM.dd}"

        document_type => "%{type}"

        flush_size =>

        idle_flush_time =>

        sniffing => true

        template_overwrite => true

    }

}
修改 /etc/nginx/nginx.conf,添加:
##

        # Logging Settings

        ##

        log_format json '{"@timestamp":"$time_iso8601",'

          '"host":"$server_addr",'

          '"clientip":"$remote_addr",'

          '"size":$body_bytes_sent,'

          '"responsetime":$request_time,'

          '"upstreamtime":"$upstream_response_time",'

          '"upstreamhost":"$upstream_addr",'

          '"http_host":"$host",'

          '"url":"$uri",'

          '"xff":"$http_x_forwarded_for",'

          '"referer":"$http_referer",'

          '"agent":"$http_user_agent",'

          '"status":"$status"}';

        access_log /var/log/nginx/access.log_json json;
重启 Nginx 服务,在浏览器上刷新页面,查看 Nginx 日志,
{"@timestamp":"2017-09-30T12:44:19+08:00","host":"192.168.10.104","clientip":"140.206.84.10","size":,"responsetime":0.000,"upstreamtime":"-","upstreamhost":"-","http_host":"120.132.124.103","url":"/index.nginx-debian.html","xff":"-","referer":"-","agent":"Mozilla/5.0 (Macintosh; Intel Mac OS X 10_12_1) AppleWebKit/537.36 (KHTML, like Gecko) Chrome/60.0.3112.101 Safari/537.36","status":""}
启动logstash,
nohup logstash/bin/logstash -f nginxlog2es.conf > /tmp/logstash.log >& &
刷新 Nginx 页面,能看到 logstash 收集到的 Nginx 日志:
{

         "referer" => "-",

           "agent" => "Mozilla/5.0 (Macintosh; Intel Mac OS X 10_12_1) AppleWebKit/537.36 (KHTML, like Gecko) Chrome/60.0.3112.101 Safari/537.36",

       "http_host" => "120.132.124.103",

             "url" => "/index.nginx-debian.html",

            "path" => "/var/log/nginx/access.log_json",

    "upstreamhost" => "-",

      "@timestamp" => --30T04::.000Z,

            "size" => ,

        "clientip" => "140.206.84.10",

            "host" => "192.168.10.104",

        "@version" => "",

    "responsetime" => 0.0,

             "xff" => "-",

    "upstreamtime" => [

        [] 0.0

    ],

          "status" => ""

}
1.3 安装 Kibana
wget https://artifacts.elastic.co/downloads/kibana/kibana-5.2.2-linux-x86_64.tar.gz

ln -s kibana-5.2.-linux-x86_64 kibana
修改配置文件 kibana/config/kibana.yml,
server.host: "192.168.10.102"

elasticsearch.url: "http://192.168.10.102:9200"
启动 kibana,
nohup kibana/bin/kibana > /tmp/kibana.log >& &
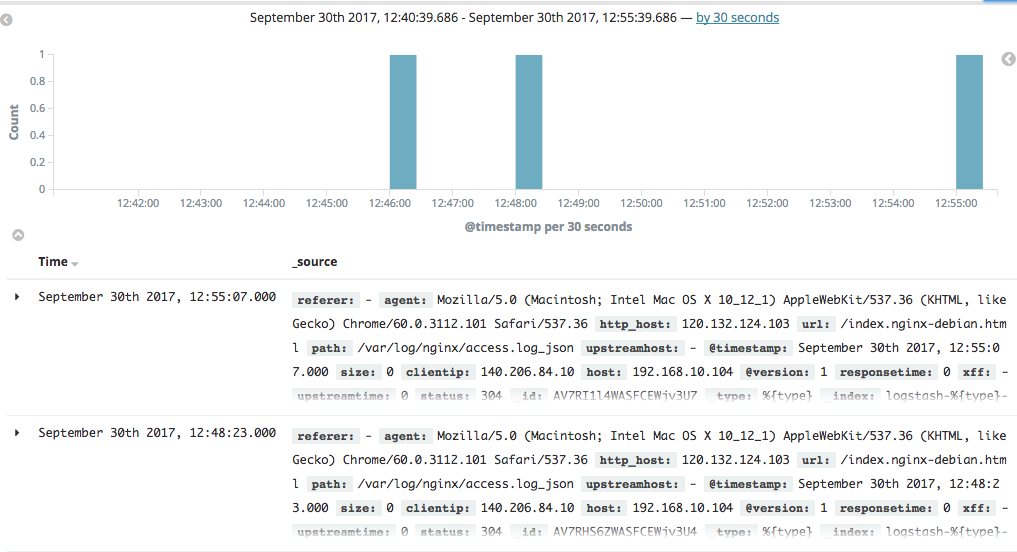
在浏览器里面输入 http://120.132.124.103:5601/ 就可以打开 kibana 页面了。可以看到Nginx 的日志:
1.4 小结
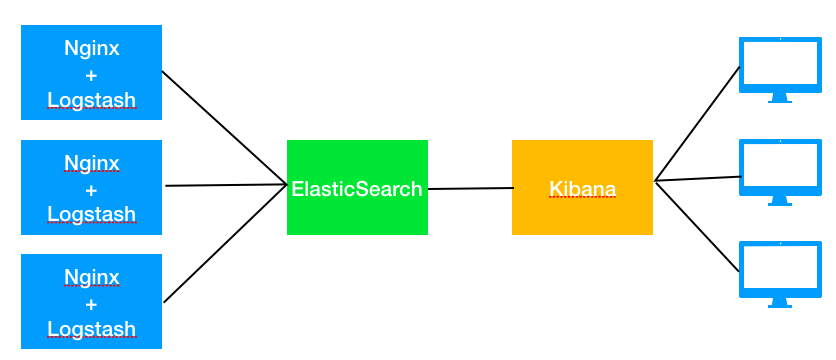
从上面的步骤可以看出,ELK 的结构相对简单:
- Logstack 负责收集日志,并推送到 ES 中
- ES 负责存储
- Kibana 负责界面展示
ELK 的总体架构如下:
但是,这种架构有不少问题,其中问题之一是处理能力问题。bol.com 公司有如下的ELK架构演进路线:
(1)初始架构(2013年)
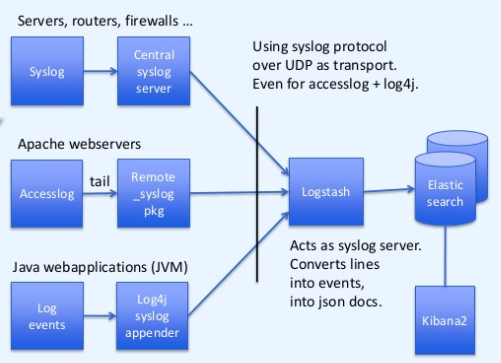
问题是单实例的 logstash 有性能瓶颈。
(2)使用 redis 缓存以及多个 logstash 实例(2014年)
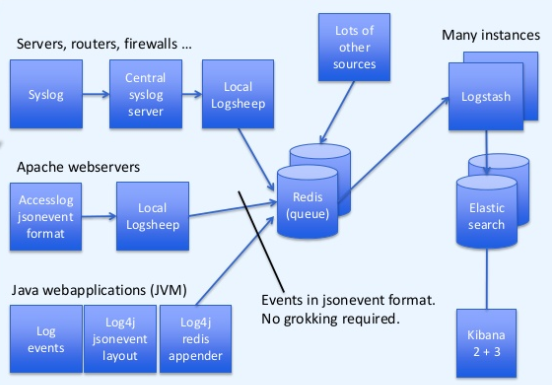
使用 redis 作为消息缓存,使用多实例 Logstash 增加处理性能。
参考链接:
https://devops.profitbricks.com/tutorials/install-and-configure-apache-kafka-on-ubuntu-1604-1/
http://www.cnblogs.com/xiaoqi/p/elk-part1.html
https://www.slideshare.net/TinLe1/elk-atlinked-in
https://www.slideshare.net/renzotoma39/scaling-an-elk-stack-at-bolcom-39412550
https://www.elastic.co/blog/logstash-kafka-intro
https://www.elastic.co/blog/just-enough-kafka-for-the-elastic-stack-part2
https://www.elastic.co/blog/just-enough-kafka-for-the-elastic-stack-part1
使用 Kafka 和 ELK 搭建测试日志系统(1)的更多相关文章
- elk搭建日志系统
参考:https://www.cnblogs.com/yuhuLin/p/7018858.html 以上这篇文章已经写的很好很全了,之所以再自己写一遍大概就是记录一下,以后可能会有用吧 安装elast ...
- Kafka+Zookeeper+Filebeat+ELK 搭建日志收集系统
ELK ELK目前主流的一种日志系统,过多的就不多介绍了 Filebeat收集日志,将收集的日志输出到kafka,避免网络问题丢失信息 kafka接收到日志消息后直接消费到Logstash Logst ...
- ELK+Kafka集群日志分析系统
ELK+Kafka集群分析系统部署 因为是自己本地写好的word文档复制进来的.格式有些出入还望体谅.如有错误请回复.谢谢! 一. 系统介绍 2 二. 版本说明 3 三. 服务部署 3 1) JDK部 ...
- ELK+FileBeat+Log4Net搭建日志系统
ELK+FileBeat+Log4Net搭建日志系统 来源:https://www.zybuluo.com/muyanfeixiang/note/608470 标签(空格分隔): ELK Log4Ne ...
- 2018年ElasticSearch6.2.2教程ELK搭建日志采集分析系统(教程详情)
章节一 2018年 ELK课程计划和效果演示1.课程安排和效果演示 简介:课程介绍和主要知识点说明,ES搜索接口演示,部署的ELK项目演示 es: localhost:9200 k ...
- 基于Kafka+ELK搭建海量日志平台
早在传统的单体应用时代,查看日志大都通过SSH客户端登服务器去看,使用较多的命令就是 less 或者 tail.如果服务部署了好几台,就要分别登录到这几台机器上看,等到了分布式和微服务架构流行时代,一 ...
- 快速搭建ELK日志分析系统
一.ELK搭建篇 官网地址:https://www.elastic.co/cn/ 官网权威指南:https://www.elastic.co/guide/cn/elasticsearch/guide/ ...
- 【ELK】5.spring boot日志集成ELK,搭建日志系统
阅读前必看: ELK在docker下搭建步骤 spring boot集成es,CRUD操作完整版 ============================================== 本章集成 ...
- 用ELK搭建简单的日志收集分析系统【转】
缘起 在微服务开发过程中,一般都会利用多台服务器做分布式部署,如何能够把分散在各个服务器中的日志归集起来做分析处理,是一个微服务服务需要考虑的一个因素. 搭建一个日志系统 搭建一个日志系统需要考虑一下 ...
随机推荐
- react入门到进阶(二)
一.react属性与事件 1.State属性 State,翻译过来是状态的意思,所以它就代表着组件的状态.React把用户界面(UI)当做是状态机,想象它有不同的状态然后渲染这些状态,可以轻松让用户界 ...
- Resin4安装配置
#Resin4安装配置 # Resin4安装配置 #centos6 #参考http://467754239.blog.51cto.com/4878013/1558435 #yum -y install ...
- (高级篇)php结合redis实现高并发下的抢购、秒杀功能
抢购.秒杀是如今很常见的一个应用场景,主要需要解决的问题有两个:1 高并发对数据库产生的压力2 竞争状态下如何解决库存的正确减少("超卖"问题)对于第一个问题,已经很容易想到用缓存 ...
- CSS架构的优选和解决方案
背景 上周我厂前端小伙伴们开了一个技术交流会,关于如何优选CSS架构.解决掉平时写CSS时频繁出现的各种问题,这是前端人员老生常谈的问题,但却很少搬上台面,铺开正式地开交流会.这次会议,便是围绕CSS ...
- js 判断是否为数组的方式 及 类数组转换成数组格式
1. 判断是否为数组的通用方式 Object.prototype.toString.call(o)=='[object Array]' 其他方式: typeof , instanceof, ary ...
- API Gateway - KONG 安装与配置
简介 Kong,是由Mashape公司开源的,基于Nginx的API gateway 特点 可扩展,支持分布式 模块化 功能:授权.日志.ip限制.限流.api 统计分析(存在商业插件Galileo等 ...
- C++、Objective-C 混合编程
在XCODE中想使用C++代码,你须要把文件的扩展名从.m改成.mm.这样才会启动g++编译器. 我们来看个測试代码: [java] view plaincopy class TestC { priv ...
- 新书《Linux就是这个范儿》预售
预售地址 当当 内容简单介绍 本书内容源自淘宝技术大学的培训实战.由来自阿里巴巴集团的资深Linux系统专家赵鑫磊和相同来自阿里巴巴集团的支付宝网络技术有限公司的高级专家Jie Zhang(张洁)共同 ...
- iOS 力学动画生成器UIKit Dynamics 之碰撞效果解说
UIKit Dynamic是iOS7 新增的一组类和方法.可赋予UIView逼真的行为和特征,不须要写动画效果那些繁琐的代码,让开发者可以轻松地改善应用的用户体验.一共同拥有6个可用于定制UIDyna ...
- java文本编辑器v2.0 图形用户界面
package 文本编辑器; import java.awt.BorderLayout; import java.awt.Color; import java.awt.Dimension; impor ...