Blackbox_exporter黑盒监测
一、概述
blackbox_exporter是Prometheus 官方提供的 exporter 之一,可以提供 http、dns、tcp、icmp 的监控数据采集。
Blackbox_exporter 应用场景
- HTTP 测试
定义 Request Header 信息
判断 Http status / Http Respones Header / Http Body 内容
- TCP 测试
业务组件端口状态监听
应用层协议定义与监听
- ICMP 测试
主机探活机制
- POST 测试
接口联通性
- SSL 证书过期时间
二、安装
环境说明
操作系统:centos 6.9
下载解压
各个版本的blackbox_exporter https://github.com/prometheus/blackbox_exporter/releases
以linux系统为例,下载编译好的二进制包,解压使用:
wget https://github.com/prometheus/blackbox_exporter/releases/download/v0.16.0/blackbox_exporter-0.16.0.linux-amd64.tar.gz

tar -zxvf blackbox_exporter-0.16..linux-amd64.tar.gz -C /data

mv /data/blackbox_exporter-0.16..linux-amd64 /data/blackbox_exporter
验证是否安装成功
# cd /data/blackbox_exporter/

# ./blackbox_exporter --version

blackbox_exporter, version 0.16. (branch: HEAD, revision: 991f89846ae10db22a3933356a7d196642fcb9a9)

  build user:       root@64f600555645

  build date:       -::

  go version:       go1.13.4
启动blackbox_exporter
nohup ./blackbox_exporter &
验证是否启动成功
默认监听端口为9115
# ss -tunlp|grep 9115

tcp    LISTEN                             *:                  *:*      users:(("blackbox_export",,))
三、prometheus.yml中加入blackbox_exporter
监控主机存活状态
编辑prometheus配置文件
vi /data/prometheus/prometheus.yml
最后一行添加
  - job_name: node_status

    metrics_path: /probe

    params:

      module: [icmp]

    static_configs:

      - targets: ['10.165.94.31']

        labels:

          instance: node_status

          group: 'node'

    relabel_configs:

      - source_labels: [__address__]

        target_label: __param_target

      - target_label: __address__

        replacement: 172.19.155.133:
注意:10.165.94.31是被监控端ip,172.19.155.133是Blackbox_exporter
监控主机端口存活状态
  - job_name: 'prometheus_port_status'

    metrics_path: /probe

    params:

      module: [tcp_connect]

    static_configs:

      - targets: ['172.19.155.133:8765']

        labels:

          instance: 'port_status'

          group: 'tcp'

    relabel_configs:

      - source_labels: [__address__]

        target_label: __param_target

      - source_labels: [__param_target]

        target_label: instance

      - target_label: __address__

        replacement: 172.19.155.133:
监控网站状态
  - job_name: web_status

    metrics_path: /probe

    params:

      module: [http_2xx]

    static_configs:

      - targets: ['http://www.baidu.com']

        labels:

          instance: user_status

          group: 'web'

    relabel_configs:

      - source_labels: [__address__]

        target_label: __param_target

      - target_label: __address__

        replacement: 172.19.155.133:
检查配置文件是否书写正确
cd /data/prometheus

./promtool check config prometheus.yml
重启prometheus
service restart prometheus
访问targets界面
访问 http://127.0.0.1:9090/targets 查看加入的监控信息。
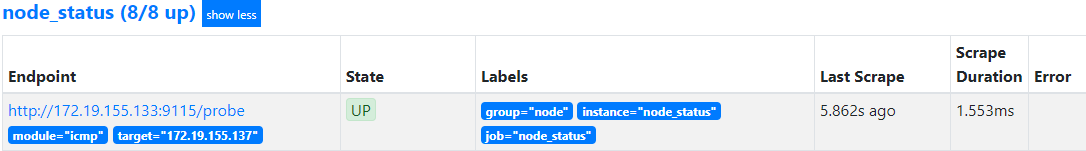
确保状态为 UP
四、grafana中加入blackbox_exporter监控数据
导入blackbox_exporter模板
此模板为9965号模板,数据源选择Prometheus 模板下载地址 https://grafana.com/grafana/dashboards/9965

此模板需要安装饼状图插件 下载地址 https://grafana.com/grafana/plugins/grafana-piechart-panel
安装插件,重启grafana生效。
grafana-cli plugins install grafana-piechart-panel

service grafana-server restart
访问grafana
访问 http://127.0.0.1:3000,查看数据。

本文参考链接:
https://blog.csdn.net/qq_43190337/article/details/100577728
Blackbox_exporter黑盒监测的更多相关文章
- Prometheus 监控之 Blackbox_exporter黑盒监测
Prometheus 监控之 Blackbox_exporter黑盒监测 1.blackbox_exporter概述 1.1 Blackbox_exporter 应用场景 2.blackbox_exp ...
- [置顶]
来自 Google 的高可用架构理念与实践
转自: https://mp.weixin.qq.com/s?__biz=MzAwMDU1MTE1OQ==&mid=402738153&idx=1&sn=af5e76aad ...
- 谈谈iOS app的线上性能监测
在移动端开发者中最重要的KPI应该是崩溃率.当崩溃率稳定下来后,工作的重心就应该转移到性能优化上.那么问题来了,如果你的项目也没有接入任何性能监测SDK,没有量化的指标来衡量,那你说你优化了性能领导信 ...
- blackbox_exporter介绍
Blackbox Exporter是Prometheus社区提供的官方黑盒监控解决方案,其允许用户通过:HTTP.HTTPS.DNS.TCP以及ICMP的方式对网络进行探测. 1.安装部署 cd /u ...
- SignalR系列续集[系列8:SignalR的性能监测与服务器的负载测试]
目录 SignalR系列目录 前言 也是好久没写博客了,近期确实很忙,嗯..几个项目..头要炸..今天忙里偷闲.继续我们的小系列.. 先谢谢大家的支持.. 我们来聊聊SignalR的性能监测与服务器的 ...
- 基于SignalR实现B/S系统对windows服务运行状态的监测
通常来讲一个BS项目肯定不止单独的一个BS应用,可能涉及到很多后台服务来支持BS的运行,特别是针对耗时较长的某些任务来说,Windows服务肯定是必不可少的,我们还需要利用B/S与windows服务进 ...
- Consul-template的简单应用:配置中心,服务发现与健康监测
简介 Consul-template是Consul的一个方扩展工具,通过监听Consul中的数据可以动态修改一些配置文件,大家比较热衷于应用在Nginx,HAProxy上动态配置健康状态下的客户端反向 ...
- fir.im Weekly - APP 性能监测优化 二三事
每一个成功的 App,都拥有强大的性能体验.本期 fir.im Weekly 整理了微信读书.美团外卖. 天猫.美团点评技术团队的关于性能监测优化方面策略和工具的分享,一起来看看. 微信读书 iOS ...
- 服务发现与健康监测框架Consul-DNS转发的应用
关于Consul Consul是一个提供服务注册与发现,健康监测,Key/Value存储以及多数据中心存储的分布式框架.官网地址是https://www.consul.io/,公司初步应用后我们老大觉 ...
随机推荐
- eclipse 导出 jar包详细步骤
如图所示:
- Android中设置状态栏颜色和字体颜色
1.在这里设置的状态栏背景为白色,字体为暗色 创建一个方法进行设置: protected void setStatusBar() { if (Build.VERSION.SDK_INT >= B ...
- [linux] shell脚本编程-统计日志文件中的设备号发通知邮件
1.日志文件列表 比如:/data1/logs/2019/08/15/ 10.1.1.1.log.gz 10.1.1.2.log.gz 2.统计日志中的某关键字shell脚本 zcat *.gz|gr ...
- BitTorrent协议与MagNet协议原理【转】
转自:https://blog.csdn.net/u012785382/article/details/70674875 版权声明:本文为博主原创文章,未经博主允许不得转载. https://blog ...
- ArrayList对象声明& arrayList.size()
此程序用于测试 :每次for循环内重新定义一个Integer数组,赋值后加入arrayList.由于下一次的Integer对象重新定义,原来的对象是否会被释放? 解答:不会,因为原对象仍被引用(被ar ...
- Ubuntu下部署Shipyard管理docker
使用k8s对于我这种新人来说,难度有点大.遂尝试使用Shipyard这个docker web ui工具来进行管理,以方便入门. 首先,我们还是需要在我们的主机上安装docker. 然后官方提供了自动安 ...
- P3731 [HAOI2017]新型城市化(tarjan+网络流)
洛谷 题意: 给出两个最大团的补图,现在要求增加一条边,使得最大最大团个数增加至少\(1\). 思路: 我们求出团的补图,问题可以转换为:对于一个二分图,选择删掉一条边,能够增大其最大独立集的点集数. ...
- nyoj 1278G: Prototypes analyze 与 二叉排序树(BST)模板
参考博客:https://blog.csdn.net/stpeace/article/details/9067029 参考博客:https://blog.csdn.net/baidu_35643793 ...
- 交换机与MPLS
在这一篇里面主要阐述交换机与MPLS的相似点.
- 201777010217-金云馨《面向对象程序设计Java》第四周总结学习
2019面向对象程序设计(Java)第4周学习指导及要求 项目 内容 这个作业属于哪个课程 <任课教师博客主页链接>https://www.cnblogs.com/nwnu-daizh/ ...