ELK之kibana6.5
ELK之安装kibana6.5,这里采用rpm安装:
https://www.elastic.co/guide/en/kibana/current/rpm.html
# wget https://artifacts.elastic.co/downloads/kibana/kibana-6.5.4-x86_64.rpm

# rpm --install kibana-6.5.4-x86_64.rpm

# systemctl daemon-reload

# systemctl enable kibana.service

# systemctl start kibana.service

# systemctl status kibana.service

[root@node1 ELK]# netstat -tnlp|grep 5601

tcp        0      0 127.0.0.1:5601          0.0.0.0:*               LISTEN      7673/node
kibana服务监听在5601端口,将kibana配置文件做一些相应的修改:
[root@node1 ELK]# cd /etc/kibana/

[root@node1 kibana]# ll

总用量 8

-rw-r--r--. 1 root root 5054 12月 18 05:40 kibana.yml

[root@node1 kibana]# vim kibana.yml

[root@node1 kibana]# egrep -v "^$|^#" kibana.yml

server.port: 5601

server.host: "172.16.23.129"

server.name: "node1"

elasticsearch.url: "http://172.16.23.129:9200"
重启kibana服务:
# systemctl restart kibana
通过浏览器进行访问kibana:
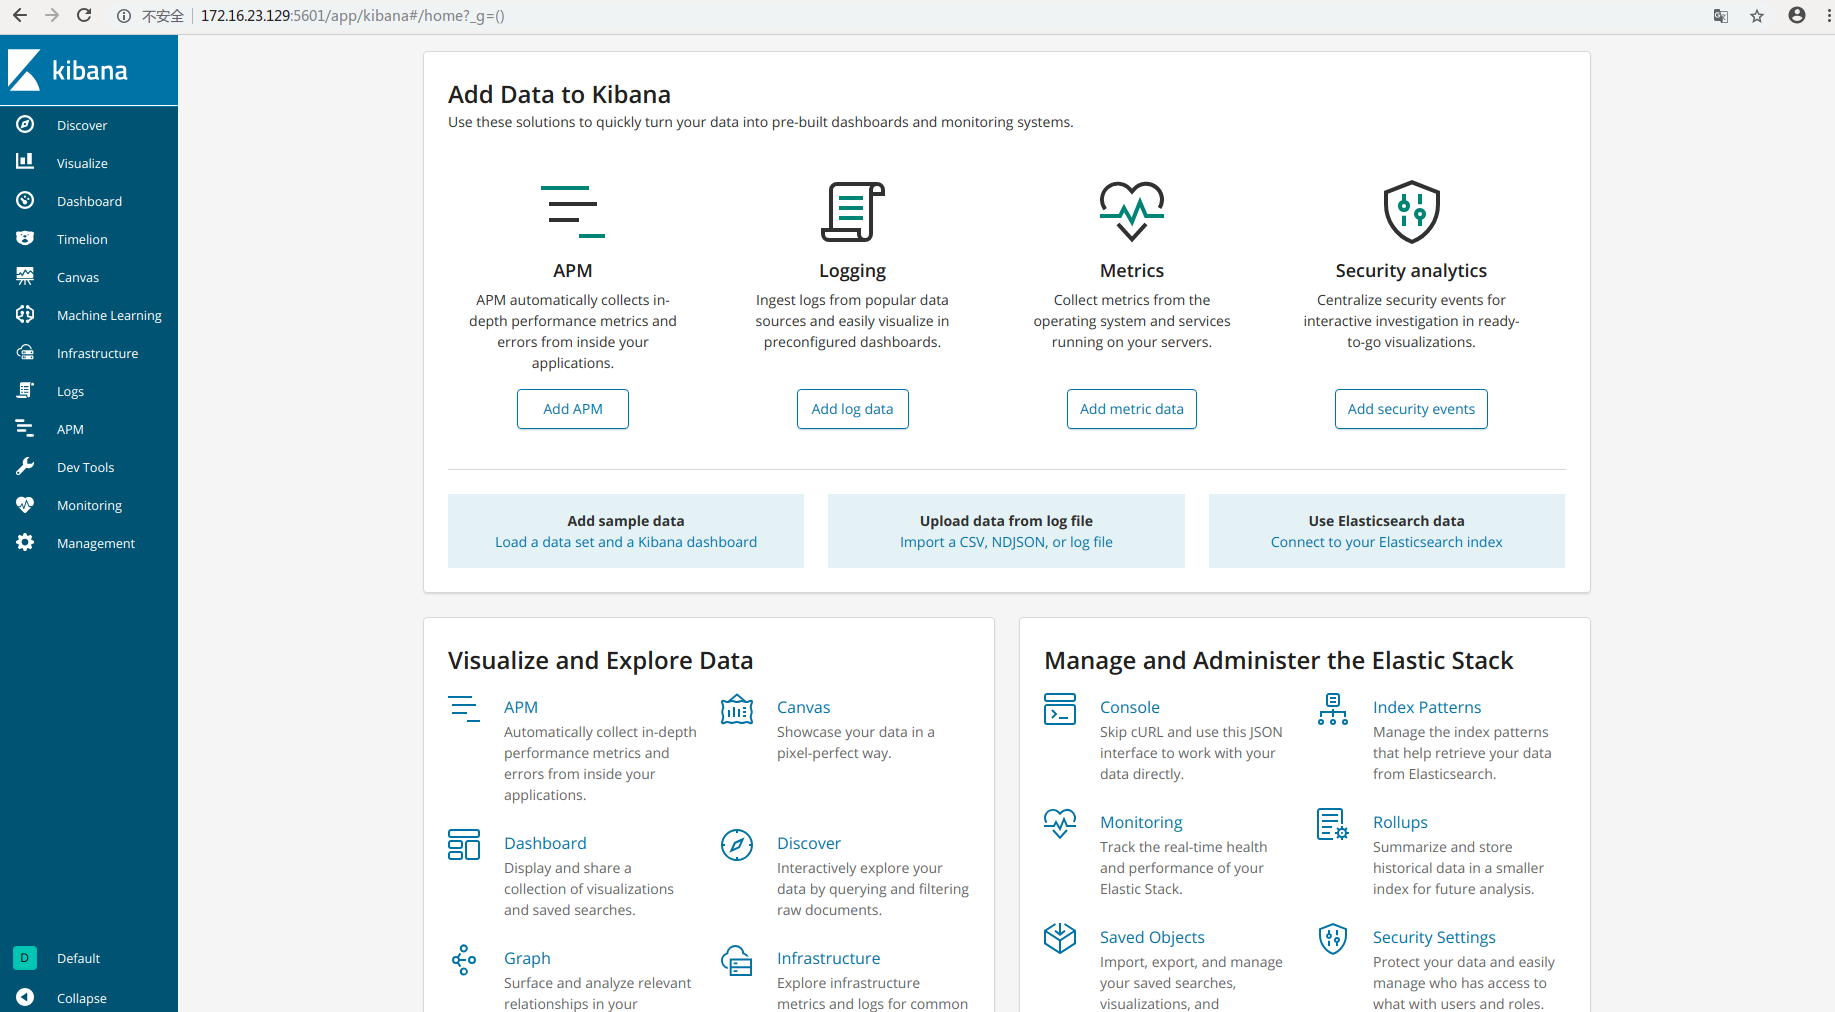
查看上次收集的nginx日志存放在elasticsearch上:
[root@node1 kibana]# curl -X GET "localhost:9200/_cat/indices?v"

health status index                uuid                   pri rep docs.count docs.deleted store.size pri.store.size

yellow open   test1                ZAjj9y_sSPmGz8ZscIXUsA   5   1          0            0      1.2kb          1.2kb

green  open   .kibana_1            CV1LRTOXQV-I04AEh7hcow   1   0          3            0     11.8kb         11.8kb

yellow open   nginx-log-2018.12.25 Zr4q_U5bTk2dY9PfEpZz_Q   5   1         14            0     31.8kb         31.8kb
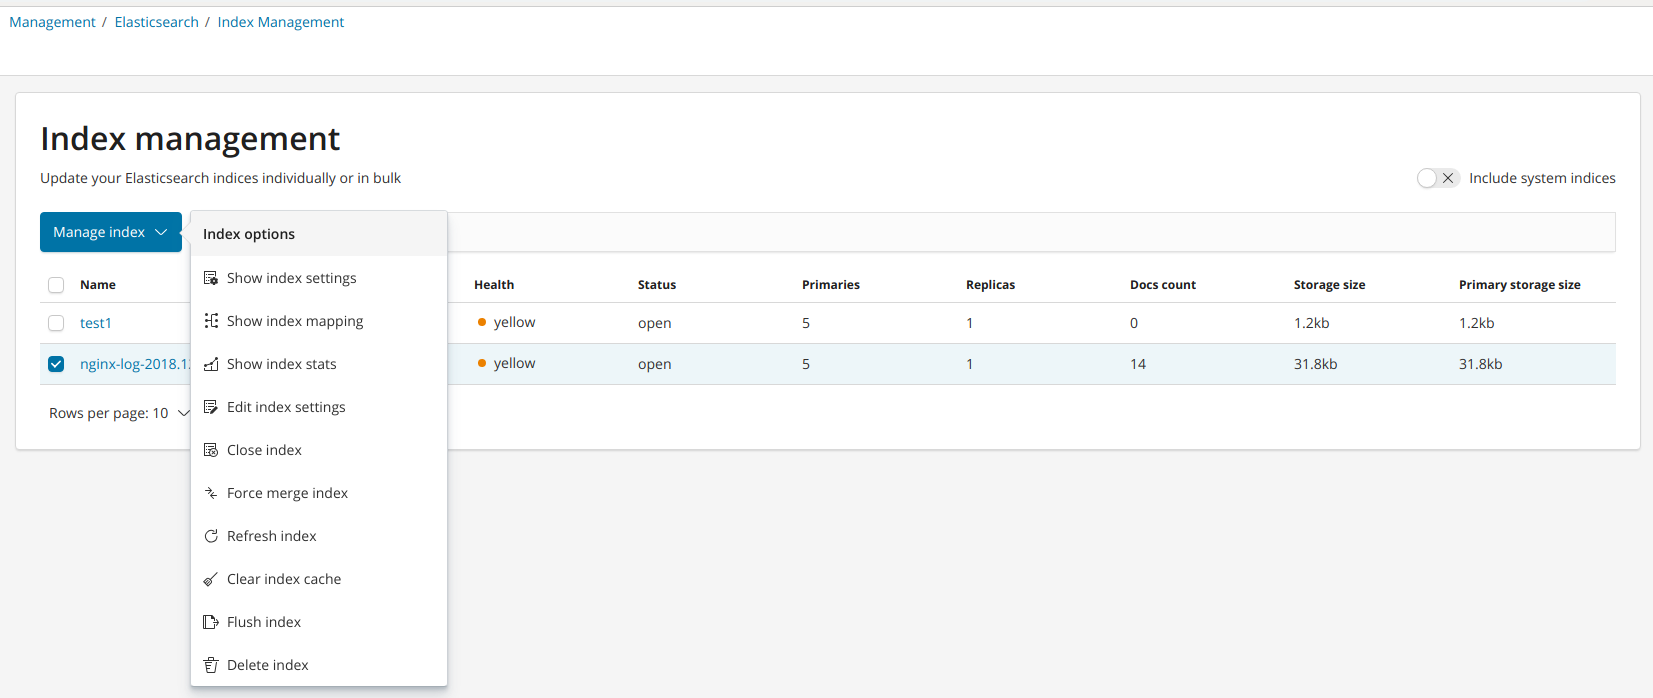
上面nginx-log-2018.12.25这个index即是收集的nginx的日志,现在通过将es与kibana结合起来进行展示出来:
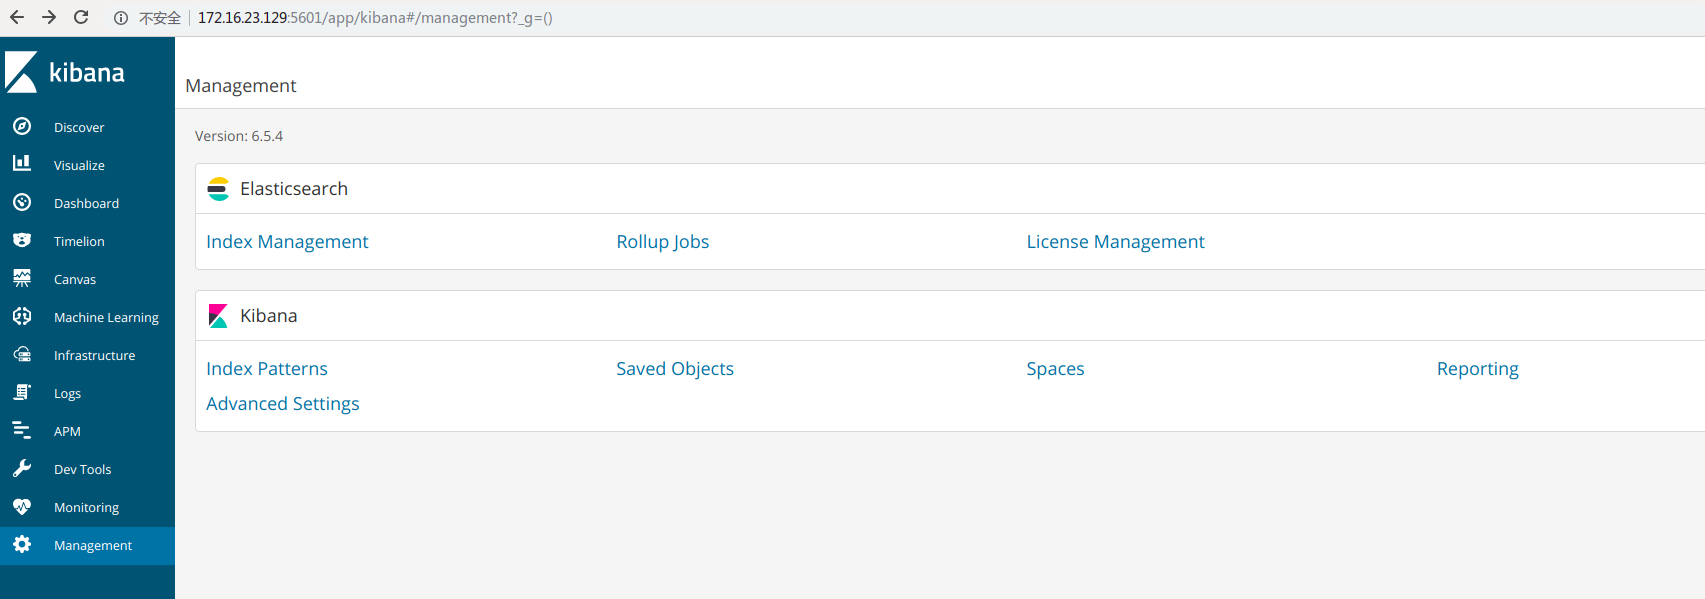
选择左边栏Management然后就可以看见es的index管理,点进去

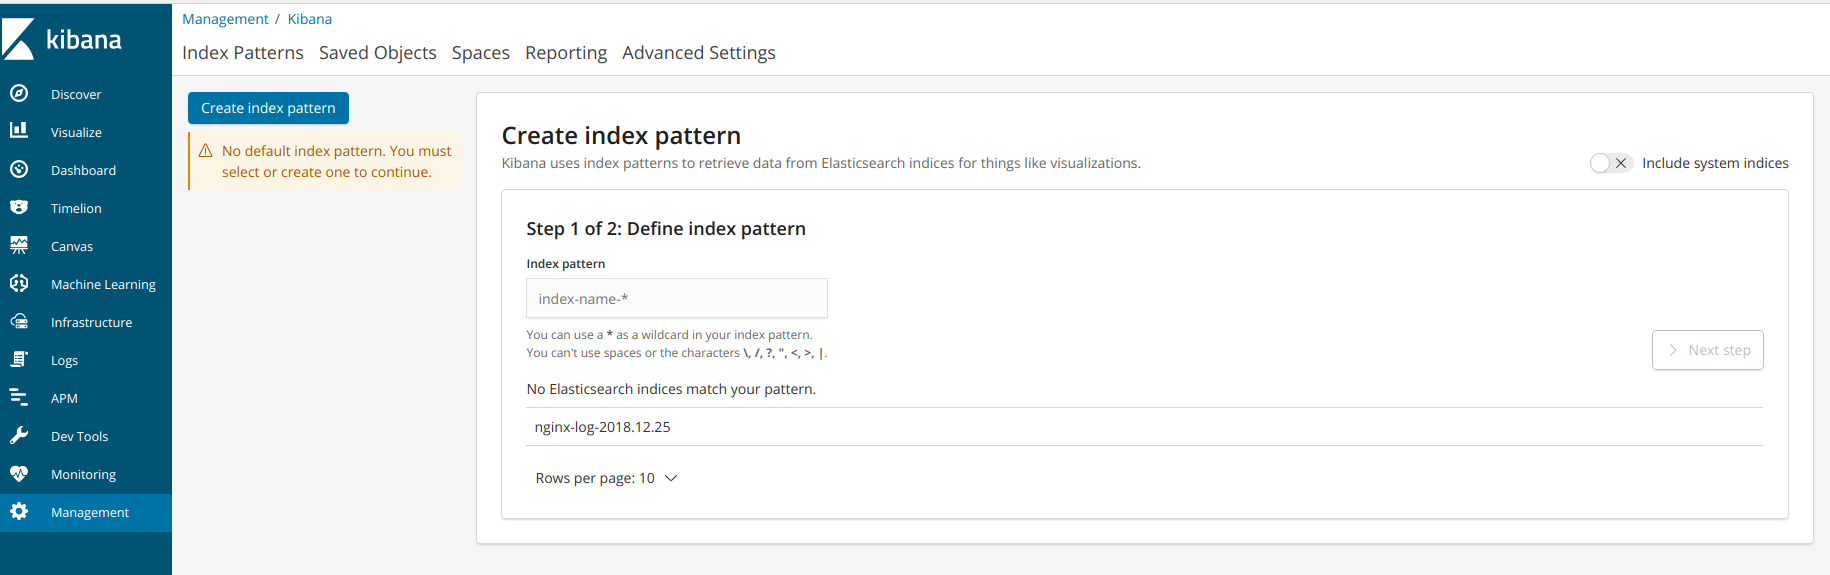
选择Management---->Kibana----->create index pattern:
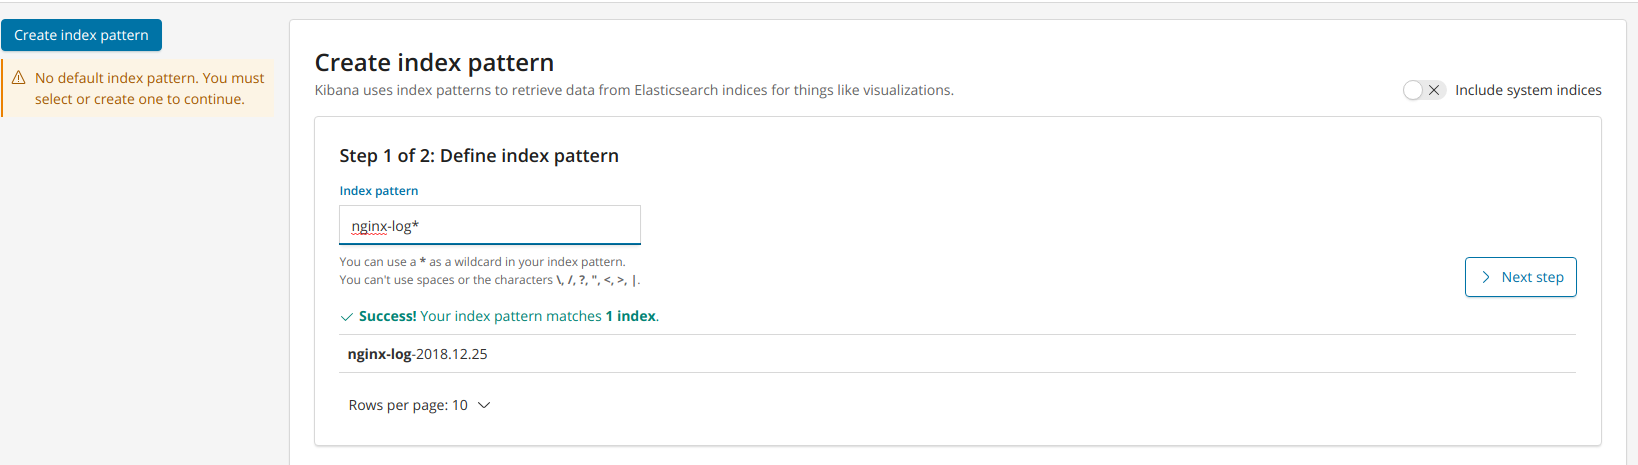

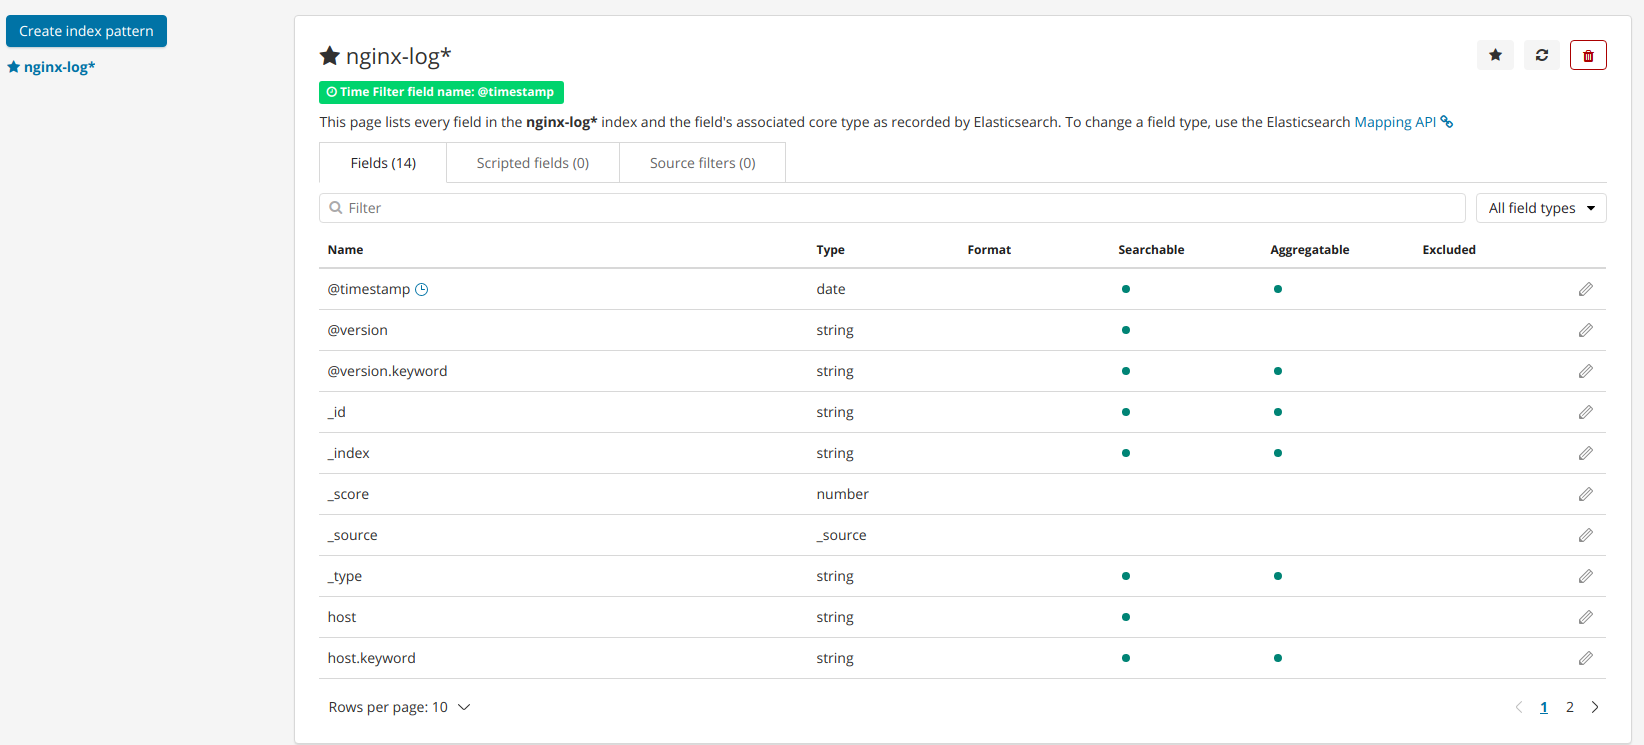
index创建好后,选择discover:
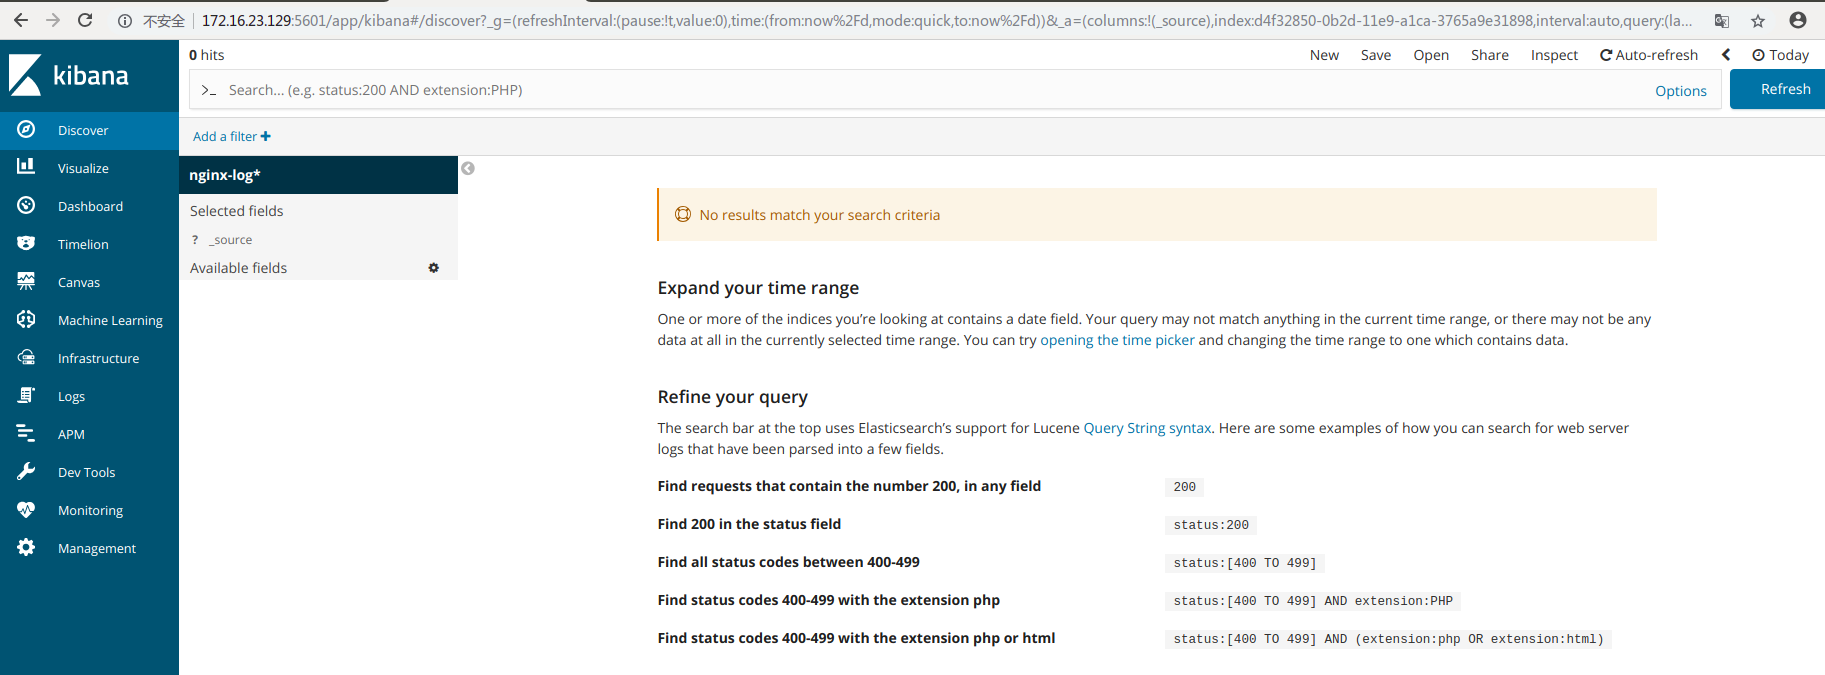
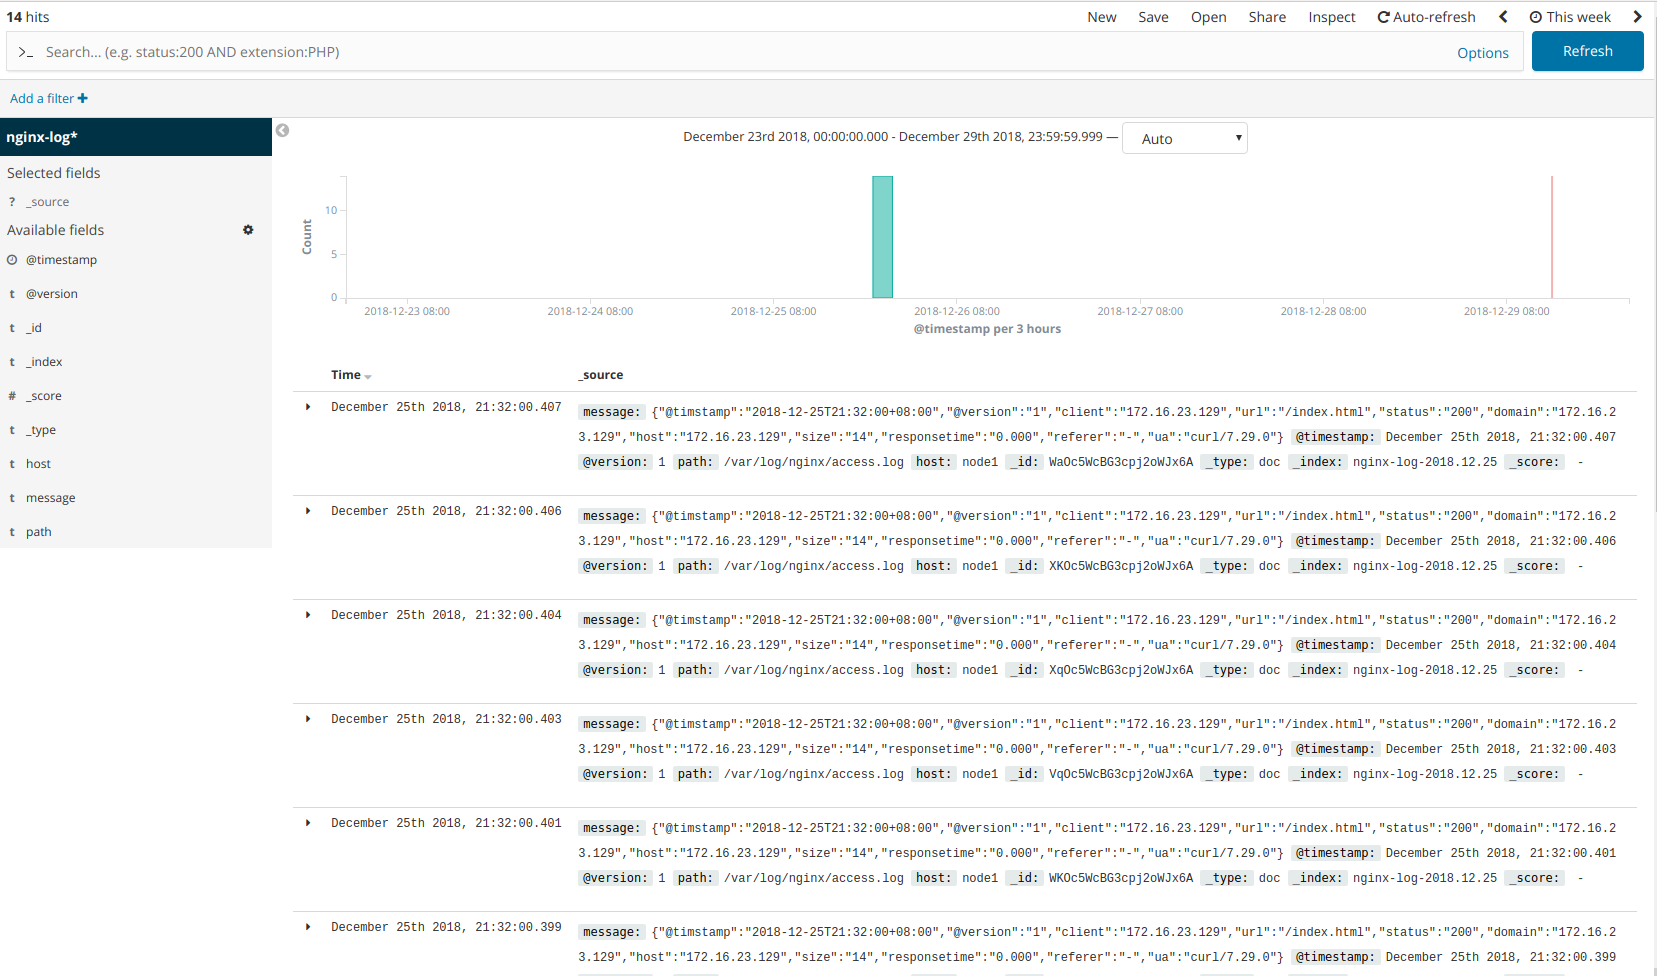
可以看见并没有图形展示出来,因为右上角是today,我们将时间改为this week:
现在将nginx日志输出到redis,然后es到redis中进行消费,这边手动进行访问nginx,然后查询redis库存数据:
1.将nginx日志输出到redis:
[root@node1 conf.d]# /usr/share/logstash/bin/logstash -f nginx_output_redis.conf

Sending Logstash logs to /var/log/logstash which is now configured via log4j2.properties

[2018-12-29T14:04:14,403][WARN ][logstash.config.source.multilocal] Ignoring the 'pipelines.yml' file because modules or command line options are specified

[2018-12-29T14:04:14,470][INFO ][logstash.runner          ] Starting Logstash {"logstash.version"=>"6.5.4"}

[2018-12-29T14:04:20,600][INFO ][logstash.pipeline        ] Starting pipeline {:pipeline_id=>"main", "pipeline.workers"=>4, "pipeline.batch.size"=>125, "pipeline.batch.delay"=>50}

[2018-12-29T14:04:31,474][INFO ][logstash.inputs.file     ] No sincedb_path set, generating one based on the "path" setting {:sincedb_path=>"/var/lib/logstash/plugins/inputs/file/.sincedb_d883144359d3b4f516b37dba51fab2a2", :path=>["/var/log/nginx/access.log"]}

[2018-12-29T14:04:31,574][INFO ][logstash.pipeline        ] Pipeline started successfully {:pipeline_id=>"main", :thread=>"#<Thread:0x7223aec6 run>"}

[2018-12-29T14:04:31,871][INFO ][filewatch.observingtail  ] START, creating Discoverer, Watch with file and sincedb collections

[2018-12-29T14:04:31,917][INFO ][logstash.agent           ] Pipelines running {:count=>1, :running_pipelines=>[:main], :non_running_pipelines=>[]}

[2018-12-29T14:04:33,725][INFO ][logstash.agent           ] Successfully started Logstash API endpoint {:port=>9600}
2.将es通过redis去消费nginx日志生成index:
[root@node1 conf.d]# /usr/share/logstash/bin/logstash -f redis_output_es.conf

Sending Logstash logs to /var/log/logstash which is now configured via log4j2.properties

[2018-12-29T14:04:44,604][WARN ][logstash.config.source.multilocal] Ignoring the 'pipelines.yml' file because modules or command line options are specified

[2018-12-29T14:04:44,965][FATAL][logstash.runner          ] Logstash could not be started because there is already another instance using the configured data directory.  If you wish to run multiple instances, you must change the "path.data" setting.

[2018-12-29T14:04:45,058][ERROR][org.logstash.Logstash    ] java.lang.IllegalStateException: Logstash stopped processing because of an error: (SystemExit) exit
由上面报错知道logstash在同一主机上运行多个会报错,于是采用另外一台主机进行logstash收集到es中:
[root@master conf.d]# /usr/share/logstash/bin/logstash -f redis_output_es.conf

Sending Logstash logs to /var/log/logstash which is now configured via log4j2.properties

[2018-12-29T14:40:06,749][INFO ][logstash.setting.writabledirectory] Creating directory {:setting=>"path.queue", :path=>"/var/lib/logstash/queue"}

[2018-12-29T14:40:06,765][INFO ][logstash.setting.writabledirectory] Creating directory {:setting=>"path.dead_letter_queue", :path=>"/var/lib/logstash/dead_letter_queue"}

[2018-12-29T14:40:07,651][WARN ][logstash.config.source.multilocal] Ignoring the 'pipelines.yml' file because modules or command line options are specified

[2018-12-29T14:40:07,670][INFO ][logstash.runner          ] Starting Logstash {"logstash.version"=>"6.5.4"}

[2018-12-29T14:40:07,742][INFO ][logstash.agent           ] No persistent UUID file found. Generating new UUID {:uuid=>"7059ccab-6ba6-4082-ad0c-6320a1121ed2", :path=>"/var/lib/logstash/uuid"}

[2018-12-29T14:40:13,024][INFO ][logstash.pipeline        ] Starting pipeline {:pipeline_id=>"main", "pipeline.workers"=>4, "pipeline.batch.size"=>125, "pipeline.batch.delay"=>50}

[2018-12-29T14:40:13,957][INFO ][logstash.outputs.elasticsearch] Elasticsearch pool URLs updated {:changes=>{:removed=>[], :added=>[http://172.16.23.129:9200/]}}

[2018-12-29T14:40:14,439][WARN ][logstash.outputs.elasticsearch] Restored connection to ES instance {:url=>"http://172.16.23.129:9200/"}

[2018-12-29T14:40:14,558][INFO ][logstash.outputs.elasticsearch] ES Output version determined {:es_version=>6}

[2018-12-29T14:40:14,567][WARN ][logstash.outputs.elasticsearch] Detected a 6.x and above cluster: the `type` event field won't be used to determine the document _type {:es_version=>6}

[2018-12-29T14:40:14,640][INFO ][logstash.outputs.elasticsearch] New Elasticsearch output {:class=>"LogStash::Outputs::ElasticSearch", :hosts=>["//172.16.23.129"]}

[2018-12-29T14:40:14,678][INFO ][logstash.outputs.elasticsearch] Using mapping template from {:path=>nil}

[2018-12-29T14:40:14,766][INFO ][logstash.outputs.elasticsearch] Attempting to install template {:manage_template=>{"template"=>"logstash-*", "version"=>60001, "settings"=>{"index.refresh_interval"=>"5s"}, "mappings"=>{"_default_"=>{"dynamic_templates"=>[{"message_field"=>{"path_match"=>"message", "match_mapping_type"=>"string", "mapping"=>{"type"=>"text", "norms"=>false}}}, {"string_fields"=>{"match"=>"*", "match_mapping_type"=>"string", "mapping"=>{"type"=>"text", "norms"=>false, "fields"=>{"keyword"=>{"type"=>"keyword", "ignore_above"=>256}}}}}], "properties"=>{"@timestamp"=>{"type"=>"date"}, "@version"=>{"type"=>"keyword"}, "geoip"=>{"dynamic"=>true, "properties"=>{"ip"=>{"type"=>"ip"}, "location"=>{"type"=>"geo_point"}, "latitude"=>{"type"=>"half_float"}, "longitude"=>{"type"=>"half_float"}}}}}}}}

[2018-12-29T14:40:14,823][INFO ][logstash.inputs.redis    ] Registering Redis {:identity=>"redis://@172.16.23.129:6379/0 list:nginx_log"}

[2018-12-29T14:40:14,892][INFO ][logstash.pipeline        ] Pipeline started successfully {:pipeline_id=>"main", :thread=>"#<Thread:0x3f08e08c run>"}

[2018-12-29T14:40:15,134][INFO ][logstash.agent           ] Pipelines running {:count=>1, :running_pipelines=>[:main], :non_running_pipelines=>[]}

[2018-12-29T14:40:16,254][INFO ][logstash.agent           ] Successfully started Logstash API endpoint {:port=>9600}
3.查看生成的index:
[root@node1 conf.d]# curl -X GET "localhost:9200/_cat/indices?v"

health status index                uuid                   pri rep docs.count docs.deleted store.size pri.store.size

green  open   .kibana_1            CV1LRTOXQV-I04AEh7hcow   1   0          4            0       19kb           19kb

yellow open   nginx-log-2018.12.25 Zr4q_U5bTk2dY9PfEpZz_Q   5   1         14            0     31.8kb         31.8kb

yellow open   nginx-log-2018.12.29 KTWG3qeGTCeuknJCE4juaA   5   1         10            0     35.1kb         35.1kb

yellow open   test1                ZAjj9y_sSPmGz8ZscIXUsA   5   1          0            0      1.2kb          1.2kb
然后查看kibana的index:

ELK之kibana6.5的更多相关文章
- ELK Stack 笔记
ELK Stack ELK Stack ELK Stack ELK 介绍 架构 Elasticsearch 安装 常见问题 关闭 Elasticsearch Elasticsearch-head Ki ...
- elk之[logstash-input-file]插件使用详解
https://www.cnblogs.com/xing901022/p/4805586.html http://www.cnblogs.com/xing901022/p/4802822.html ...
- 从零开始搭建系统2.2——ELK安装及配置
ELK 最新版本对JDK的最低要求是1.8,安装java_1.8版本 一.Elasticsearch 1.创建目录 2.下载安装包 wget https://artifacts.elastic.co/ ...
- CentOS7.5搭建ELK6.2.4集群及插件安装
一 简介 Elasticsearch是一个高度可扩展的开源全文搜索和分析引擎.它允许您快速,近实时地存储,搜索和分析大量数据.它通常用作支持具有复杂搜索功能和需求的应用程序的底层引擎/技术. 下载地址 ...
- ELK6.2.4集群
ELK6.2.4集群安装使用 https://www.cnblogs.com/frankdeng/p/9139035.html 一 简介 Elasticsearch是一个高度可扩展的开源全文搜索和分析 ...
- Centos7.5搭建ELK-6.5.0日志分析平台
Centos7.5搭建ELK-6.5.0日志分析平台 1. 简介 工作工程中,不论是开发还是运维,都会遇到各种各样的日志,主要包括系统日志.应用程序日志和安全日志,对于开发人员来说,查看日志,可以实时 ...
- ElasticSearch实战系列一: ElasticSearch集群+Kinaba安装教程
前言 本文主要介绍的是ElasticSearch集群和kinaba的安装教程. ElasticSearch介绍 ElasticSearch是一个基于Lucene的搜索服务器,其实就是对Lucene进行 ...
- ELK6.x_Kafka 安装配置文档
1. 环境描述 1.1. 环境拓扑 如上图所示:Kafka为3节点集群负责提供消息队列,ES为3节点集群.日志通过logstash或者filebeat传送至Kafka集群,再通过logstash发 ...
- CentOS7.5搭建ES6.2.4集群与简单测试
一 简介 Elasticsearch是一个高度可扩展的开源全文搜索和分析引擎.它允许您快速,近实时地存储,搜索和分析大量数据.它通常用作支持具有复杂搜索功能和需求的应用程序的底层引擎/技术. 下载地址 ...
随机推荐
- Docker命令详解(build篇)
命令格式:docker build [OPTIONS] <PATH | URL | -> Usage: Build an image from a Dockerfile. 中文意思即:使用 ...
- java重载和重载的区别
重载 public class A{ public void test(){} public void test(int num){} public void test(Str ...
- Win_Server_2008 安装 Oracle_11g EM时上载EM资料失败
此问题本人也遇到过.在网上找到了解决方案.下部分引用IT PUB. 安装oracle11g 64位.创建数据库到快结束的时候,报告说EM无法创建.emca_2010_06_13_11_05_36.lo ...
- 【源码】rm zip 删除文件夹中大量的小文件 百万 扫描文件时间
rm 删除文件夹中大量的小文件 百万 迟迟未删除 在扫描文件? rm删除命令源码分析 - ty_laurel的博客 - CSDN博客 https://blog.csdn.net/ty_laurel/ ...
- ES6 ruanyifeng, shim polyfill
http://www.cnblogs.com/upup2015/p/7927485.html 一个等号是赋值操作,==先转换类型再比较,===先判断类型,如果不是同一类型直接为false npm in ...
- linux系统下添加计划任务执行php文件方法
在web开发过程中,经常需要设定一些定期执行的任务,比如商品定时上下架.我们以php文件为例,讲解linux下的计划任务,来看看吧 在web开发过程中,经常需要设定一些定期执行的任务,比如商品定时 ...
- Fire Game--FZU2150(bfs)
http://acm.fzu.edu.cn/problem.php?pid=2150 http://acm.hust.edu.cn/vjudge/contest/view.action?cid=659 ...
- 洛谷P1941 飞扬的小鸟 [noip2014] 背包
正解:背包 解题报告: 话说好久没做背包的题了,都有些陌生了?这几天加强基础题目多刷点儿dp和背包趴qwq 其实这题是95...然后我下了我错的那个测试点,我答案是9874正解是9875...然后读入 ...
- 【Pyton】【小甲鱼】爬虫
一.什么是爬虫? 可以理解为一只蜘蛛,在不同的网页上爬来爬去,获取我们需要的资源 二.Python如何访问互联网 urllib(一个包)=url(网页地址)+lib() 第一部分:protocol:/ ...
- mysql 内置功能 视图 使用
#语法:CREATE VIEW 视图名称 AS SQL语句 增加了一张表 mysql> create view course2teacher as select * from course in ...