The open source JavaScript graphing library that powers Plotly
https://plot.ly/javascript/time-series/
https://plot.ly/javascript/
https://github.com/plotly/plotly.js
<!DOCTYPE html>
<html> <head>
<meta content="text/html; charset=utf-8" http-equiv="Content-Type" />
<title>Time Series in plotly.js</title>
<!-- Plotly.js -->
<script src="dist/plotly.min.js" type="text/javascript"></script>
</head> <body> <div id="myDiv"><!-- Plotly chart will be drawn inside this DIV --></div>
<script>
<!-- JAVASCRIPT CODE GOES HERE -->
Plotly.d3.csv("finance-charts-apple.csv", function(err, rows){ function unpack(rows, key) {
return rows.map(function(row) { return row[key]; });
} var trace1 = {
type: "scatter",
mode: "lines",
name: 'AAPL High',
x: unpack(rows, 'Date'),
y: unpack(rows, 'AAPL.High'),
line: {color: '#17BECF'}
} var trace2 = {
type: "scatter",
mode: "lines",
name: 'AAPL Low',
x: unpack(rows, 'Date'),
y: unpack(rows, 'AAPL.Low'),
line: {color: '#7F7F7F'}
} var data = [trace1,trace2]; var layout = {
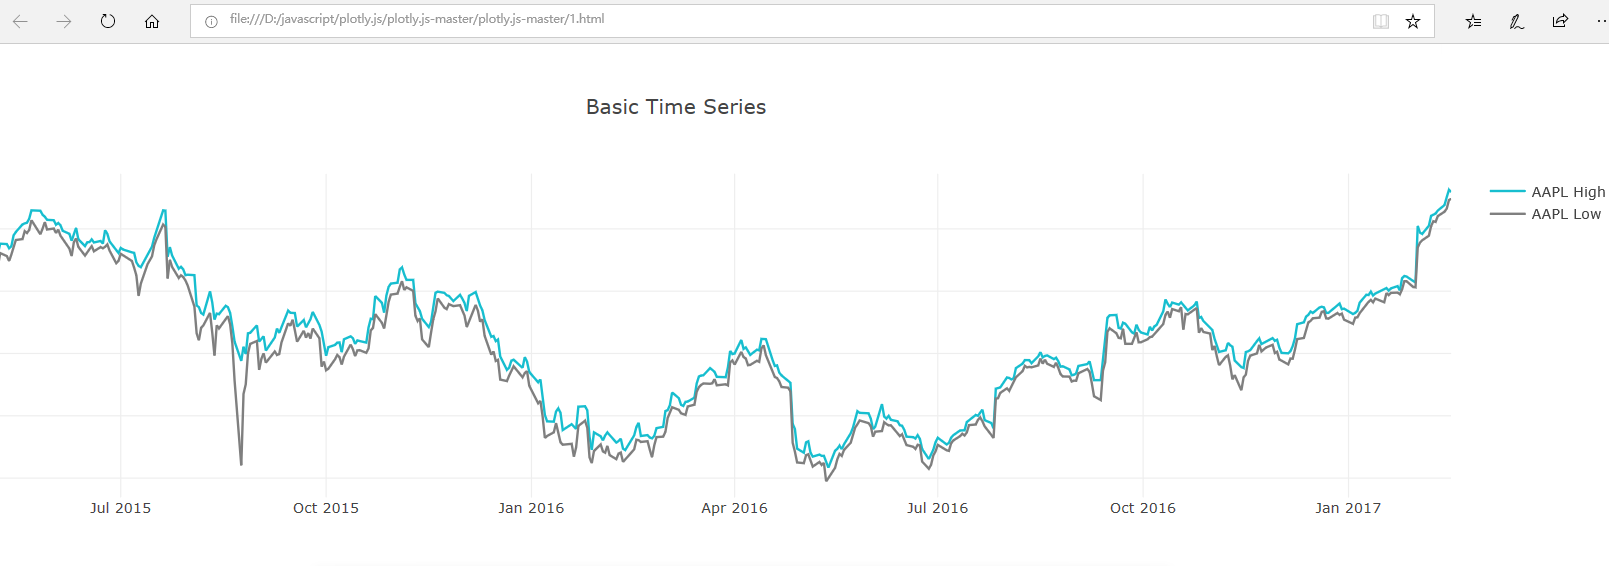
title: 'Basic Time Series',
}; Plotly.newPlot('myDiv', data, layout);
}) </script>
</body>
<!DOCTYPE html>

<html>

<head>

<meta content="text/html; charset=utf-8" http-equiv="Content-Type" />

<title>Time Series in plotly.js</title>

  <!-- Plotly.js -->

  <script src="dist/plotly.min.js" type="text/javascript"  charset="utf-8"></script>

    <script src="dist/plotly-locale-zh-cn.js" charset="utf-8" type="text/javascript"></script>

</head>

<body>

  <div id="myDiv"><!-- Plotly chart will be drawn inside this DIV --></div>

  <script>

    <!-- JAVASCRIPT CODE GOES HERE -->

Plotly.setPlotConfig({locale: 'zh-CN'})  //月份显示中文

Plotly.d3.csv("finance-charts-apple.csv", function(err, rows){

  function unpack(rows, key) {

  return rows.map(function(row) { return row[key]; });

}

var trace1 = {

  type: "scatter",

  mode: "lines",

  name: 'AAPL High',

  x: unpack(rows, 'Date'),

  y: unpack(rows, 'AAPL.High'),

  line: {color: '#17BECF'}

}

var trace2 = {

  type: "scatter",

  mode: "lines",

  name: 'AAPL Low',

  x: unpack(rows, 'Date'),

  y: unpack(rows, 'AAPL.Low'),

  line: {color: '#7F7F7F'}

}

var data = [trace1,trace2];

var layout = {

  title: 'Basic Time Series',

};

Plotly.newPlot('myDiv', data, layout,{locale: 'zh-CN'}); //

})

</script>

</body>

</html>
The open source JavaScript graphing library that powers Plotly的更多相关文章
- Select the JavaScript graphing libraries you would like to compare
Select the JavaScript graphing libraries you would like to compare: Overview Summary Fus ...
- c++ socket 客户端库 socks5 客户端 RudeSocket™ Open Source C++ Socket Library
介绍 一个c++ socket 客户端库 http://www.rudeserver.com/socket/index.html The RudeSocket™ Open Source C++ Soc ...
- Raphaël - JavaScript Vector Library
Raphaël http://dmitrybaranovskiy.github.io/raphael/ // ┌──────────────────────────────────────────── ...
- Open Source Computer Vision Library
https://opencv.org/ OpenCV (Open Source Computer Vision Library) is released under a BSD license and ...
- OpenCV(Open Source Computer Vision Library)计算机视觉库
OpenCV(最基本的滤波到高级的物体检测皆有涵盖) 简介: OpenCV 是跨平台的,可以在 Windows.Linux.Mac OS.Android.iOS 等操作系统上运行. OpenCV 的 ...
- Awesome Big Data List
https://github.com/onurakpolat/awesome-bigdata A curated list of awesome big data frameworks, resour ...
- 40 JavaScript Chart and Graph Libraries for Developers--reference
reference:http://www.egrappler.com/javascript-chart-and-graph-libraries-for-developers/ BY TEAMEGRAP ...
- 20+ Docs and Guides for Front-end Developers (No. 5)
It’s that time again to choose the tool or technology that we want to brush up on. If you feel like ...
- 13个JavaScript图表(JS图表)图形绘制插件【转】
现在网络上又有越来越多的免费的(JS 图表)JavaScript图表图形绘制插件.我之前给一家网站做过复杂的图形,我们用的是 highchart.在那段时间,没有很多可供选择的插件.但现在不同了,很容 ...
随机推荐
- 隐藏字符 BOM
如果您在修改任何PHP文件後发生: * 不能登入或者不能登出: * 页顶出现一条空白: * 页顶出现错误警告: * 其它不正常的情况. 则多半是编辑器的问题. 本程序采用UTF-8编码.现在几乎所 ...
- Docker集群管理工具 - Kubernetes 部署记录 (运维小结)
一. Kubernetes 介绍 Kubernetes是一个全新的基于容器技术的分布式架构领先方案, 它是Google在2014年6月开源的一个容器集群管理系统,使用Go语言开发,Kubernete ...
- redis之一初识redis
本文主要围绕以下几点进行阐述: 1.什么是redis? 2.为什么要使用redis呢? 3.redis的一些基本配置 4.redis的缺点? 正文: 1.什么是redis? Redis是一款内存高速缓 ...
- 2019-4-25 html学习笔记
一.概念 文本 用于储存和记录文字信息的载体 html 超文本标记语言(本质就是给文本增加语义 如<h1></h1>就是给文字添加一级标题的语义) 注:互联网三大基石 有 ...
- Web开发经验谈之F12开发者工具/Web调试[利刃篇]
引语:如今的整个Web开发行业甚至说整个软件开发行业,已经相当成熟,基本上已经很少找不到没有前人做过的东西了,或者换句话说,你想要实现的功能,你总能在某个地方搜索到答案,关键是你有没有这个时间精力去搜 ...
- SQL 的单引号转义字符
SQL 的转义字符是:'(单引号) 例:select * from user where name = '''06' 其中红色的单引号即表示转义字符,上例中 name的实际条件值为 '06,而不是 ' ...
- asp.net mvc 安全测试漏洞 "跨站点请求伪造" 问题解决
IBM Security Appscan漏洞筛查-跨站请求伪造,该漏洞的产生,有多种情况: 1.WebApi的跨站请求伪造,需要对WebApi的请求头部做限制(此文不做详细介绍): 2.MVC Act ...
- Python模块——HashLib与base64
摘要算法(hashlib) Python的hashlib提供了常见的摘要算法,如MD5,SHA1等等. 什么是摘要算法呢?摘要算法又称哈希算法.散列算法.它通过一个函数,把任意长度的数据转换为一个长度 ...
- [视频]K8飞刀 解密菜刀后门教程
链接:https://pan.baidu.com/s/1raC1S_njxeqS7TaiTN6jLA 提取码:otmb
- MySQL笔记(7)---事务
1.前言 前面具体讲了MySQL中的锁实现的方式,解释了是如何保证数据在并发情况下的可靠性,并提到了事务REPETABLE READ和READ COMMITTED,解释了一下这两种事务的不同.本章讲具 ...