
Prometheus 初探和配置(安装测试)
本文大纲:
• Prometheus 官⽹下载
• Prometheus 开始安装
• Prometheus 启动运⾏
• Prometheus 基本配置⽂件讲解
• 安装第⼀个exporter =》 node_exporter
• Prometheus 连接exporter获取数据
• Prometheus 命令⾏⼊门第⼀个查询公式
安装Prometheus之前 我们必须先安装ntp时间同步
(prometheus对系统时间的准确性要求很⾼,必须保证本机时间实时同步)
以Centos7 为例
~]# timedatectl set-timezone Asia/Shanghai

~]# contab -e

* * * * * ntpdate -u cn.pool.ntp.org
1) Prometheus下载
⾸先 我们去到http://prometheus.io 官⽹
下载最新版本 prometheus-2.2.1.linux-amd64.tar.gz
wget https://github.com/prometheus/prometheus/releases/download/v2.2.1/prometheus-2.2.1.linux-amd64.tar.gz
2) Prometheus的安装 ⾮常简单
[root@server01 download]# tar -xvzf prometheus-2.0.0.linux-amd64.tar.gz

prometheus-2.0.0.linux-amd64/

prometheus-2.0.0.linux-amd64/consoles/

prometheus-2.0.0.linux-amd64/consoles/index.html.example

prometheus-2.0.0.linux-amd64/consoles/node-cpu.html

prometheus-2.0.0.linux-amd64/consoles/node-disk.html

prometheus-2.0.0.linux-amd64/consoles/node-overview.html

prometheus-2.0.0.linux-amd64/consoles/node.html

prometheus-2.0.0.linux-amd64/consoles/prometheus-overview.html

prometheus-2.0.0.linux-amd64/consoles/prometheus.html

prometheus-2.0.0.linux-amd64/console_libraries/

prometheus-2.0.0.linux-amd64/console_libraries/menu.lib

prometheus-2.0.0.linux-amd64/console_libraries/prom.lib

prometheus-2.0.0.linux-amd64/prometheus.yml

prometheus-2.0.0.linux-amd64/LICENSE

prometheus-2.0.0.linux-amd64/NOTICE

prometheus-2.0.0.linux-amd64/prometheus

prometheus-2.0.0.linux-amd64/promtool

cp -rf prometheus-2.0.0.linux-amd64 /usr/local/prometheus
3) Prometheus 启动 和 后台运⾏
启动也很简单
~]# ./prometheus

level=info ts=2018-05-10T07:34:01.397792062Z caller=main.go:220 msg="Starting Prometheus" version="(version=2.2.1, branch=HEAD

, revision=bc6058c81272a8d938c05e75607371284236aadc)"level=info ts=2018-05-10T07:34:01.397842176Z caller=main.go:221 build_context="(go=go1.10, user=root@149e5b3f0829, date=201803

14-14:15:45)"level=info ts=2018-05-10T07:34:01.397855314Z caller=main.go:222 host_details="(Linux 3.10.0-327.el7.x86_64 #1 SMP Thu Nov 19 2

2:10:57 UTC 2015 x86_64 node1 (none))"level=info ts=2018-05-10T07:34:01.397868136Z caller=main.go:223 fd_limits="(soft=1024, hard=4096)"

level=info ts=2018-05-10T07:34:01.40145866Z caller=main.go:504 msg="Starting TSDB ..."

level=info ts=2018-05-10T07:34:01.416327032Z caller=web.go:382 component=web msg="Start listening for connections" address=0.0

.0.0:9090level=info ts=2018-05-10T07:34:01.795931346Z caller=main.go:514 msg="TSDB started"

level=info ts=2018-05-10T07:34:01.79597709Z caller=main.go:588 msg="Loading configuration file" filename=prometheus.yml

level=info ts=2018-05-10T07:34:01.847028303Z caller=main.go:491 msg="Server is ready to receive web requests."
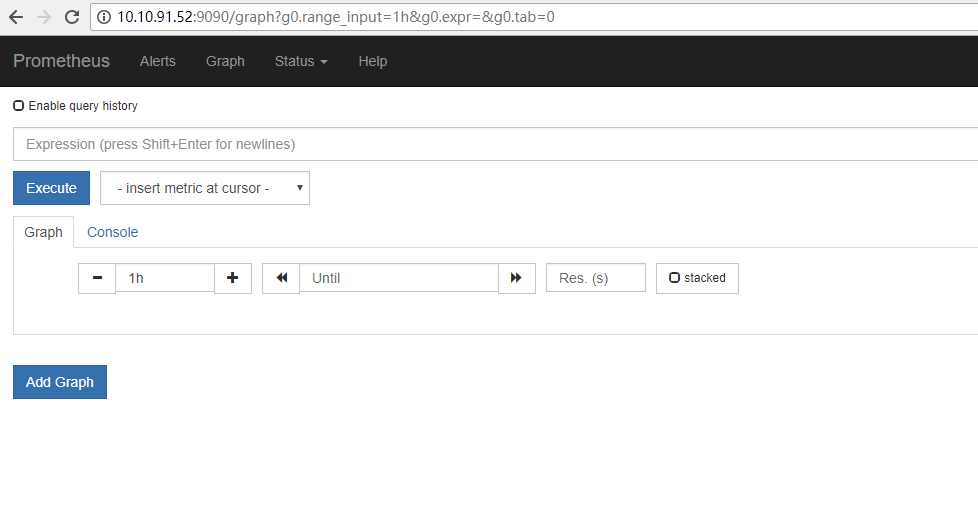
之后默认运⾏在 9090
浏览器可以直接打开访问⽆账号密码验证 (如果希望加上验证 ,可以使⽤类似apache httppass ⽅式添加)
4)接下来 我们来简单看⼀下 Prometheus的主配置⽂件
其实prometheus解压安装之后,就默认⾃带了⼀个基本的配置⽂件如下
prometheus.yml
我们来⼤致讲解⼀下配置⽂件的内容
# my global config

global:

scrape_interval: 15s # Set the scrape interval to every 15 seconds. Default is every 1 minute.

evaluation_interval: 15s # Evaluate rules every 15 seconds. The default is every 1 minute.

# scrape_timeout is set to the global default (10s).

前两个全局变量

scrape_interval. 抓取采样数据的 时间间隔, 默认 每15秒去被监控机上 采样⼀次 => 5s

这个就是我们所说的 prometheus的⾃定义 数据采集频率了

evaluation_interval. 监控数据规则的评估频率 grafana

这个参数是prometheus多长时间 会进⾏⼀次 监控规则的评估

举个例: 假如 我们设置 当 内存使⽤量 > 70%时 发出报警 这么⼀条rule(规则)

那么prometheus 会默认 每15秒来执⾏⼀次这个规则 检查内存的情况

# Alertmanager configuration

alerting:

alertmanagers:

- static_configs:

- targets:

# - alertmanager:9093

Alertmanager 是prometheus的⼀个⽤于管理和发出报警的 插件

我们这⾥对 Alertmanger 暂时先不做介绍 暂时也不需要 (我们采⽤ 4.0最新版的 Grafana , 本

⾝就已经⽀持报警发出功能了 往后我们会学习到)

再往后 从这⾥开始 进⼊prometheus重要的 配置采集节点的设置

# Here it's Prometheus itself.

scrape_configs:

# The job name is added as a label `job=<job_name>` to any timeseries scraped from this config.

- job_name: 'prometheus'

# metrics_path defaults to '/metrics'

# scheme defaults to 'http'.

static_configs:

- targets: ['localhost:9090']

先定义⼀个 job的名称
- job_name: 'prometheus'

然后定义监控节点 targets
static_configs:
  - targets: ['localhost:9090']

- targets的设定

以这种形式设定 默认带了⼀个 prometheus本机的

static_configs:

- targets: ['localhost:9090']

这⾥可以继续 扩展加⼊ 其他需要被监控的节点

如下是⼀个 ⽣产配置例⼦

- job_name: 'aliyun'

static_configs:

- targets: [‘server04:9100’,'IP:9100’,’nginx06:9100','web7:9100’,'redis1:9100','log:

9100','redis2:9100']

prometheuserver _ /etc/hosts, local_dns server

可以看到 targets可以并列写⼊ 多个节点

⽤逗号隔开, 机器名+端⼜号

端⼜号:通常⽤的就是 exporters 的端⼜

在这⾥ 9100 其实是 node_exporter 的默认端⼜

如此 prometheus就可以通过配置⽂件 识别监控的节点,持续开始采集数据

prometheus到此就算初步的搭建好了
5) 光搭建好prometheus_server 是不够的,我们需要给监控节点搭建第⼀个exporter ⽤来采样数据
我们就选⽤企业中最常⽤的 node_exporter 这个插件
node_exporter 是⼀个以http_server⽅式运⾏在后台,并且持续不断采集 Linux系统中各种操作系统本⾝相关的监控参数的程序
其采集量是很⼤很全的,往往默认的采集项⽬就远超过你的实际需求
接下来我们来看下 node_exporter是怎么回事
⼀样先下载node_exporter 从官⽹
wget https://github.com/prometheus/node_exporter/releases/download/v0.16.0-rc.3/node_exporter-0.16.0-rc.3.linux-amd64.tar.gz
下载之后解压缩然后直接运⾏即可
node_exporter的运⾏更加简单如下所示
~]# ./node_exporter

INFO[0000] Starting node_exporter (version=0.16.0-rc.3, branch=HEAD, revision=575d8950d367987ab8792e90fb2cf00c3fee1c10)  source="node_exporter.go:82"

INFO[0000] Build context (go=go1.9.5, user=root@d986ef46b6d6, date=20180427-15:51:15)  source="node_exporter.go:83"

INFO[0000] Enabled collectors:                           source="node_exporter.go:90"

INFO[0000]  - arp                                        source="node_exporter.go:97"

INFO[0000]  - bcache                                     source="node_exporter.go:97"

INFO[0000]  - bonding                                    source="node_exporter.go:97"

INFO[0000]  - conntrack                                  source="node_exporter.go:97"

INFO[0000]  - cpu                                        source="node_exporter.go:97"

INFO[0000]  - diskstats                                  source="node_exporter.go:97"

INFO[0000]  - edac                                       source="node_exporter.go:97"

INFO[0000]  - entropy                                    source="node_exporter.go:97"

INFO[0000]  - filefd                                     source="node_exporter.go:97"

INFO[0000]  - filesystem                                 source="node_exporter.go:97"

INFO[0000]  - hwmon                                      source="node_exporter.go:97"

INFO[0000]  - infiniband                                 source="node_exporter.go:97"

INFO[0000]  - ipvs                                       source="node_exporter.go:97"

INFO[0000]  - loadavg                                    source="node_exporter.go:97"

INFO[0000]  - mdadm                                      source="node_exporter.go:97"

INFO[0000]  - meminfo                                    source="node_exporter.go:97"

INFO[0000]  - netdev                                     source="node_exporter.go:97"

INFO[0000]  - netstat                                    source="node_exporter.go:97"

INFO[0000]  - nfs                                        source="node_exporter.go:97"

INFO[0000]  - nfsd                                       source="node_exporter.go:97"

INFO[0000]  - sockstat                                   source="node_exporter.go:97"

INFO[0000]  - stat                                       source="node_exporter.go:97"

INFO[0000]  - textfile                                   source="node_exporter.go:97"

INFO[0000]  - time                                       source="node_exporter.go:97"

INFO[0000]  - timex                                      source="node_exporter.go:97"

INFO[0000]  - uname                                      source="node_exporter.go:97"

INFO[0000]  - vmstat                                     source="node_exporter.go:97"

INFO[0000]  - wifi                                       source="node_exporter.go:97"

INFO[0000]  - xfs                                        source="node_exporter.go:97"

INFO[0000]  - zfs                                        source="node_exporter.go:97"

INFO[0000] Listening on :9100                            source="node_exporter.go:111"
运⾏起来以后 我们使⽤netstats -tnlp 可以来看下 node_exporter进程的状态
~]# netstat -tnlp | grep node

tcp6       0      0 :::9100                 :::*                    LISTEN      21886/./node_export
这⾥就可以看出 node_exporter默认⼯作在9100端⼜
可以响应 prometheus_server发过来的 HTTP_GET请求
也可以响应其他⽅式的 HTTP_GET请求
我们⾃⼰就可以发送 测试
执⾏curl之后,我们看到 node_exporter 给我们返回了 ⼤量的这种 metrics类型 K/V数据
~]# curl localhost:9100/metrics
关于 metrics 和 k/v 这里就不介绍了
⽽这些 返回的 K/V数据 ,其中的Key的名称就可以直接复制黏贴在prometheus的查询命令⾏来查看结果了
我们来试⼀试
就⽤这⼀项看看 node_memory_MemFree
# curl localhost:9100/metrics | grep node_memory_MemFree

  % Total    % Received % Xferd  Average Speed   Time    Time     Time  Current

                                 Dload  Upload   Total   Spent    Left  Speed

100 52834  100 52834    0     0  4765k      0 --:--:-- --:--:-- --:--:-- 5159k

# HELP node_memory_MemFree_bytes Memory information field MemFree_bytes.

# TYPE node_memory_MemFree_bytes gauge

node_memory_MemFree_bytes 7.376896e+07
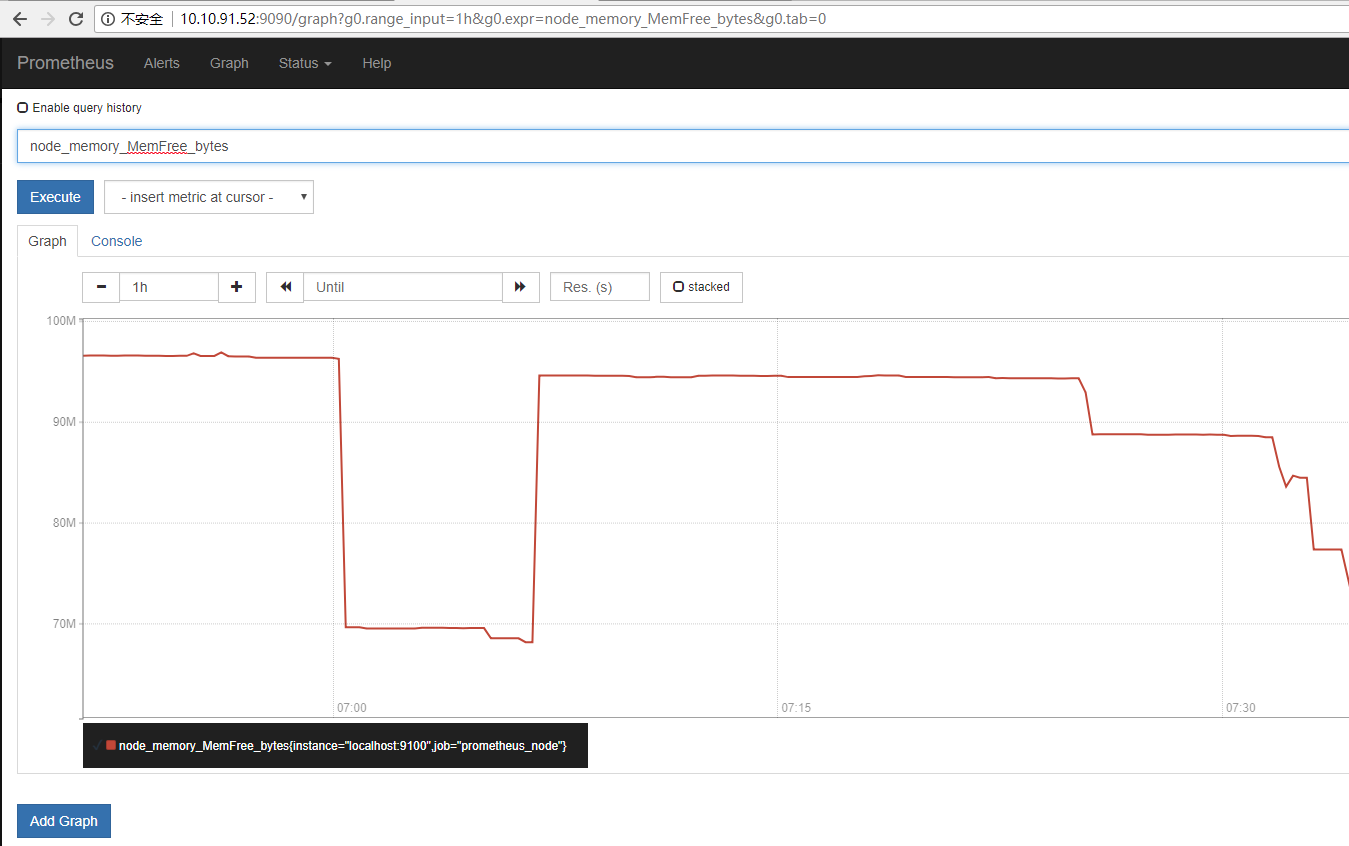
直接就可以看到曲线了
这个就是最简单的来查看⼀下服务器的空闲内存状态的⽅式
Prometheus 初探和配置(安装测试)的更多相关文章
- mycat配置安装测试
https://www.jianshu.com/p/26513f428ecf #下载安装#java jdk mkdir /usr/local/java/tar -zxvf jdk-7u80-linux ...
- mysql源码包手动安装、配置以及测试(亲测可行)
笔记编者:小波/qq463431476博客首页:http://www.cnblogs.com/xiaobo-Linux/ 记下这篇mysql笔记,望日后有用! redhat6采用centos yum源 ...
- 四步完成NodeJS安装,配置和测试
四步完成NodeJS安装,配置和测试 NodeJS 官网地址: http://nodejs.org/ 第一步:在官网点击 ’ INSTALL ’,下载相应的版本(我的机器是Win7专业版 64bit) ...
- WIN7环境下CUDA7.5的安装、配置和测试(Visual Studio 2010)
以下基于"WIN7(64位)+Visual Studio 2010+CUDA7.5". 系统:WIN7,64位 开发平台:Visual Studio 2010 显卡:NVIDIA ...
- ubuntu10.10 tftp安装,配置,测试
ubuntu10.10 tftp安装,配置,测试 成于坚持,败于止步 虽然ubuntu/centos/redhat都是linux,但是内核其中存在一定的修改,所以对于tftp服务器的安装存在不同的命令 ...
- Eclipse For JavaEE安装、配置、测试
Eclipse For JavaEE安装.配置.测试(win7_64bit) 目录 1.概述 2.本文用到的工具 3.安装与配置 4.JavaSE开发测试(确保JDK已正确安装) 5.JavaEE开发 ...
- Genymotion安卓模拟器和VirtualBox虚拟机安装、配置、测试
Genymotion安卓模拟器和VirtualBox虚拟机安装.配置.测试(win7_64bit) 目录 1.概述 2.本文用到的工具 3.VirtualBox虚拟机安装 4.Genymotion安卓 ...
- AndroidStudio安装、配置、测试
AndroidStudio安装.配置.测试(win7_64bit) 目录 1.概述 2.本文用到的工具 3.安装测试 4.模拟器安装.使用 5.常用配置 6.注事事项 7.相关博文 >>看 ...
- IntelliJ IDEA安装、配置、测试
IntelliJ IDEA安装.配置.测试(win7_64bit) 目录 1.概述 2.本文用到的工具 3.安装.激活与配置 4.开发测试 4.1 JavaSE开发测试(确保JDK已正确安装) 4.2 ...
随机推荐
- MySQL [ERROR] Table 'mysql.user' doesn't exist
问题描述: 在安装MYsql时,/etc/init.d/mysqld start时报错: [root@master data]# /etc/init.d/mysqld start Starting M ...
- <input type="image">表单提交2次 重复插入数据问题
写一个表单提交用到图片:两种代码. <input type="image" src="xxx.gif"onclick="return dosub ...
- 在.NET Core中使用Channel(一)
我最近一直在熟悉.net Core中引入的新Channel<T>类型.我想在它第一次发布的时候我了解过它,但是有关文章非常非常少,我不能理解它们与其他队列有什么不同. 在使用了一段时间后, ...
- springboot源码解析-管中窥豹系列之项目类型(二)
一.前言 Springboot源码解析是一件大工程,逐行逐句的去研究代码,会很枯燥,也不容易坚持下去. 我们不追求大而全,而是试着每次去研究一个小知识点,最终聚沙成塔,这就是我们的springboot ...
- vue 侦听器watch 之 深度监听 deep
<template> <div> <p>FullName: {{person.fullname}}</p> <p>FirstName: &l ...
- JavaFX之班级未交作业统计
前言 最近转移了系统平台,用上了Ubuntu1804版本系统,原来用C#写的Windows窗体软件也不能用了,而且自己在班级上每周都需要收作业,所以写了这个软件.这篇博客主要记录这个JavaFX应用的 ...
- 【ORACLE】11g rac+dg
首先感谢群友分享的文档,在这里先感谢哆啦B梦,非常感谢 该文档主要指导如何利用现有的RAC环境搭建一套RAC与单实例的DG的环境 ============================主机配置信息 ...
- SpringBoot Logback无法获取配置中心属性
SpringBoot Logback无法获取配置中心属性 前言 最近在做项目中,需要把项目中的日志信息通过RabbitMQ将规定格式的消息发送到消息队列中,然后ELK系统通过消息队列拿日志并且保存起来 ...
- 洛谷P3275 [SCOI2011]糖果(差分约束)
题目描述 幼儿园里有 $N$ 个小朋友,$lxhgww $老师现在想要给这些小朋友们分配糖果,要求每个小朋友都要分到糖果.但是小朋友们也有嫉妒心,总是会提出一些要求,比如小明不希望小红分到的糖果比他的 ...
- 绝对定位上下左右都为0 margin为auto为什么能居中
老规矩,先来一段废话,我大学刚入门的时候觉得CSS很简单,记一记就会了,不就是盒模型嘛,现在想来觉得自己那时候真的很自以为是哈哈.但是随着工作沉淀,我明白了任何技术都有着它的深度和广度,正是因为不少人 ...