
[Python] Histograms for analysis Daily return
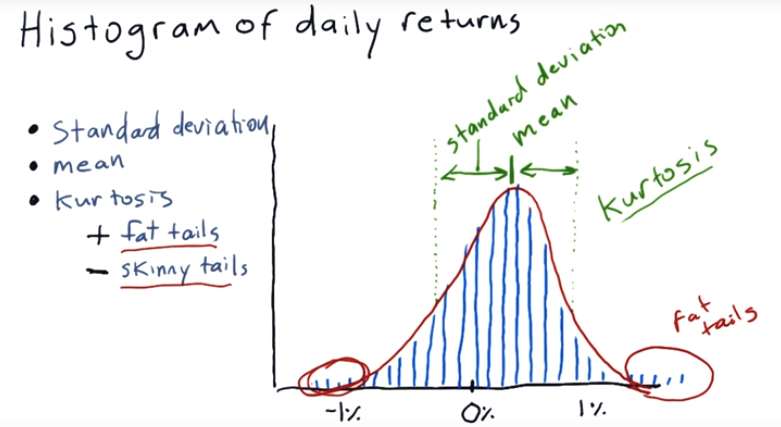
A histogram is an accurate representation of the distribution of numerical data.

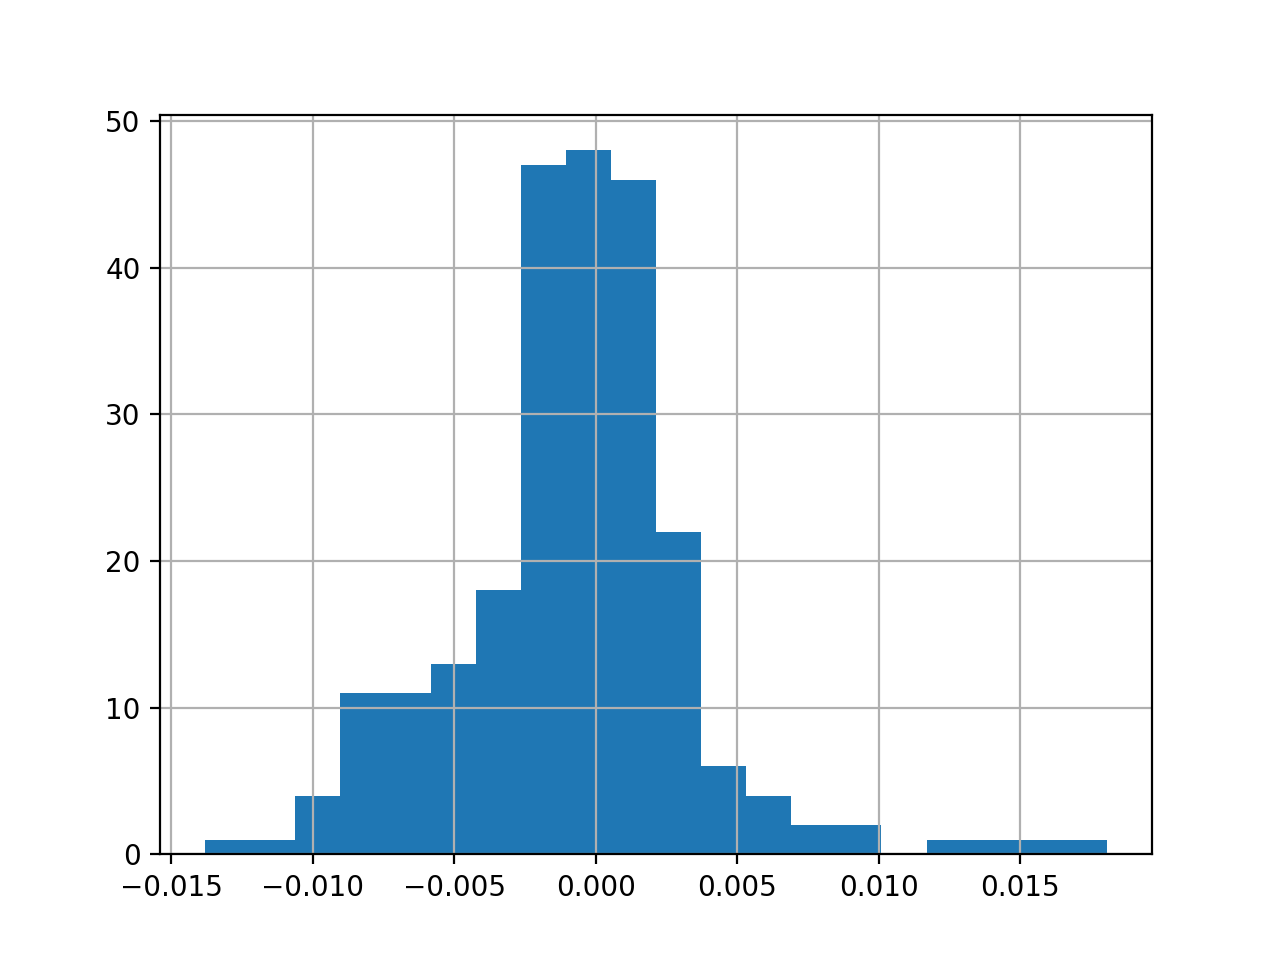
Y axis is the occurances, X axis is the % of daily return.
There are three things can meature histogram
1. Standard deviation
2. Mean
3. Kurtosis : In probability theory and statistics, kurtosis is a measure of the "tailedness" of the probability distribution of a real-valued random variable.
Plot a histogram:
import os

import pandas as pd

import matplotlib.pyplot as plt

def compute_daily_return(df):

    dr = df.copy()

    dr = (df / df.shift(-1)) -1

    return dr

def histogram(df):

    dr = compute_daily_return(df)

    plot_data(dr, title="Daily returns", yLabel="Daily returns")

    dr.hist(bins=20)

    plt.show()

if __name__ == '__main__':

    df=test_run()

    #rolling_mean(df)

    histogram(df['SPY'])

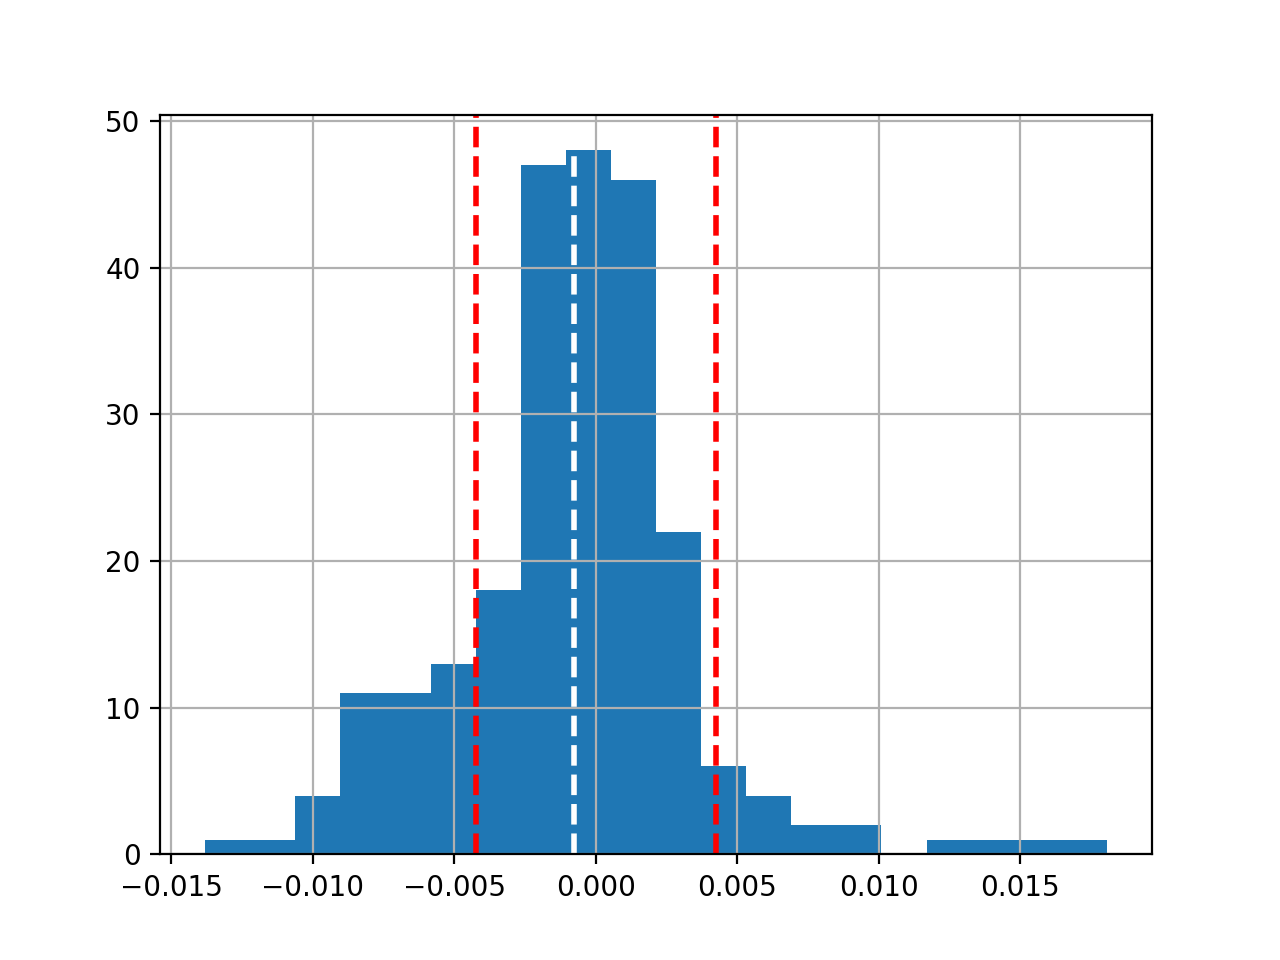
Plot 'mean' and 'std', Get 'kurtosis' value as well:
def histogram(df):

    dr = compute_daily_return(df)

    plot_data(dr, title="Daily returns", yLabel="Daily returns")

    dr.hist(bins=20)

    # Get mean and standard deviation

    mean = dr.mean()

    print("mean=", mean)

    std = dr.std()

    print("std=", std)

    plt.axvline(mean, color='w', linestyle='dashed', linewidth=2)

    plt.axvline(std, color='r', linestyle='dashed', linewidth=2)

    plt.axvline(-std, color='r', linestyle='dashed', linewidth=2)

    plt.show()

    # Get kurtosis

    print("kurtosis=", dr.kurtosis())

if __name__ == '__main__':

    df=test_run()

    histogram(df['SPY'])
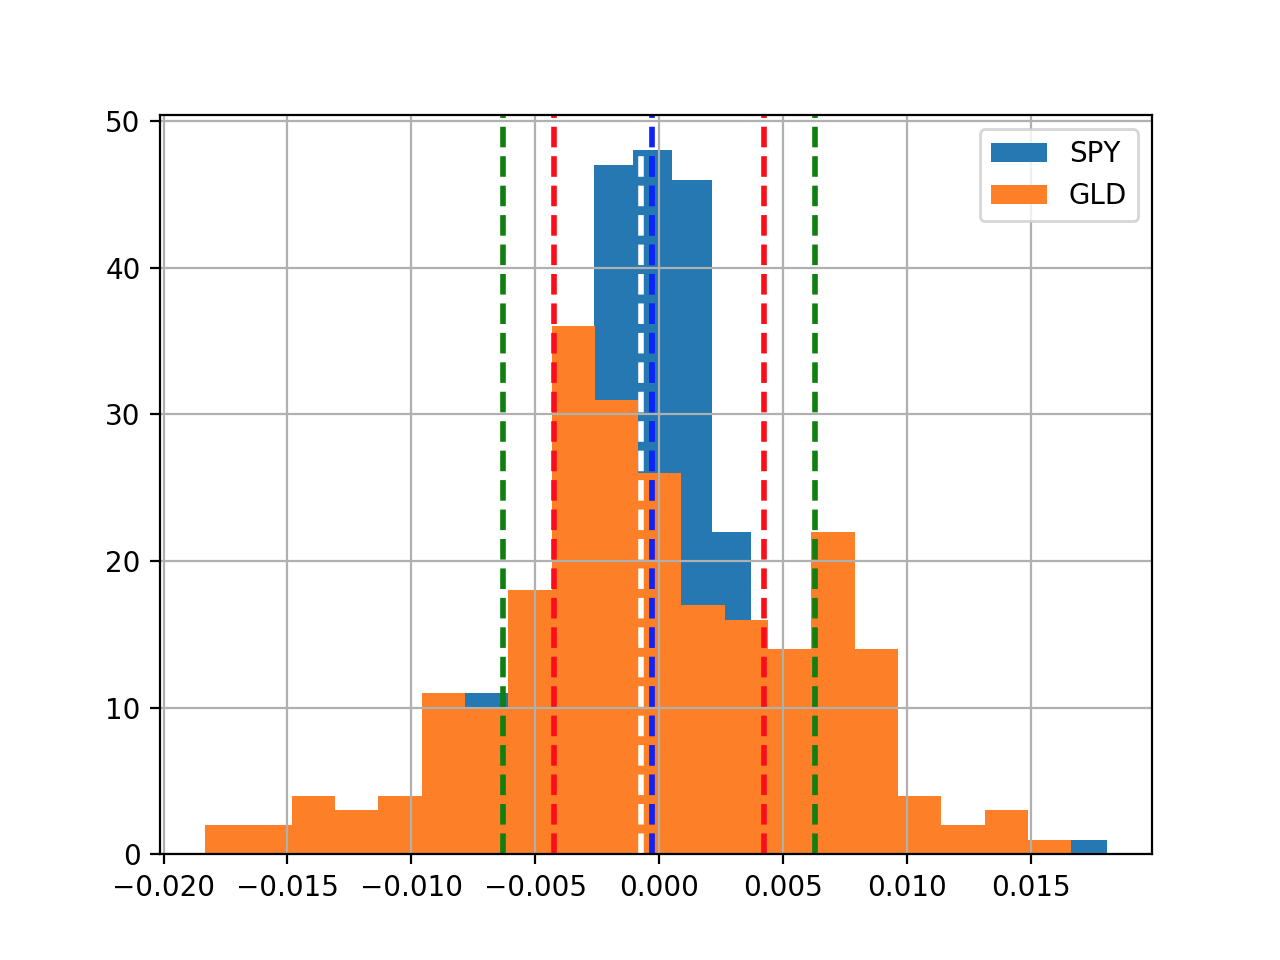
Now, let see how to plot tow histgram in the same plot:
def histogram(df):

    dr = compute_daily_return(df)

    plot_data(dr, title="Daily returns", yLabel="Daily returns")

    dr['SPY'].hist(bins=20, label="SPY")

    dr['GLD'].hist(bins=20, label="GLD")

    plt.legend(loc='upper right')

    # Get mean and standard deviation

    mean_spy = dr['SPY'].mean()

    mean_gld = dr['GLD'].mean()

    std_spy = dr['SPY'].std()

    std_gld = dr['GLD'].std()

    plt.axvline(mean_spy, color='w', linestyle='dashed', linewidth=2)

    plt.axvline(std_spy, color='r', linestyle='dashed', linewidth=2)

    plt.axvline(-std_spy, color='r', linestyle='dashed', linewidth=2)

    plt.axvline(mean_gld, color='b', linestyle='dashed', linewidth=2)

    plt.axvline(std_gld, color='g', linestyle='dashed', linewidth=2)

    plt.axvline(-std_gld, color='g', linestyle='dashed', linewidth=2)

    plt.show()

if __name__ == '__main__':

    df=test_run()

    histogram(df[['SPY', 'GLD']])
[Python] Histograms for analysis Daily return的更多相关文章
- [Python] Scatter Plot for daily return
Sploe = 2: means that SPY move up 1, ABC move up 2 Correlation: how close those dots close to the li ...
- 数据分析---《Python for Data Analysis》学习笔记【03】
<Python for Data Analysis>一书由Wes Mckinney所著,中文译名是<利用Python进行数据分析>.这里记录一下学习过程,其中有些方法和书中不同 ...
- 《python for data analysis》第九章,数据聚合与分组运算
# -*- coding:utf-8 -*-# <python for data analysis>第九章# 数据聚合与分组运算import pandas as pdimport nump ...
- 数据分析---《Python for Data Analysis》学习笔记【04】
<Python for Data Analysis>一书由Wes Mckinney所著,中文译名是<利用Python进行数据分析>.这里记录一下学习过程,其中有些方法和书中不同 ...
- 数据分析---《Python for Data Analysis》学习笔记【02】
<Python for Data Analysis>一书由Wes Mckinney所著,中文译名是<利用Python进行数据分析>.这里记录一下学习过程,其中有些方法和书中不同 ...
- 数据分析---《Python for Data Analysis》学习笔记【01】
<Python for Data Analysis>一书由Wes Mckinney所著,中文译名是<利用Python进行数据分析>.这里记录一下学习过程,其中有些方法和书中不同 ...
- 《python for data analysis》第十章,时间序列
< python for data analysis >一书的第十章例程, 主要介绍时间序列(time series)数据的处理.label:1. datetime object.time ...
- 《python for data analysis》第七章,数据规整化
<利用Python进行数据分析>第七章的代码. # -*- coding:utf-8 -*-# <python for data analysis>第七章, 数据规整化 imp ...
- 《python for data analysis》第五章,pandas的基本使用
<利用python进行数据分析>一书的第五章源码与读书笔记 直接上代码 # -*- coding:utf-8 -*-# <python for data analysis>第五 ...
随机推荐
- 如何让iframe背景色透明框架页文件设置
如何让iframe背景色透明框架页文件设置:<body style="background-color:transparent" > 或 <body bgColo ...
- 算法38---292. Nim游戏
1.题目: 你和你的朋友,两个人一起玩 Nim游戏:桌子上有一堆石头,每次你们轮流拿掉 1 - 3 块石头. 拿掉最后一块石头的人就是获胜者.你作为先手. 你们是聪明人,每一步都是最优解. 编写一个函 ...
- 《剑指Offer》——试题1:赋值运算符函数
题目:如下类型为CMyString的声明,请为该类型添加赋值运算符函数. class CMyString { public: CMyString(char* pData = NULL); CMyS ...
- CloudStack云基础架构的一些概念
1. Zones(区域) 一个区域在CloudStack配置中是最大的组织单元.一个区域通常代表一个单独的数据中心,虽然在一个数据中心也允许有多个区域.将基础架构设施加入到区域中的好处是提供物理隔离和 ...
- Python学习笔记-练习编写ATM+购物车(购物商城)
作业需求: 模拟实现一个ATM + 购物商城程序: 1.额度 15000或自定义 2.实现购物商城,买东西加入 购物车,调用信用卡接口结账 3.可以提现,手续费5% 4.支持多账户登录 5.支持账户间 ...
- iOS_第3方类库_側滑选项卡SlideSwitchView
终于效果: 用法: 1.在主控制器中创建一个[SlideSwitchView]的对象实例,并用成员变量记住,如_slideSwitchView,并加入到self.view 2.设置[_slideSwi ...
- Linux系统编程——进程间通信:共享内存
概述 url=MdyPihmS_tWLwgWL5CMzaTrwDFHu6euAJJUAjKvlzbJmRw7RfhmkBWwAloo7Y65hLY-kQdHsbqWYP2wc2fk8yq"& ...
- Innosetup
卸载的同时删除日志,卸载的时候判断程序是否正在运行,regsvr32 1.卸载程序的时候如何判断程序是否正在运行 http://bbs.csdn.net/topics/370097914 2.强制删除 ...
- 8.queue
#include <iostream> #include <stack> #include <algorithm> #include <list> #i ...
- The evolution of cluster scheduler architectures--转
原文地址:http://www.firmament.io/blog/scheduler-architectures.html cluster schedulers are an important c ...