
Performing a thread dump in Linux or Windows--reference
Linux/Unix
1. Find the Java/Tomcat process id.
% ps ax | grep java
You should see output like this
17207 ? Sl 78:36 /usr/java/default/bin/java -Djava.util.logging.config.file=/usr/tomcat/tomcat6/conf/logging.properties -Djava.util.logging.manager=org.apache.juli.ClassLoaderLogManager -Xmx1024M -Xms128M -XX:MaxPermSize=256M -Djava.awt.headless=true -Djava.endorsed.dirs=/usr/tomcat/tomcat6/endorsed -classpath :/usr/tomcat/tomcat6/bin/bootstrap.jar -Dcatalina.base=/usr/tomcat/tomcat6 -Dcatalina.home=/usr/tomcat/tomcat6 -Djava.io.tmpdir=/usr/tomcat/tomcat6/temp org.apache.catalina.startup.Bootstrap start
2. Execute the following command to generate a thread dump
% kill -3 <pid>
Run this command every 5-10 seconds, 5 times.
3.The thread dump is written to the standard output. It may logged in the console or <tomcat>/logs/stdout or <tomcat>/logs/catalina.out.
4. If you are running JDK 6.0+, you may also use jstack to produce a thread dump.
 % jstack -l <pid> > threaddump.txt

  or

 % jstack <pid> > threaddump.txt
Windows
Running as a Windows service
1a. If installed using Tomcat installer, click All Programs ->Apache Tomcat 6.0->Monitor Tomcat. An icon should appear in task bar.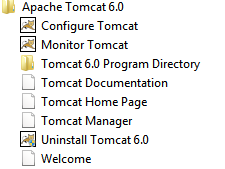
1b. If not installed using Tomcat installer, navigate to <tomcat>/bin, and run the following command
% tomcat7.exe //MS//Tomcat7
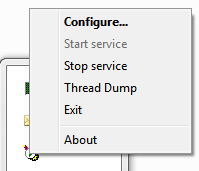
The Tomcat monitor icon should appear in the system tray.;
2. Right click the the icon and select Thread Dump.
Run this command every 5-10 seconds, 5 times
3. Look for the thread dump in <tomcat>/logs/stdout or <tomcat>/logs/catalina.out.
Running from startup.bat
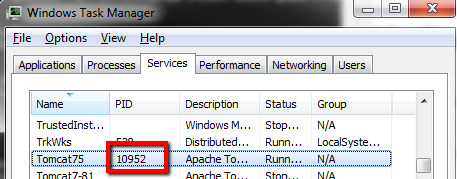
1. Open "Windows Task Manager",
2. Find the process ID of the java process
3. Make sure <JDK>/bin is in your command path. Otherwise, navigate to <JDK>/bin
4. Execute the following command to generate a thread dump
% jstack -l <pid> > threaddump.txt
Run this command every 5-10 seconds, 5 times
If you receive an error running jstack such as the below, then you may need to use psexec:
7988: Insufficient memory or insufficient privileges to attach
The -F option can be used when the target process is not responding

.png)
.png)

.png)
Run this command every 5-10 seconds, 5 times
You can also add the full path of your Java 'bin' directory to the server's system path variable. The Java 'bin' directory is usually in 'Program Files\Java\bin\jdk<version>\bin'. If you add this path to the system variable then you will need to restart the command prompt again for the change to be picked up and the 'jstack' command to work.
Performing a thread dump in Linux or Windows--reference的更多相关文章
- 013-程序性能分析之thread dump和heap dump
一.dump基本概念 主要用于故障定位(尤其是out of memory)和性能分析.主要记录了JVM运行期间的内存占用.线程执行等情况,这就是常说的dump文件.常用的有heap dump和thre ...
- 性能分析之-- JAVA Thread Dump 分析综述
性能分析之-- JAVA Thread Dump 分析综述 一.Thread Dump介绍 1.1什么是Thread Dump? Thread Dump是非常有用的诊断Java应用问题的工 ...
- [转]Java Thread Dump 性能分析
Java and Thread 一个 web 服务器使用几十到几百个线程来处理大量并发用户,如果一个或多个线程使用相同的资源,线程之间的竞争就不可避免了,并且有时候可能会发生死锁. Thread co ...
- thread dump
最近在做性能测试,需要对线程堆栈进行分析,在网上收集了一些资料,学习完后,将相关知识整理在一起,输出文章如下. 一.Thread Dump介绍 1.1什么是Thread Dump? Thread Du ...
- 如何抓取Thread Dump小结(转)
当系统性能出现问题时,需要从各个方面来查看网络环境.主机资源.查看最经变更的代码等.如果是想从代码层面解决问题,那么最有效的方法就是查看相关dump文件.如果是使用IBM JDK(我默认你是在aix环 ...
- Thread Dump 和Java应用诊断(转)
Thread Dump 和Java应用诊断 Thread Dump是非常有用的诊断Java应用问题的工具,每一个Java虚拟机都有及时生成显示所有线程在某一点状态的thread-dump的能力.虽然各 ...
- java程序性能分析之thread dump和heap dump
一.dump基本概念 在故障定位(尤其是out of memory)和性能分析的时候,经常会用到一些文件来帮助我们排除代码问题.这些文件记录了JVM运行期间的内存占用.线程执行等情况,这就是我们常说的 ...
- java jvm heap dump及 thread dump分析
一.概念: 在进行java应用故障分析时,经常需要分析内存和cpu信息,也就说所谓的heap dump 和 thread dump heap dump: heap dump文件是一个二进制文件,需要工 ...
- [JAVA]JAVA章4 Thread Dump如何分析
一.Thread Dump介绍 1.1什么是Thread Dump? Thread Dump是非常有用的诊断Java应用问题的工具.每一个Java虚拟机都有及时生成所有线程在某一点状态的thread- ...
随机推荐
- bzoj 2251: [2010Beijing Wc]外星联络 后缀数组
2251: [2010Beijing Wc]外星联络 Time Limit: 30 Sec Memory Limit: 256 MBSubmit: 424 Solved: 232[Submit][ ...
- phpstorm 强大的活动模板 可以自定义注释,代码段,根据cms订制自动提示
http://jingyan.baidu.com/article/8275fc86badd6346a03cf6aa.html [PHP] phpstorm的使用(1) http://v.youku.c ...
- xapian安装
xapian安装:$ su enter your root password # rpm -ivh http://rpm.eprints.org/rpm-eprints-org-key-1-1.noa ...
- Learing WCF Chapter1 Fundamental WCF Concepts
At its core,WCF is a development platform for service-oriented applications. As I mentioned earlier, ...
- Centos6.5 安装Vim7.4
系统本身会带Vim7.2都版本,其实也够用,强迫症患者可以按以下操作升级成Vim7.4: (1)切换到root权限 (2)卸载 rpm -qa | grep vim yum remove vim vi ...
- ELK之nginx日志分析图表创建
一.kibana面板介绍 Discover:查询数据Visualize:统计图表Dashboard:显示面板,添加相应的图表在面板中Settings:创建索引 二.图表创建 1.饼图创建 以创建一个状 ...
- sharepoint 2010 如何使用sharepoint多媒体视频播放media webpart功能
转:http://www.cfanz.cn/?c=article&a=read&id=40449 在sharepoint 2010中,有一个新的功能,支持在页面上播放视频.主要是通过一 ...
- AppScan修复漏洞:启用不安全的HTTP方法
最近对于系统使用Appscan扫描出中危漏洞“启用不安全的HTTP方法,找了很多修复方法都不能达到效果. 漏洞截图: 漏洞描述: 危险级别 中危险 影响页面 整个WEB页面. 简短描述 管 ...
- Git push 时每次都需要密码的疑惑
2015.1.13更新: 在本地搭建Git服务器时,也是有每次操作需要密码的情况. 是因为每次做推送动作时,Git需要认证你是好人.所以需要密码. 可以在 /home/username/.ssh/au ...
- Linux创建新用户以及useradd adduser的区别
从阿里云那弄了个机子玩玩,系统用的是Ubuntu12.04.刚等上去时候是用root登录的,首先想到的就是创建一个用户. 使用 useradd myname 发现/home目录下没有myname的家目 ...