
提高.net程序性能和稳定性-CLR Profile
CLR Profile能够看到应用程序的内存堆栈情况并且能够查询垃圾回收机制的行为。利用CLR Profile可以确定你的代码哪儿分配了太多内存,从而导致垃圾回收机制的执行,哪些代码长时间的占有内存。不过CLR Profile不适合在生产环境下使用,因为如果用它,会使你的应用程序的性能下降10倍甚至100倍。
请从http://download.microsoft.com/download/4/4/2/442d67c7-a1c1-4884-9715-803a7b485b82/clr%20profiler.exe下载CLR Profile
CLR Profile 可以做:
- 查看托管堆上的对象
- 查看托管堆中存活的对象
- 谁引用了托管堆上的对象
- 垃圾回收机制在整个应用程序的生命周期内都做了什么
| View | Description |
|---|---|
| Histogram Allocated Types | Gives you a high-level view of what object types are allocated (by allocation size) during the lifetime of your application. This view also shows those objects that are allocated in the large object heap (objects larger than 85 KB).
This view allows you to click parts of the graph so that you can see which methods allocated which objects. |
| Histogram Relocated Types | Displays the objects that the garbage collector has moved because they have survived a garbage collection. |
| Objects By Address | Provides a picture of what is on the managed heap at a given time. |
| Histogram By Age | Allows you to see the lifetime of the objects on the managed heap. |
| Allocation Graph | Graphically displays the call stack for how objects were allocated. You can use this view to:
-See the cost of each allocation by method. -Isolate allocations that you were not expecting. -View possible excessive allocations by a method. |
| Assembly, Module, Function, and Class Graph | These four views are very similar. They allow you to see which methods pulled in which assemblies, functions, modules, or classes. |
| Heap Graph | Shows you all of the objects in the managed heap, along with their connections. |
| Call Graph | Lets you see which methods call which other methods and how frequently.
You can use this graph to get a feel for the cost of library calls and to determine how many calls are made to methods and which methods are called. |
| Time Line | Displays what the garbage collector does over the lifetime of the application. Use this view to:
-Investigate the behavior of the garbage collector. -Determine how many garbage collections occur at the three generations (Generation 0, 1, and 2) and how frequently they occur. -Determine which objects survive garbage collection and are promoted to the next generation. You can select time points or intervals and right-click to show who allocated memory in the interval. |
| Call Tree View | Provides a text-based, chronological, hierarchical view of your application's execution. Use this view to:
-See what types are allocated and their size. -See which assemblies are loaded as result of method calls. -Analyze the use of finalizers, including the number of finalizers executed. -Identify methods where Close or Dispose has not been implemented or called, thereby causing a bottleneck. -Analyze allocations that you were not expecting. |
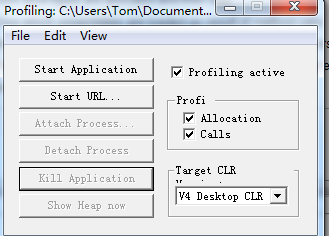
启动CLR Profile
- using System;
- using System.Collections.Generic;
- using System.Linq;
- using System.Text;
- namespace ConsoleApplication2
- {
- class Program
- {
- static void Main(string[] args)
- {
- string str = "";
- DateTime begin = DateTime.Now;
- for (int i = 0; i < 10000; ++i)
- str += i;
- DateTime end = DateTime.Now;
- Console.WriteLine(begin - end);
- }
- }
- }


- using System;
- using System.Collections.Generic;
- using System.Linq;
- using System.Text;
- using System.Drawing;
- namespace ConsoleApplication2
- {
- class Program
- {
- static void Main(string[] args)
- {
- int start = Environment.TickCount;
- for (int i = 0; i < 100 * 1000; i++)
- {
- Brush b = new SolidBrush(Color.Black); // Brush has a finalizer
- string s = new string(' ', i % 37);
- // Do something with the brush and the string.
- // For example, draw the string with this brush - omitted...
- }
- Console.WriteLine("Program ran for {0} seconds",
- 0.001 * (Environment.TickCount - start));
- }
- }
- }
这段代码分配了100000个SolidBrush和一些string,导致了总共分配了大约9M内存。通过以下(第一幅是总得,第二副是回收后的)两图比较可以看出最后剩余的内存很大部分是SolidBrush,大部分String对象都被回收。也就是说存活的对象都被提高到更高的代。


提高.net程序性能和稳定性-CLR Profile的更多相关文章
- 一个用于每一天JavaScript示例-使用缓存计算(memoization)为了提高应用程序性能
<!DOCTYPE html> <html> <head> <meta http-equiv="Content-Type" content ...
- 提高WPF程序性能的几条建议
这篇博客将介绍一些提高WPF程序的建议(水平有限,如果建议有误,请指正.) 1. 加快WPF程序的启动速度: (1).减少需要显示的元素数量,去除不需要或者冗余的XAML元素代码. (2).使用UI虚 ...
- 用 Function.apply() 的参数数组化来提高 JavaScript程序性能
我们再来聊聊Function.apply() 在提升程序性能方面的技巧. 我们先从 Math.max() 函数说起, Math.max后面可以接任意个参数,最后返回所有参数中的最大值. 比如 aler ...
- 使用BOOST BIND库提高C++程序性能
Boost.Bind为函数和函数对象,值语义和指针提供语义了一致的语法.我们首先通过一些简单的例子来看看它的基本用法,之后我们会延伸到嵌套绑定以实现功能组合.理解bind用法的一个关键是理解占位符(p ...
- 提高ASP.NET应用程序性能的十大方法
一.返回多个数据集 检查你的访问数据库的代码,看是否存在着要返回多次的请求.每次往返降低了你的应用程序的每秒能够响应请求的次数.通过在单个数据库请求中返回多个结果集,可以减少与数据库通信的时间,使你的 ...
- asp.net提高程序性能的技巧(一)
[摘 要] 我只是提供我几个我认为有助于提高写高性能的asp.net应用程序的技巧,本文提到的提高asp.net性能的技巧只是一个起步,更多的信息请参考<Improving ASP.NET Pe ...
- 【翻译】七个习惯提高Python程序的性能
原文链接:https://www.tutorialdocs.com/article/7-habits-to-improve-python-programs.html 掌握一些技巧,可尽量提高Pytho ...
- 如何提高NodeJS程序的运行的稳定性
如何提高NodeJS程序运行的稳定性 我们常通过node app.js方式运行nodejs程序,但总有一些异常或错误导致程序运行停止退出.如何保证node程序的稳定运行? 下面是一些可以考虑的方案: ...
- 提高ASP.net性能的十种方法
提高ASP.net性能的十种方法 2014-10-24 空城66 摘自 博客园 阅 67 转 1 转藏到我的图书馆 微信分享: 今天无意中看了一篇关于提高ASP.NET性能的文章,个人 ...
随机推荐
- xss学习教程
XSS漏洞详细分析与讲解.rar xss黑白盒渗透测试.pdf xss基础钓鱼-shgcx.com.zip XSS利用教程-shgcx.com.zip xss盲打渗透网站.doc XSS挖掘.ppt ...
- 二、ELKStack集群架构设计
一.ELKStack介绍与入门实践 二.Elasticsearch 集群架构图 服务器配置:Centos6.6 x86_64 CPU:1核心 MEM:2G (做实验,配置比较低一些) 注:这里配置el ...
- JS夯实基础:Javascript 变态题解析 (上)
["].map(parseInt) 1.知识点: Array/map Number/parseInt Global_Objects/parseInt JavaScript parseInt ...
- Linux内核源码情景分析-系统调用
一.系统调用初始化 void __init trap_init(void) { ...... set_system_gate(SYSCALL_VECTOR,&system_call);//0x ...
- JNI_Android项目中调用.so动态库
JNI_Android项目中调用.so动态库 2014年6月3日 JNI学习 參考:http://blog.sina.com.cn/s/blog_4298002e01013zk8.html 上一篇笔者 ...
- 【Web】前台传送JSON格式数据到后台Shell处理
1.js中的json对象和字符串之间的转化:http://www.oschina.net/code/snippet_175925_6288 代码片段: var obj = JSON.parse(des ...
- ShopNC B2B2C多用户商城2014商业版,带微商城
据说价值7000RMB,咱们好站长资源网友分享出来的,非常感谢分享这么好的源码.此套ShopNC B2B2C多用户商城源码是2014版的,带有微商城,源码我们安装测试基本没发现啥问题,这两天将会完全免 ...
- C# Meta Programming - Let Your Code Generate Code - Introduction of The Text Template Transformation Toolkit(T4)
<#@ template language="C#" #> <#@ output extension=".cs" #> <#@ a ...
- vue - static(.gitkeep)
描述:git上传忽略的文件,与.gitnoignore一样.
- Unity AssetServer小笔记
普及一下Asset Server知识: Unity的Asset Server,其实就是一个纯PostgreSQL数据库.Unity操作Asset Server,就是一个数据库客户端操作,但是Unity ...