
jmeter --- 监控器 Plugins (&jconsole)
jmeter --- 监控器 Plugins (&jconsole)
Jmeter本身没有监控服务器资源的功能,需要添加额外插件
一、监控原理图

二、Jmeter-Plugs下载和安装
- 官网上下载JMeterPlugins: http://www.jmeter-plugins.org/
- 解压之后放到安装目录下(如我的安装路径如下:D:\apache-jmeter-2.13\lib\ext)
- 运行Jmeter打开监视器的菜单,超多个监视器映入眼帘

三、PerfMonAgent的下载和安装
PerfMonAgent下载网址http://www.jmeter-plugins.org/downloads/all/
安装文档见http://www.jmeter-plugins.org/wiki/PerfMonAgent/
PerfMon Server Agent
Installation
You do not need any root/admin privilege. You can just unzip the the ServerAgent-X.X.X.zip somewhere on the server. Then launch the agent using startAgent.shscript on Unix, or startAgent.bat script on Windows.
The agent is written in Java, so you will need JRE 1.4+ to run it. Note you can create yourself the agent package which includes its own JRE so you don't have to install java on the server (We tested it on windows platform). To do this, just create a JRE folder in the agent folder and copy one installed JRE inside. Change the java command inside the .bat file to the path to the java executable and it will work.
Once the agent is running, you can use the PerfMon Metrics Collector Listener to connect to the agents. You can add multiple servers to monitor, one graph can display several kinds of metrics (cpu, memory, etc...), auto-zooming rows for best view.
Usage
To start the agent, simply run startAgent bat/sh file. It will open UDP/TCP server ports where JMeter will connect and query the metrics. Some information will be printed to standard output, informing you on problems gathering metrics (logging verbosity regulated with --loglevel parameter).
You can specify the listening ports as arguments (0 disables listening), default is 4444:
$ ./startAgent.sh --udp-port 0 --tcp-port 3450

INFO    2011-11-25 19:02:14.315 [kg.apc.p] (): Binding TCP to 3450
You can use the --auto-shutdown option when starting the agent to automatically stop it once the test is finished. It is recommended to use this feature only with TCP connections:
$ undera@undera-HP:/tmp/serverAgent$ ./startAgent.sh --udp-port 0 --auto-shutdown

INFO    2011-11-25 19:48:59.321 [kg.apc.p] (): Agent will shutdown when all clients disconnected

INFO    2011-11-25 19:48:59.424 [kg.apc.p] (): Binding TCP to 4444
You can use the --sysinfo option to view available system objects:
$ ./startAgent.sh --sysinfo

INFO    2011-11-25 19:51:25.517 [kg.apc.p] (): *** Logging available processes ***

INFO    2011-11-25 19:51:25.542 [kg.apc.p] (): Process: pid=24244 name=bash args=-bash

INFO    2011-11-25 19:51:25.543 [kg.apc.p] (): Process: pid=25086 name=dash args=/bin/sh ./startAgent.sh --sysinfo

INFO    2011-11-25 19:51:25.543 [kg.apc.p] (): Process: pid=25088 name=java args=java -jar ./CMDRunner.jar --tool PerfMonAgent --sysinfo

INFO    2011-11-25 19:51:25.549 [kg.apc.p] (): *** Logging available filesystems ***

INFO    2011-11-25 19:51:25.551 [kg.apc.p] (): Filesystem: fs=/dev type=devtmpfs

INFO    2011-11-25 19:51:25.551 [kg.apc.p] (): Filesystem: fs=/ type=ext4

INFO    2011-11-25 19:51:25.551 [kg.apc.p] (): Filesystem: fs=/var/run type=tmpfs

INFO    2011-11-25 19:51:25.551 [kg.apc.p] (): Filesystem: fs=/home type=ext4

INFO    2011-11-25 19:51:25.552 [kg.apc.p] (): Filesystem: fs=/var/lock type=tmpfs

INFO    2011-11-25 19:51:25.552 [kg.apc.p] (): Filesystem: fs=/proc type=proc

INFO    2011-11-25 19:51:25.553 [kg.apc.p] (): *** Logging available network interfaces ***

INFO    2011-11-25 19:51:25.554 [kg.apc.p] (): Network interface: iface=lo addr=127.0.0.1 type=Local Loopback

INFO    2011-11-25 19:51:25.554 [kg.apc.p] (): Network interface: iface=eth0 addr=192.168.0.1 type=Ethernet

INFO    2011-11-25 19:51:25.555 [kg.apc.p] (): *** Done logging sysinfo ***

INFO    2011-11-25 19:51:25.555 [kg.apc.p] (): Binding UDP to 4444

INFO    2011-11-25 19:51:26.560 [kg.apc.p] (): Binding TCP to 4444
The --interval <seconds> argument can be used to change metrics collection frequency.
Using Server Agent With Other Applications
Server Agent uses simple plain-text protocol, anyone can use agent's capabilities implementing client, based on kg.apc.perfmon.client.Transport interface. If anyone's interested, start the topic on the support forums and I'll describe how to connect third-party client app to agent.
ServerAgent has simple text protocol and can work on UDP and TCP transports. Most of cases will use TCP.
To have your first talk with the agent, start it locally. Then use telnet utility to connect to it:
user@ubuntu:~$ telnet localhost 4444

Trying 127.0.0.1...

Connected to localhost.

Escape character is '^]'.
If connection has succeeded, you should see "Accepting new TCP connection" message in ServerAgent console log. Type "test" and press Enter in telnet chat, server should answer with short "Yep":
test

Yep
Type "exit":
exit

Connection closed by foreign host.
That's it. You sending a command line, server answering. Command line consists of command, sometimes with parameters. Parameters are separated from command with a colon sign.
Possible commands are:
- exit - terminates current client session and closes connection to agent, no parameters
- test - test if server is alive, no parameters
- shutdown - terminate all client connections and shutdown agent process, no parameters
- interval - change metrics reporting interval used in 'metrics' command, single parameter is integer value in seconds. Interval can be changed in the middle of metrics reporting. Example: interval:5
- metrics - starts automatic metrics collection, parameters are metrics list to collect, described below. Example: metrics:cpu
- metrics-single - calls single metric collection iteration. Example: metrics-single:memory
Specifying Metrics
Metrics list consists of metric specifications, separated by TAB character. Metric collection output consists of float values, TAB separated. Example:
metrics-single:cpumemory

22.0573689416419457.52359562205553
Each metric specification consists of several fields, colon-separated. Short example:
metrics-single:cpu:idle    memory:free

80.02238388360381    57.52359562205553
Fields number is metric-type specific. Possible metric types are:
- cpu
- memory
- swap
- disks
- network
- tcp
- tail
- exec
- jmx
Fields corresponding to each metric type are described at metrics page. Last example (Yep, ServerAgent can be shell exec vulnerability. If you have issue with this, ask me and I'll introduce 'secure' mode, disabling insecure metric types):
metrics-single:exec:/bin/sh:-c:free | grep Mem | awk '{print $7}'

1152488
四、Jmeter压力测试和监控示例
将JMeterPlugins.jar包复制到Jmeter的lib目录下面的ext目录下面,重新启动Jmeter,我们点击添加就可以看到出现了很多的jp@gc-开头的文件.
这里监控内存我们使用的是:jp@gc - PerfMon Metrics Collectot
在使用之前,我们需要运行/serverAgent/startAgent.bat这个文件,我们需要将serverAgent目录及下面的文件复制到我们测试的服务器上,然后点击打开(我这里是本机,直接在本机上面打开这个应用系统即可),它的默认端口为4444。
一切准备好后,点击启动,即可得到如下图:
并配置这个监听器
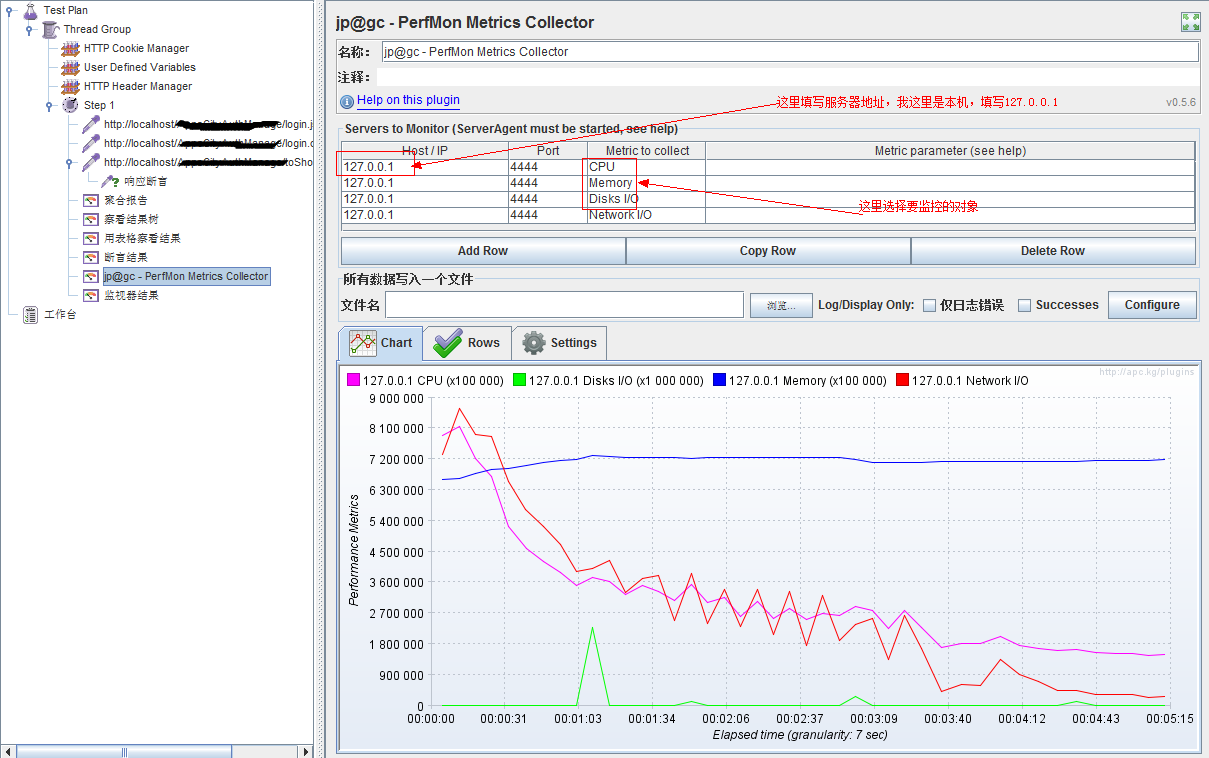
你就可以得到系统运行时,你所需要的常用的性能值了。
监控内存及CPU等(jconsole)
本文转自: 清明-心若淡定 https://www.cnblogs.com/saryli/p/5434927.html
jmeter --- 监控器 Plugins (&jconsole)的更多相关文章
- 【JMeter】JMeter使用plugins插件进行服务器性能监控
性能测试时,我们的关注点有两部分 1 服务本身:并发 响应时间 QPS 2 服务器的资源使用情况:cpu memory I/O disk等 JMeter的plugins插件可以实现对"二&q ...
- jmeter使用笔记——脚本录制,JMeter使用plugins插件进行服务器性能监控
脚本录制: 1.badboy录制 2.代理服务器录制 ①工作台添加HTTP代理服务器 ②设置目标控制器,分组,排除模式,包含模式(使用正则表达式筛选) ③设置浏览器,手动设置代理服务器,localho ...
- JMeter使用plugins插件进行服务器性能监控
JMeter使用plugins插件进行服务器性能监控 性能测试时,我们的关注点有两部分 1 服务本身:并发响应时间 QPS 2 服务器的资源使用情况:cpu memory I/O disk等 JMet ...
- JMeter监控Linux服务器资源案例
JMeter是一款压力测试工具,我们也可以用它来监控服务器资源使用情况.JMeter正常自带可以通过Tomcat的/manager/status来监控服务资源使用情况.这种情况只能监控Tomcat支持 ...
- jmeter之服务器性能监测
性能测试时,我们的关注点有两部分 1 服务本身:并发 响应时间 QPS 2 服务器的资源使用情况:cpu memory I/O disk等 JMeter的plugins插件可以实现对服务器资源使用情况 ...
- Jmeter插件安装及使用
1 安装Plugins Manager插件 1.1 下载Plugins Manager插件 插件下载官方地址:https://jmeter-plugins.org/downloads/all/ 将下载 ...
- Jmeter性能监测及安装插件(推荐)
本文部分理论转自Jmeter官网:https://jmeter-plugins.org/wiki/PerfMon/ ,并结合个人实践编写 一.介绍 在负载测试期间,了解加载服务器的运行状况很重要.如 ...
- Jmeter服务器监控 serveragent如何使用
安装jmeter插件Plugins Managerjmeter-plugins.org推出了全新的Plugins Manager,对于其提供的插件进行了集中的管理,我们只需要安装这个管理插件,即可以在 ...
- JMeter的下载以及安装使用
下载 https://jmeter.apache.org/download_jmeter.cgi 安装 无须安装,解压之后即可使用. 解压到C:\Program Files\apache-jmeter ...
随机推荐
- centos/7下安装mysql5.7
本文参考自:https://blog.csdn.net/fanshujuntuan/article/details/78077433 背景:在ubuntu下用vagrant搭建了一个集群环境, 每个虚 ...
- day73 母版 中间件
关于母版自定义的问题 模板引擎: 基本实用{{k1}} if for 在页面传参数 并判断 通过母版进行交互 一 模板中自定义函数:操作步骤 1在已经注册的App中创建一个名字叫templat ...
- python 爬虫newspaper3k 新闻爬去方法 利用第三方库
from newspaper import Article url = '你想要爬取的网站url' news = Article(url, language='zh') news .download( ...
- java学习笔记16(正则表达式)
正则表达式: 定义:在pattern类中有简单规则定义,具有特殊含义的字符串: 作用:用于一些字符串,比如验证注册邮箱,密码,用户名等: 正则表达式的语法: 1)字符:'\'反斜杠 \t 代表制表 ...
- excel idea sql 操作
1.excel concatenate()函数中连接单元格中值拼接sql时,内容超长,把insert into.... values()前面的单独提出来,只在concatenate()中拼接valu ...
- python day06 作业答案
1. count=1 while count<11: fen=input('请第{}个评委打分' .format( count)) if int(fen) >5 and int(fen) ...
- React native Configuration with name 'default' not found.
添加插件后出现异常 FAILURE: Build failed with an exception. * What went wrong: A problem occurred configuring ...
- INS-20802 Oracle Cluster Verification Utility failed解释说明
背景:安装RAC,安装GI集群管理软件时,在最后快结束时,总是报如上INS-错误 #官方文档:error 说明;字符串解析失败 INS-20802: string failed. Cause: The ...
- 归并排序merge_sort
将区间递归分解,直到区间只有2个元素,然后比较大小,排序,等递归回来的时候就将排序好的子区间再排序合并....一直排序合并,最后就排序完成了. (可以做范围大的逆序数的题) #include < ...
- Mariadb使用xtrabackup工具备份数据脚本
#!/bin/bash#这个脚本用来备份SQL文件: sql_home="/home/mysql"sql_bak_log="$sql_home/xtrabackup.lo ...