Prometheus监控学习笔记之prometheus的远端存储
0x00 概述
prometheus在容器云的领域实力毋庸置疑,越来越多的云原生组件直接提供prometheus的metrics接口,无需额外的exporter。所以采用prometheus作为整个集群的监控方案是合适的。但是metrics的存储这块,prometheus提供了本地存储,即tsdb时序数据库。本地存储的优势就是运维简单,启动prometheus只需一个命令,下面两个启动参数指定了数据路径和保存时间。
- storage.tsdb.path: tsdb数据库路径,默认 data/
- storage.tsdb.retention: 数据保留时间,默认15天
缺点就是无法大量的metrics持久化。当然prometheus2.0以后压缩数据能力得到了很大的提升。
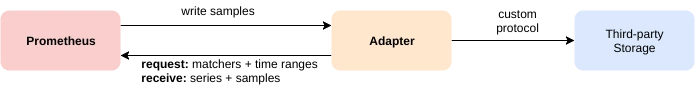
为了解决单节点存储的限制,prometheus没有自己实现集群存储,而是提供了远程读写的接口,让用户自己选择合适的时序数据库来实现prometheus的扩展性。
prometheus通过下面两张方式来实现与其他的远端存储系统对接
- Prometheus 按照标准的格式将metrics写到远端存储
- prometheus 按照标准格式从远端的url来读取metrics
下面我将重点剖析远端存储的方案
0x01 远端存储方案
配置文件
远程写
# The URL of the endpoint to send samples to.

url: <string>

# Timeout for requests to the remote write endpoint.

[ remote_timeout: <duration> | default = 30s ]

# List of remote write relabel configurations.

write_relabel_configs:

  [ - <relabel_config> ... ]

# Sets the `Authorization` header on every remote write request with the

# configured username and password.

# password and password_file are mutually exclusive.

basic_auth:

  [ username: <string> ]

  [ password: <string> ]

  [ password_file: <string> ]

# Sets the `Authorization` header on every remote write request with

# the configured bearer token. It is mutually exclusive with `bearer_token_file`.

[ bearer_token: <string> ]

# Sets the `Authorization` header on every remote write request with the bearer token

# read from the configured file. It is mutually exclusive with `bearer_token`.

[ bearer_token_file: /path/to/bearer/token/file ]

# Configures the remote write request's TLS settings.

tls_config:

  [ <tls_config> ]

# Optional proxy URL.

[ proxy_url: <string> ]

# Configures the queue used to write to remote storage.

queue_config:

  # Number of samples to buffer per shard before we start dropping them.

  [ capacity: <int> | default = 100000 ]

  # Maximum number of shards, i.e. amount of concurrency.

  [ max_shards: <int> | default = 1000 ]

  # Maximum number of samples per send.

  [ max_samples_per_send: <int> | default = 100]

  # Maximum time a sample will wait in buffer.

  [ batch_send_deadline: <duration> | default = 5s ]

  # Maximum number of times to retry a batch on recoverable errors.

  [ max_retries: <int> | default = 10 ]

  # Initial retry delay. Gets doubled for every retry.

  [ min_backoff: <duration> | default = 30ms ]

  # Maximum retry delay.

  [ max_backoff: <duration> | default = 100ms ]
远程读
# The URL of the endpoint to query from.

url: <string>

# An optional list of equality matchers which have to be

# present in a selector to query the remote read endpoint.

required_matchers:

  [ <labelname>: <labelvalue> ... ]

# Timeout for requests to the remote read endpoint.

[ remote_timeout: <duration> | default = 1m ]

# Whether reads should be made for queries for time ranges that

# the local storage should have complete data for.

[ read_recent: <boolean> | default = false ]

# Sets the `Authorization` header on every remote read request with the

# configured username and password.

# password and password_file are mutually exclusive.

basic_auth:

  [ username: <string> ]

  [ password: <string> ]

  [ password_file: <string> ]

# Sets the `Authorization` header on every remote read request with

# the configured bearer token. It is mutually exclusive with `bearer_token_file`.

[ bearer_token: <string> ]

# Sets the `Authorization` header on every remote read request with the bearer token

# read from the configured file. It is mutually exclusive with `bearer_token`.

[ bearer_token_file: /path/to/bearer/token/file ]

# Configures the remote read request's TLS settings.

tls_config:

  [ <tls_config> ]

# Optional proxy URL.

[ proxy_url: <string> ]
PS
- 远程写配置中的write_relabel_configs 该配置项,充分利用了prometheus强大的relabel的功能。可以过滤需要写到远端存储的metrics。
例如:选择指定的metrics。
remote_write:

      - url: "http://prometheus-remote-storage-adapter-svc:9201/write"

        write_relabel_configs:

        - action: keep

          source_labels: [__name__]

          regex: container_network_receive_bytes_total|container_network_receive_packets_dropped_total
- global配置中external_labels,在prometheus的联邦和远程读写的可以考虑设置该配置项,从而区分各个集群
global:

      scrape_interval: 20s

      # The labels to add to any time series or alerts when communicating with

      # external systems (federation, remote storage, Alertmanager).

      external_labels:

        cid: ''
0x03 已有的远端存储的方案
现在社区已经实现了以下的远程存储方案
- AppOptics: write
- Chronix: write
- Cortex: read and write
- CrateDB: read and write
- Elasticsearch: write
- Gnocchi: write
- Graphite: write
- InfluxDB: read and write
- OpenTSDB: write
- PostgreSQL/TimescaleDB: read and write
- SignalFx: write
上面有些存储是只支持写的。其实研读源码,能否支持远程读,
取决于该存储是否支持正则表达式的查询匹配。具体实现下一节,将会解读一下prometheus-postgresql-adapter和如何实现一个自己的adapter。
同时支持远程读写的
- Cortex来源于weave公司,整个架构对prometheus做了上层的封装,用到了很多组件。稍微复杂。
- InfluxDB 开源版不支持集群。对于metrics量比较大的,写入压力大,然后influxdb-relay方案并不是真正的高可用。当然饿了么开源了influxdb-proxy,有兴趣的可以尝试一下。
- CrateDB 基于es。具体了解不多
- TimescaleDB 个人比较中意该方案。传统运维对pgsql熟悉度高,运维靠谱。目前支持 streaming replication方案支持高可用。
0x04 后记
其实如果收集的metrics用于数据分析,可以考虑clickhouse数据库,集群方案和写入性能以及支持远程读写。这块正在研究中。待有了一定成果以后再专门写一篇文章解读。目前我们的持久化方案准备用TimescaleDB。
参考
Prometheus监控学习笔记之prometheus的远端存储的更多相关文章
- Prometheus监控学习笔记之Prometheus存储
0x00 概述 Prometheus之于kubernetes(监控领域),如kubernetes之于容器编排.随着heapster不再开发和维护以及influxdb 集群方案不再开源,heapster ...
- Prometheus监控学习笔记之Prometheus的Relabel,SD以及Federation功能
0x00 k8s 的监控设计 k8s 默认以及推荐的监控体系是它自己的一套东西:Heapster + cAdvisor + Influxdb + Grafana,具体可以看 这里 . 包括 k8s 自 ...
- Prometheus监控学习笔记之prometheus的federation机制
0x00 概述 有时候对于一个公司,k8s集群或是所谓的caas只是整个技术体系的一部分,往往这个时候监控系统不仅仅要k8s集群以及k8s中部署的应用,而且要监控传统部署的项目.也就是说整个监控系统不 ...
- Prometheus监控学习笔记之Prometheus不完全避坑指南
0x00 概述 Prometheus 是一个开源监控系统,它本身已经成为了云原生中指标监控的事实标准,几乎所有 k8s 的核心组件以及其它云原生系统都以 Prometheus 的指标格式输出自己的运行 ...
- Prometheus监控学习笔记之Prometheus普罗米修斯监控入门
0x00 概述 视频讲解通过链接网易云课堂·IT技术快速入门学院进入,更多关于Prometheus的文章. Prometheus是最近几年开始流行的一个新兴监控告警工具,特别是kubernetes的流 ...
- Prometheus监控学习笔记之Prometheus监控简介
0x00 Prometheus容器监控解决方案 Prometheus(普罗米修斯)是一个开源系统监控和警报工具,最初是在SoundCloud建立的.它是一个独立的开放源码项目,并且独立于任何公司.不同 ...
- Prometheus监控学习笔记之Prometheus查询无数据或者Grafana不显示数据的诡异问题
0x00 概述 Prometheus和Grafana部署完成后,网络正常,配置文件正常,抓取agent运行正常,使用curl命令获取监控端口数据正常,甚至Prometheus内的targets列表内都 ...
- Prometheus监控学习笔记之Prometheus 2.x版本的常用变化
最近用了prometheus 2.0 版本,感觉改变还是有点大,现将改变相关记录如下: 1.prometheus.yml文件配置修改后,要想重新加载,必须在启动的时候添加参数: --web.enabl ...
- Prometheus监控学习笔记之Prometheus的架构及持久化
0x00 Prometheus是什么 Prometheus是一个开源的系统监控和报警工具,特点是 多维数据模型(时序列数据由metric名和一组key/value组成) 在多维度上灵活的查询语言(Pr ...
随机推荐
- ios9 适配的坑
http://www.cocoachina.com/ios/20151016/13715.html
- c# 利用MailKit.IMap 收取163邮件
最近我要做一个爬虫.这个爬虫需要如下几个步骤: 1 填写注册内容(需要邮箱注册) 2 过拖拽验证码(geetest) 3 注册成功会给邮箱发一封确认邮箱 4 点击确认邮箱中的链接 完成注册 我这里就采 ...
- iOS 正则表达式(一)
在iOS开发中,正则一直是最常用的,但也是一直记不住的,现在做一些简单的总结 我们在网上找的正则,要有'\',这个在iOS是转义符,需要'\\'这样 int main(int argc, const ...
- react native 初识生命周期
关于生命周期这块,我是看到慕课堂的一个视频,觉得将的很好,引入很容易理解,地址是:https://www.imooc.com/video/14288 如果你们想了解一下,也可以去看看 RN 组件的生 ...
- 函数式编程语言(functional language)
内容根据百度词条整理! 转载请声明来源:https://baike.baidu.com/item/%E5%87%BD%E6%95%B0%E7%BC%96%E7%A8%8B%E8%AF%AD%E8%A8 ...
- RSA加解密 私钥加密公钥解密 私加公解 && C++ 调用openssl库 的代码实例
前提:秘钥长度=1024 ============================================== 对一片(117字节)明文加密 私加 ===================== ...
- install Maven
工欲善其事,必先利其器.咱们也来玩玩 Maven 这货吧!先得去下载一个. 准备工作 java开发环境(JDK) maven下载地址:http://maven.apache.org/release-n ...
- idea上将项目上传到github
1.下载并安装好git,然后配置git的path路径.再配置git的全局用户名和邮箱. 2.注册github账号,如果已经有github账号,则此步骤可以省略. 3.在idea中配置git,配置如下: ...
- CSS常用样式属性
1.CSS字体和文本相关属性 属性 font-family 规定文本的字体系列,比如:“serif” ''sans-serif" font-size 规定文本的字体尺寸 font-style ...
- lua学习之循环求一个数的阶乘
--第3题 利用循环求n的阶乘 --参数检查是否是自然数 function IsNaturalNumber(n) ~= )then return false else return true end ...