
8 Productivity hacks for Data Scientists & Business Analysts
8 Productivity hacks for Data Scientists & Business Analysts
Introduction
I was catching up with one of my friends from a past organization. She had always been interested in data science, but was only able to break into it about 10 months ago. She had joined an organization as a data scientist and was clearly learning a lot in her (relatively) new role. Over our conversation, she mentioned a fact / question, which has stuck with me since then. She said that irrespective of how well she performs, she ends up doing every project / analysis multiple times before it is satisfactory for her manager. She also mentioned that these iterations cause her work to take lot more time than it should actually require in hindsight!
Does that sound familiar to you? Do you repeat your analysis multiple times before it becomes presentable and throws out answers to the required questions? Or you end up writing codes for similar activities again and again? If it does, you are at the right place. I’ll share a few ways in which you can increase your productivity and kill these unwanted iterations.
P.S. Don’t get me wrong here. I am not saying that iterations are bad in entirety. In fact, data science as a subject requires you to do things in iterations at times. But not all iterations are healthy and it is those unhealthy iterations we need to avoid. They will be the focus of this article.
What causes these iterations in analysis?
I am defining an iteration healthy / unhealthy using the following definition. Any iteration in analysis, which is happening due to any reason apart from flow of new information is an unhealthy iteration (there is one exception to this, which is mentioned below). Let me explain a few such scenarios:
- The business problem was not laid out correctly. The problem customer wanted to solve is different from the one you have been working on.
- Iteration because you need to collect more variables, which you did not think you will need upfront.
- Iteration because you did not think about the biases or the assumptions impacting your analysis.
On the other hand, if your iteration is happening because you built a model 6 months back and you now have new information, it is a healthy iteration. Another scenario for healthy iteration is when you deliberately start with simple models to develop better understanding and then build complex models.
Now, I am sure I have not covered all possible scenarios here, but I am sure these examples are good enough for you to judge whether an iteration in your analysis is healthy or unhealthy.
Impact of these productivity killers
Let’s get this clear – no one want’s unhealthy iterations and productivity killers in their analysis. Missing out on a few variables initially and then running the entire analysis again after collecting them would not interest any data scientist. Also, there is no fun in doing the same analysis again!
This productivity loss and iterations create frustation and dis-satisfaction among the analysts / data scientists and hence should be avoided at all costs.
Tips to avoid unhealthy iterations and increasing productivity
Tip 1: Focus on big problems (and big problems only):
I am sure every organization has a lot of small problems, which can be solved using data. But, they are not the best use of the data scientists. Focus on just those 3-4 problems, which can have huge impact on the organization. These problems would be challenging and would give you the maximum leverage for your analysis as well. You should not try to solve a smaller problem, if the bigger problem is unsolved.
This might sound trivial, but the number of organizations which make this mistake are non-trivial! I see banks working on marketing analytics when their risk scoring can be improved. Or insurance companies trying to build a reward program for agents, when their customer retention can be improved using analytics.
Tip 2: Create a presentation of your analysis before you start (with possible layouts and branches)
I do this all the time and I can’t tell how beneficial this is. The first thing you should do as soon as you start a project is to layout the presentation of your analysis. This might sound counter-intuitive to start with, but once you develop this habit, it can reduce your project turn around time to a fraction of what it takes otherwise.
So, what do you do?
You layout the story in form of a presentation / a word document or just a story on pen and paper. The actual form is immaterial. What is important is that you layout all possible outcomes at the start of the journey. For example, if you are looking to reduce the charge offs, a structure to lay out on your presentation would be something like this:
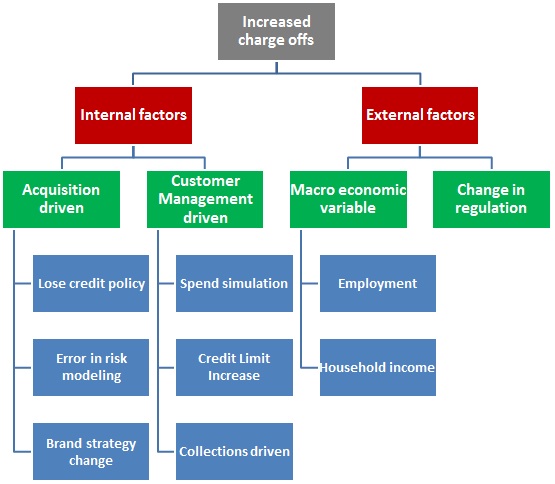
Next, you can take up each factor and define what do you need to see to conclude whether it has driven the increase in charge-off and how will you go about doing this? For example, if the charge-offs for the bank have increased because of increase in credit limit of customers, you would:
- First, need to ascertain that the customers who were not offered a credit limit increase did not worsen off in the charge offs.
- Next, put a mathematical equation trying to size the effect.
Once you have done this with every possible branch of your analysis, you have created a good starting point for yourself.
Tip 3: Define data requirements upfront:
This flows from the last step directly. If you have laid out the analysis comprehensively, you would know the data requirements by the end of it. Here are a few tips to help you out:
- Try and put a structure to your data requirement: Instead of putting down a list of variables, you should design the tables you would want for your analysis. In the case above (increased charge offs), you will need a customer demographic table, a table for past marketing campaigns, transactions done by customers for last 12 months, credit policy changes for the bank etc.
- Collect all the data you might need: Even if you are not 100% sure, whether you will need all the variables in the data set, you should go ahead and collect them at this stage. Normally, it is very little incremental work to include additional variables at this stage, rather than re-asking for variables to be collected at a later point in the analysis.
- Define the time period of the data you are interested in
Tip 4: Make sure your analysis is reproducible:
Again, this might sound as a simple tip – but you see both the beginners as well as the advanced people falter on it. The beginners would perform steps in excel, which would include copy paste of data. For the advanced users, any work done through command line interface might not be reproducible.
Similarly, you need to extra cautious while working with notebooks. You should control your urge to go back and change any previous step which uses the data set which has been computed later in the flow. Notebooks can be very powerful, if the flow is maintained. If the flow is not maintained, they can be very tardy as well.
Tip 5: Keep standard libraries of codes ready and accessible:
There is no point in re-writing codes for simple operations again and again. Not only it takes extra time, but it might lead to possible syntax errors. Another tip to make the most of this is to create a library of these common operations and share it across your entire team.
This will not only make sure the entire team uses the same code, but also make them more efficient.
Tip 6: Similarly, keep a library of intermediate datamarts:
A lot of times, you need same piece of information again and again. For example, you will need total customer spend on a credit card for several analysis and reporting. While you can calculate it every time you need from the transaction tables, it is much better to again create intermediate datamarts of these tables to save time and efforts spent in creating these tables. Similarly, think of summary tables for marketing campaigns. There is no point in re-inventing the wheels every time.
Tip 7: Always use an holdout sample / cross-validation to avoid over-fitting
A lot of beginners under-estimate the power of holdout or cross-validation. A lot of tend to believe that if train is sufficiently large, there are hardly / no chances of over-fitting and hence a cross-validation or holdout sample is not required.
More often that not, this turns out to be blooper in the end. Don’t believe me – check out Kaggle public and private leader boards for any competition. You will always find a few entries in top 10 who end up dropping their ranks as they ended up overfitting their solutions. And you would hope these to be more advanced data scientists.
Tip 8: Work in chunks and take breaks regularly:
When do I work the best? It’s when I provide myself a 2-3 hours window to work on a problem / project. You can’t multi-task as a data scientist. You need to be focuses on a single problem at a time to make sure you get the best out of yourself. 2-3 hour chunks work best for me, but you can decide yours.
End Notes:
So, those were some productivity hacks I use for increasing my productivity. I can’t emphasize the importance of getting things right the first time enough. You have to get into a habit of getting it right every time – that is what will make you an awesome data scientist.
Do you have any tips which makes you more productive? If yes, share it with us in comments below.
If you like what you just read & want to continue your analytics learning, subscribe to our emails, follow us on twitter or like our facebook page.
8 Productivity hacks for Data Scientists & Business Analysts的更多相关文章
- Why Apache Spark is a Crossover Hit for Data Scientists [FWD]
Spark is a compelling multi-purpose platform for use cases that span investigative, as well as opera ...
- Seven Python Tools All Data Scientists Should Know How to Use
Seven Python Tools All Data Scientists Should Know How to Use If you’re an aspiring data scientist, ...
- SQL Server Data Tools – Business Intelligence for Visual Studio 2012安装时提示“The CPU architecture....”的解决方法
SQL Server Data Tools – Business Intelligence for Visual Studio 2012,一个很强大的工具,下载地址:http://www.micros ...
- Microsoft SQL Server Data Tools - Business Intelligence for Visual Studio 2013 http://www.microsoft.com/en-us/download/details.aspx?id=42313
Microsoft SQL Server Data Tools - Business Intelligence for Visual Studio 2013 http://www.microsoft. ...
- Software development skills for data scientists
Software development skills for data scientists Data scientists often come from diverse backgrounds ...
- The 10 Statistical Techniques Data Scientists Need to Master
原文 就我个人所知有太多的软件工程师尝试转行到数据科学家而盲目地使用机器学习框架来处理数据,例如,TensorFlow或者Apache Spark,但是对于这些框架背后的统计理论没有完全的理解.所以提 ...
- 单列模式(data与business交互)
public class CommentsBusiness //Business { #region 单列模式 private static CommentBusiness instance; pri ...
- Top Data Scientists to Follow & Best Data Science Tutorials on GitHub
http://www.analyticsvidhya.com/blog/2015/07/github-special-data-scientists-to-follow-best-tutorials/ ...
- Microsoft SQL Server Data Tools - Business Intelligence for Visual Studio 2013 SSIS
VS2012 SSDTBI_VS2012_x86_CHS.exe http://www.microsoft.com/zh-CN/download/details.aspx?id=36843 VS201 ...
随机推荐
- Deferred Shading 延迟着色(翻译)
原文地址:https://en.wikipedia.org/wiki/Deferred_shading 在3D计算机图形学领域,deferred shading 是一种屏幕空间着色技术.它被称为Def ...
- 互联网寒冬,Python 程序员如何准备面试
虽说年年都在喊互联网寒冬,最难就业季,但是今年确实有点不一样,年前年后一波又一波互联网公司宣布『人员调整,结构优化』, 这是往年没发生过的. 是不是面试机会就少了很多呢?不是的. 搜索招聘网站我们可以 ...
- C++ 实验 使用重载运算符实现一个复数类
实验目的: 1.掌握用成员函数重载运算符的方法 2.掌握用友元函数重载运算符的方法 实验要求: 1.定义一个复数类,描述一些必须的成员函数,如:构造函数,析构函数,赋值函数,返回数据成员值的函数等. ...
- Notes of Daily Scrum Meeting(12.8)
今日团队任务总结: 团队成员 今日团队工作 陈少杰 使用例子对json数据进行解析 王迪 确定搜索功能的接口 金鑫 对布局文件进行协助修改 雷元勇 开始进行搜索功能的代码实现 高孟烨 按照学长的样本对 ...
- linux内核分析第二次实验
http://blog.sina.com.cn/s/blog_78e559950102wnqp.html
- 【MOOC EXP】Linux内核分析实验四报告
程涵 原创博客 <Linux内核分析>MOOC课程http://mooc.study.163.com/course/USTC-1000029000 [使用库函数API和C代码中嵌入汇编代 ...
- 我是一个程序猿 ——《不是书评 :<我是一只IT小小鸟>》有感
读了刘未鹏先生的文章<不是书评 :<我是一只IT小小鸟>>,产生了诸多共鸣,更明白了不少道理. 首先是一个很平常的现象,进度条效应,在操作移动终端上的软件时,如果没有进度条,人 ...
- 分析code
1 using System; //跟系统说明一下可能会用到这个dll里面的东西 using System.Collections.Generic; //引用集合类命名空间 using System. ...
- ElasticSearch 2 (11) - 节点调优(ElasticSearch性能)
ElasticSearch 2 (11) - 节点调优(ElasticSearch性能) 摘要 一个ElasticSearch集群需要多少个节点很难用一种明确的方式回答,但是,我们可以将问题细化成一下 ...
- nodemoduleOfCheerio
https://www.npmjs.com/package/cheerio 这是npm的api说明 英文好的同学可以去看看. cheerioAPI 是一个用来操作jsDOM的模块: 就像jQuery一 ...