11g SQL Monitor
1,首先确认两个参数的值
SQL> show parameter statistics_level
NAME TYPE VALUE
------------------------------------ ----------- ------------------------------
statistics_level string TYPICAL
SQL> SHOW PARAMETER control_management_pack_access
NAME TYPE VALUE
------------------------------------ ----------- ------------------------------
control_management_pack_access string DIAGNOSTIC+TUNING
2,从v$sql_monitor查看sql_id
SQL> select sql_id ,sql_text from v$sql_monitor where sql_text like '%EMPLOYEE_TEST%';
SQL_ID
-------------
SQL_TEXT
--------------------------------------------------------------------------------
5ujtyb95f83jy
select /*+ parallel(8) */ * from scott.EMPLOYEE_TEST
2v0bzu74hyj30
select /*+ parallel(8) */ * from scott.EMPLOYEE_TEST where rownum<500
3,生成sql monitor报告
如果运行dbms_sqltune.report_sql_monitor报错说sqlmonitor组件不存在,要首先执行oracle/db/rdbms/admin/execrept.sql这个脚本。
SQL Monitor报告有三种格式 TEXT,HTML, ACTIVE
TEXT标准版
SET LONG 1000000
SET LONGCHUNKSIZE 1000000
SET LINESIZE 1000
SET PAGESIZE 0
SET TRIM ON
SET TRIMSPOOL ON
SET ECHO OFF
SET FEEDBACK OFF
SQL> SPOOL report_sql_monitor.txt
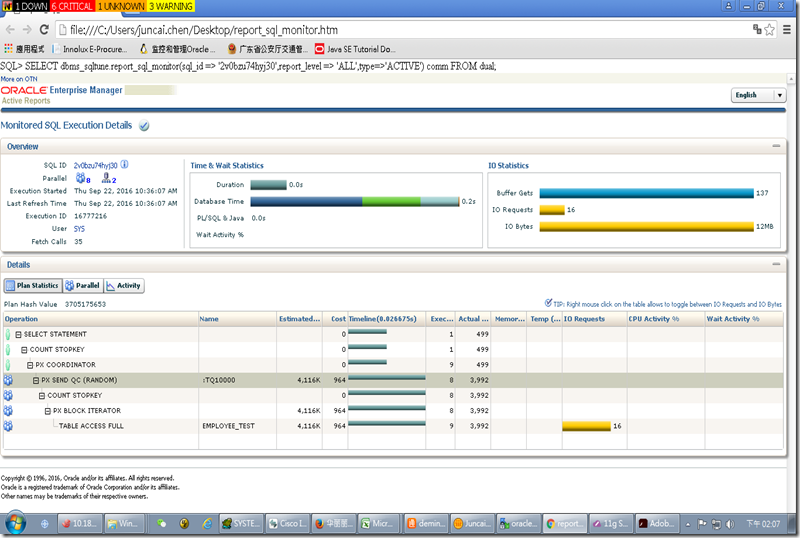
SQL> SELECT dbms_sqltune.report_sql_monitor(sql_id => '2v0bzu74hyj30',report_level => 'ALL',type=>'TEXT') comm FROM dual;
SQL Monitoring Report
SQL Text
------------------------------
select /*+ parallel(8) */ * from scott.EMPLOYEE_TEST where rownum<500
Global Information
------------------------------
Status : DONE (ALL ROWS)
Instance ID : 1
Session : SYS (132:1717)
SQL ID : 2v0bzu74hyj30
SQL Execution ID : 16777216
Execution Started : 09/22/2016 10:36:07
First Refresh Time : 09/22/2016 10:36:07
Last Refresh Time : 09/22/2016 10:36:07
Duration : .026675s
Module/Action : sqlplus@fff1 (TNS V1-V3)/-
Service : SYS$USERS
Program : sqlplus@fff1 (TNS V1-V3)
Fetch Calls : 35
Global Stats
=========================================================================================
| Elapsed | Cpu | IO | Application | Other | Fetch | Buffer | Read | Read |
| Time(s) | Time(s) | Waits(s) | Waits(s) | Waits(s) | Calls | Gets | Reqs | Bytes |
=========================================================================================
| 0.15 | 0.04 | 0.08 | 0.00 | 0.03 | 35 | 137 | 16 | 12MB |
=========================================================================================
Parallel Execution Details (DOP=8 , Servers Allocated=8)
Instances : 2
=============================================================================================================================================
| Instance | Name | Type | Server# | Elapsed | Cpu | IO | Application | Other | Buffer | Read | Read | Wait Events |
| | | | | Time(s) | Time(s) | Waits(s) | Waits(s) | Waits(s) | Gets | Reqs | Bytes | (sample #) |
=============================================================================================================================================
| 1 | PX Coordinator | QC | | 0.03 | 0.01 | | 0.00 | 0.01 | 13 | | . | |
| 2 | p004 | Set 1 | 1 | 0.02 | 0.00 | 0.01 | | | 13 | 2 | 2MB | |
| 2 | p005 | Set 1 | 2 | 0.01 | 0.00 | 0.00 | | | 21 | 1 | 304KB | |
| 2 | p006 | Set 1 | 3 | 0.02 | 0.00 | 0.01 | | | 30 | 3 | 2MB | |
| 2 | p007 | Set 1 | 4 | 0.02 | 0.00 | 0.01 | | | 13 | 2 | 2MB | |
| 1 | p004 | Set 1 | 5 | 0.02 | 0.00 | 0.01 | | 0.01 | 13 | 2 | 2MB | |
| 1 | p005 | Set 1 | 6 | 0.02 | 0.00 | 0.01 | | 0.01 | 8 | 2 | 2MB | |
| 1 | p006 | Set 1 | 7 | 0.02 | 0.00 | 0.01 | | 0.00 | 13 | 2 | 1MB | |
| 1 | p007 | Set 1 | 8 | 0.02 | 0.00 | 0.01 | | | 13 | 2 | 2MB | |
=============================================================================================================================================
Instance Drill-Down
===================================================================================================================================
| Instance | Process Names | Elapsed | Cpu | IO | Application | Other | Buffer | Read | Read | Wait Events |
| | | Time(s) | Time(s) | Waits(s) | Waits(s) | Waits(s) | Gets | Reqs | Bytes | |
===================================================================================================================================
| 1 | QC p004 p005 p006 p007 | 0.10 | 0.03 | 0.04 | 0.00 | 0.03 | 60 | 8 | 6MB | |
| 2 | p004 p005 p006 p007 | 0.06 | 0.02 | 0.04 | | | 77 | 8 | 6MB | |
===================================================================================================================================
SQL Plan Monitoring Details (Plan Hash Value=3705175653)
======================================================================================================================================================
| Id | Operation | Name | Rows | Cost | Time | Start | Execs | Rows | Read | Read | Activity | Activity Detail |
| | | | (Estim) | | Active(s) | Active | | (Actual) | Reqs | Bytes | (%) | (# samples) |
======================================================================================================================================================
| 0 | SELECT STATEMENT | | | | 1 | +0 | 1 | 499 | | | | |
| 1 | COUNT STOPKEY | | | | 1 | +0 | 1 | 499 | | | | |
| 2 | PX COORDINATOR | | | | 1 | +0 | 9 | 499 | | | | |
| 3 | PX SEND QC (RANDOM) | :TQ10000 | 4M | 964 | 2 | +0 | 8 | 3992 | | | | |
| 4 | COUNT STOPKEY | | | | 2 | +0 | 8 | 3992 | | | | |
| 5 | PX BLOCK ITERATOR | | 4M | 964 | 2 | +0 | 8 | 3992 | | | | |
| 6 | TABLE ACCESS FULL | EMPLOYEE_TEST | 4M | 964 | 2 | +0 | 9 | 3992 | 16 | 12MB | | |
======================================================================================================================================================
SQL> SPOOL OFF
ACTIVE尊享版
SET LONG 1000000
SET LONGCHUNKSIZE 1000000
SET LINESIZE 1000
SET PAGESIZE 0
SET TRIM ON
SET TRIMSPOOL ON
SET ECHO OFF
SET FEEDBACK OFF
SQL> SPOOL report_sql_monitor.htm
SELECT dbms_sqltune.report_sql_monitor(sql_id => '2v0bzu74hyj30',report_level => 'ALL',type=>'ACTIVE') comm FROM dual;
SQL> SPOOL OFF
4,参考:
https://oracle-base.com/articles/11g/real-time-sql-monitoring-11gr1
http://www.oracle.com/technetwork/database/manageability/sqlmonitor-084401.html
http://blog.itpub.net/23718752/viewspace-1216422/
http://www.eygle.com/archives/2012/09/sqloracle_sql_monitor_report.html
Doc ID 1380492.1
11g SQL Monitor的更多相关文章
- sql monitor生成不了报告& FFS hint不生效两个问题思考
事情的发生就是这么偶然,一步步的深入才能汲取到更深入的知识~~ -------------------START------------------------------------------- ...
- 【转载】sql monitor
来自 “ ITPUB博客 ” ,链接:http://blog.itpub.net/27067062/viewspace-2129635/ SQL Monitor Report 1. SQL Monit ...
- Oracle SQL调优系列之SQL Monitor Report
@ 目录 1.SQL Monitor简介 2.捕捉sql的前提 3.SQL Monitor 参数设置 4.SQL Monitor Report 4.1.SQL_ID获取 4.2.Text文本格式 4. ...
- DB SQL Monitor 阻塞及等待事件监控工具
SQL Monitor Designed By zhaoguan wang 说明------------------------------------------------------------ ...
- 利用 SQL Monitor 查看语句运行状态步骤
利用 SQL Monitor 查看语句运行状态步骤 1.确定语句被 SQL Monitor 监控 SQL> SELECT * FROM GV$SQL_MONITOR WHERE sql_id=' ...
- [SQL]透過redgate SQL Monitor 來找出 ASYNC_NETWORK_IO 問題
原文:[SQL]透過redgate SQL Monitor 來找出 ASYNC_NETWORK_IO 問題 最近因為在查一個SQL的效能問題,透過 sys.dm_os_wait_stats 來取得To ...
- 我的工具:Db SQL Monitor
SQL Monitor 是一款界面简洁.绿色小巧的sql活动监视器,它能够帮助用户对 SQL Server 运行进程和Job进行实时监视,您可以查看当前执行的SQL/命令并终止. 工具下载地址:htt ...
- DB SQL Monitor 会话状态及等待事件监控工具
DB SQL Monitor v1.7.6 Designed by Wang Zhaoguan 工具说明 --------------------------------------- ...
- Oracle Database 11g : SQL 基础
简介 1:课程目标 2:课程 目标 3:Oracle Database 11g 以及相关产品概览 1:Oracle Database 11g :重点领域 2:Oracle Fusion Middlew ...
随机推荐
- WinForm多线程编程简单Demo
需要搭建一个可以监控报告生成的CS(WinForm)工具,即CS不断Run,执行获取数据生成报告,经过研究和实践,选择了使用"WinForm多线程编程"的解决方案.当然参考了园中相 ...
- Python类的特点 (1):构造函数与方法
Python中,类的特点: #encoding:utf-8 class Parent(object): x=1 #x是Parent类的属性(字段) def __init__(self): print ...
- keystone v3 相关介绍
1) 涉及到如下几个概念:User.Tenant.Role.Token.http://www.ibm.com/developerworks/cn/cloud/library/1506_yuwz_key ...
- meeting room I & II
Given an array of meeting time intervals consisting of start and end times [[s1,e1],[s2,e2],...] (si ...
- Delete a node from BST
Given a root node reference of a BST and a key, delete the node with the given key in the BST. Retur ...
- Install OE and BitBake
LeapFrog Explorers: Install OE and BitBake - eLinux.org http://elinux.org/LeapFrog_Explorers:_In ...
- cf555b
题意:按顺序给出多个互不相交的区间(表示一些小岛),和一些可以连接区间的桥,每个桥有固定的长度.区间和桥的数量都是2*10^5. 两个相邻的小岛之间的桥的长度必须小于等于最远点距离,大于等于最近点距离 ...
- /etc/securetty文件
/etc/securetty 文件允许你规定“root”用户可以从哪个tty设备登录. 登录程序(通常是/bin/login)需要读取“/etc/securetty”文件. 它的格式:列出来的tty设 ...
- Zookeeper服务常用的操作命令
Zookeeper服务安装之后,一般会在这个服务的基础之上安装其他的大数据平台,其他的框架一般会提供很多接口对Zookeeper中的内容进行一定的操作,但是功能相对单一,所以有些时候,有必要我们自己登 ...
- 算法手记 之 数据结构(堆)(POJ 2051)
一篇读书笔记 书籍简评:<ACM/ICPC 算法训练教程>这本书是余立功主编的,代码来自南京理工大学ACM集训队代码库,所以小编看过之后发现确实很实用,适合集训的时候刷题啊~~,当时是听了 ...