Performance Co-Pilot
Install
Performance Co-Pilot 提前安装依赖
[root@iZrj97j6t7ih9hgz1me35hZ ~]# cat install.sh

yum install -y docker

yum install -y git

yum install -y yum-utils-1.1.31-40.el7.noarch

yum install lex

yum install flex

yum install -y bison

yum install -y perl-ExtUtils-MakeMaker.noarch

yum install -y libmicrohttpd

yum install -y libmicrohttpd*

yum install -y gcc-c++

yum install -y pcp-libs-3.11.3-4.el7.x86_64

yum install -y pcp-3.11.3-4.el7.x86_64
Installing Performance Co-Pilot 安装PCP
git clone git://git.pcp.io/pcp

cd pcp

groupadd -r pcp

useradd -c "Performance Co-Pilot" -g pcp -d /var/lib/pcp -M -r -s /usr/sbin/nologin pcp

./configure --prefix=/usr --sysconfdir=/etc --localstatedir=/var --with-webapi

#./configure --prefix=/usr --libexecdir=/usr/lib --sysconfdir=/etc      --localstatedir=/var --with-rcdir=/etc/init.d

make

make install

/etc/init.d/pmcd start
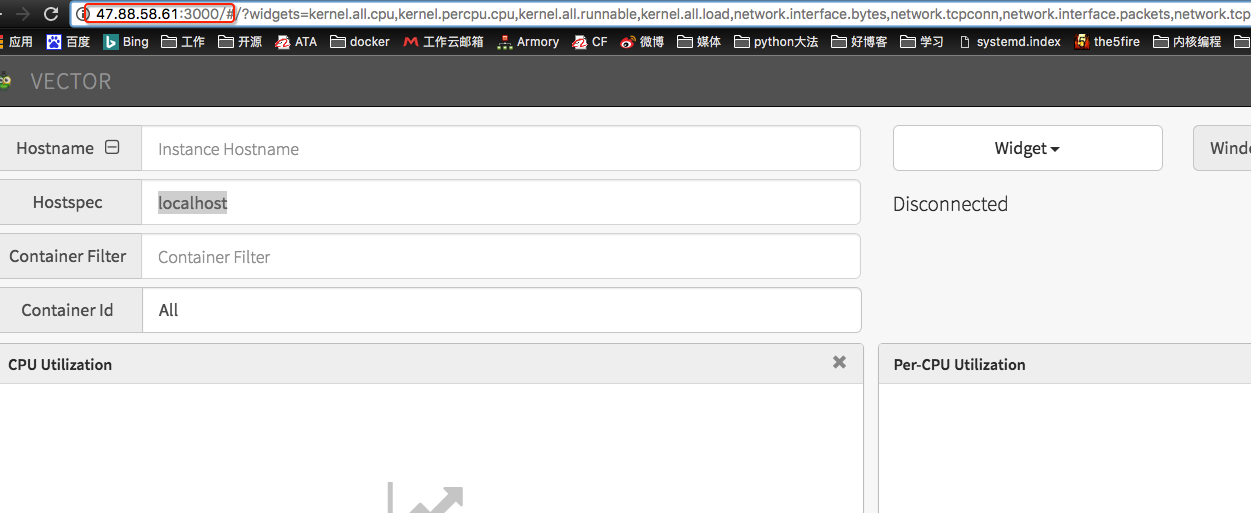
Building Vector from Source 源码安装Vector
安装vector
$ git clone https://github.com/Netflix/vector.git

$ cd vector
安装:Node.JS, npm and Bower
# yum install -y npm

# npm install

# npm install -g bower

# bower install --allow-root

# npm install --global gulp-cli

# gulp build

# Development ServerYou can run Vector with Gulp’s development web server and live reload. In order to start Gulp’s web server, just execute the serve task:

# gulp serve
功能
PCP Collection Daemon (PMCD)
# /etc/init.d/pmcd start
pmie (Performance Metrics Inference Engine)
[root@iZrj97j6t7ih9hgz1me35hZ ~]# chkconfig pmie on
REF
web:
http://vectoross.io/docs/installing-performance-co-pilot.html
git Install :
https://github.com/muahao/pcp/blob/master/INSTALL.md
PCP quick start: http://pcp.io/docs/guide.html
快速部署PCP
#!/bin/bash

#Installing Collector Hosts

yum install pcp -y

chkconfig pmcd on

service pmcd start

chkconfig pmlogger on

service pmlogger start

#Installing Monitor Host

yum install pcp-doc pcp-gui -y

echo localhost n n PCP_LOG_DIR/pmlogger/localhost -r -T24h10m -c localhost >> /etc/pcp/pmlogger/control

service pmlogger restart

#Dynamic Host Discovery

yum install pcp-manager -y

chkconfig pmmgr on

echo localhost >> /etc/pcp/pmmgr/target-host

echo avahi >> /etc/pcp/pmmgr/target-discovery

echo probe= ip.addr.tup.le/netmask >> /etc/pcp/pmmgr/target-discovery

service pmmgr restart

find /var/log/pcp/pmmgr

#Installation Health Check

pcp -h localhost

#Monitoring Live Performance Metrics

pminfo -h localhost

#Retrospective Performance Analysis

#Visualizing iostat and sar Data

#iostat -t -x 2 > iostat.out

#iostat2pcp iostat.out iostat.pcp

#pmchart -t 2sec -a iostat.pcp

#Process Level Performance Monitoring

pminfo proc

#Performance Metrics Inference

chkconfig pmie on

service pmie start

#Enable monitoring of metrics from remote host acme.com :

echo acme.com n PCP_LOG_DIR/pmie/acme.com -c config.acme.com

service pmie restart

#PCP Web Services

yum install pcp-webapi -y

chkconfig pmwebd on

service pmwebd start

#User Web Interface for Performance Metrics

yum install -y pcp-webjs
Performance Co-Pilot的更多相关文章
- Performance Monitor4:监控SQL Server的IO性能
SQL Server的IO性能受到物理Disk的IO延迟和SQL Server内部执行的IO操作的影响.在监控Disk性能时,最主要的度量值(metric)是IO延迟,IO延迟是指从Applicati ...
- Performance Tuning
本文译自Wikipedia的Performance tuning词条,原词条中的不少链接和扩展内容非常值得一读,翻译过程中暴露了个人工程学思想和英语水平的不足,翻译后的内容也失去很多准确性和丰富性,需 ...
- Performance Monitor3:监控SQL Server的内存压力
SQL Server 使用的资源受到操作系统的调度,同时,SQL Server在内部实现了一套调度算法,用于管理从操作系统获取的资源,主要是对内存和CPU资源的调度.一个好的数据库系统,必定在内存中缓 ...
- [MySQL Reference Manual] 23 Performance Schema结构
23 MySQL Performance Schema 23 MySQL Performance Schema 23.1 性能框架快速启动 23.2 性能框架配置 23.2.1 性能框架编译时配置 2 ...
- Unity性能优化(2)-官方教程Diagnosing performance problems using the Profiler window翻译
本文是Unity官方教程,性能优化系列的第二篇<Diagnosing performance problems using the Profiler window>的简单翻译. 相关文章: ...
- 使用ANTS Performance Profiler&ANTS Memory Profiler工具分析IIS进程内存和CPU占用过高问题
一.前言 最近一段时间,网站经常出现两个问题: 1.内存占用率一点点增高,直到将服务器内存占满. 2.访问某个页面时,页面响应过慢,CPU居高不下. 初步判断内存一点点增多可能是因为有未释放的资源一直 ...
- KPI:Key Performance Indicator
通信中KPI,是Key Performance Indicators的缩写,意思是关键性能指标.performance 还有绩效:业绩的意思,但显然不适用于这种场合. 通信中KPI的内容有:掉话率.接 ...
- Performance Monitor1:开始性能监控
Performance Monitor是Windows内置的一个可视化监控工具,能够在OS级别上实时记录系统资源的使用情况,通过收集和存储日志数据,在SQL Server发生异常时,能够还原系统当时的 ...
- Performance Monitor2:Peformance Counter
Performance Counter 是量化系统状态或活动的一个数值,Windows Performance Monitor在一定时间间隔内(默认的取样间隔是15s)获取Performance Co ...
- Disk IO Performance
一,使用 Performance counter 监控Disk IO问题 1,Physical Disk vs. Logical Disk Windows可以在一个Physical Disk上划出若干 ...
随机推荐
- Oleg and Little Ponies
Oleg and Little Ponies Time limit: 0.9 secondMemory limit: 64 MB Little boy Oleg loves the cartoon M ...
- (30)导入时如何定制spring-boot依赖项的版本【转载】【从零开始学Spring Boot】
此文章转载地址:http://www.tuicool.com/articles/RJJvMj3 请注重作者的版权. spring-boot通过maven的依赖管理为我们写好了很多依赖项及其版本,我们可 ...
- (10)Spring Boot修改端口号【从零开始学Spring Boot】
Spring boot 默认端口是8080,如果想要进行更改的话,只需要修改applicatoin.properties文件,在配置文件中加入: server.port=9090 常用配置: #### ...
- 0929误删除innodb ibdata数据文件
今天在群里看到有人说不熟悉innodb把ibdata(数据文件)和ib_logfile(事务日志)文件误删除了.不知道怎么解决.当时我也不知道怎么办.后来查阅相关资料.终找到解决方法.其实恢复也挺简单 ...
- mysql备份恢复中的常见错误
从A主机备份到B主机 mysqldump -uroot -p vw>vw.sql 现备份数据库文件,需要恢复到目标机B,B的数据库版本为5.5.23,A机器的mysql版本为5.0.2 ...
- objective-c 中数据类型之四 字典(NSDictionary)
// 1. 字典初始化.赋值方式1 NSMutableDictionary *m_dictionary = [[NSMutableDictionary alloc] initWithCapacity: ...
- EularProject 36:2进制和10进制回文数
华电北风吹 天津大学认知计算与应用重点实验室 完毕日期:2015/7/29 Double-base palindromes Problem 36 The decimal number, 585 = 1 ...
- 【java项目实战】ThreadLocal封装Connection,实现同一线程共享资源
线程安全一直是程序员们关注的焦点.多线程也一直是比較让人头疼的话题,想必大家以前也遇到过各种各种的问题.我就不再累述了.当然,解决方案也有非常多,这篇博文给大家提供一种非常好的解决线程安全问题的思路. ...
- LeetCode OJ 之 Delete Node in a Linked List (删除链表中的结点)
题目: Write a function to delete a node (except the tail) in a singly linked list, given only access t ...
- 在Android系统中添加宏控制代码【原创】
关键词:Android 宏控制 Androd.mk 平台信息:内核:linux3.4.39 系统:android/android5.1平台:S5P4418 作者:庄泽彬(欢迎转载,请注明作者) 邮 ...