matplotlib---画等高线
contour - 绘制等高线
mp.contour(x, y, z, 等高线条数,colors=颜色, linewidth=线宽)#等高线绘制
contourf - 填充等高线
mp.contourf(x, y, z, 等高线条数,cmap=颜色映射)# 等高线填充
clabel - 标记等高线,向CS(由contour函数返回的matplotlib.contour.ContourSet对象)中的轮廓线添加标签
clabel(CS, *args, **kwargs)
- CS - 由contour函数产生的句柄对象
- fontsize - string(smaller, x-large) or float ,optional
- colors - Color of each label
- None, 标记的颜色为轮廓的颜色
- one string color (e.g color = 'r' ), 所有的标签均为红色
- a tuple of matplotlib color args (string, float, rgb, etc), 不同的标签按照指定的颜色标记
- inline - bool, optional . 默认True(在标签位值移除轮廓线,也即标签覆盖轮廓线,而非穿越)
- inline_spacing - float, optional,默认5,放置内联时,标签两侧留有的像素空间
- fmt - string or dict, optional, 默认'%1.3f ',保留小数位。1.3中的1表示输出位宽,3表示小数位长度,此时实际数据会覆盖掉该数据对应的轮廓线;当9.3时,轮廓线会被覆盖掉9个位置,同时小数点后保留3位,也就是说,轮廓线移除的长度大于数据长度
- manual - bool or iterable, optional , 手动添加标签。忽略该字典
- rightside_up - bool, optional,默认 True(标签旋转均以正负90度计)
- use_clabeltext - bool, optional,默认False,若为True,则用 `ClabelText` class (instead of `Text`) 创建标签,当使用“CababelTress”绘制文本时,会重新计算文本的旋转角度,因此,如果轴的角度发生变化时,可以使用“CababelTress”来旋转角度。
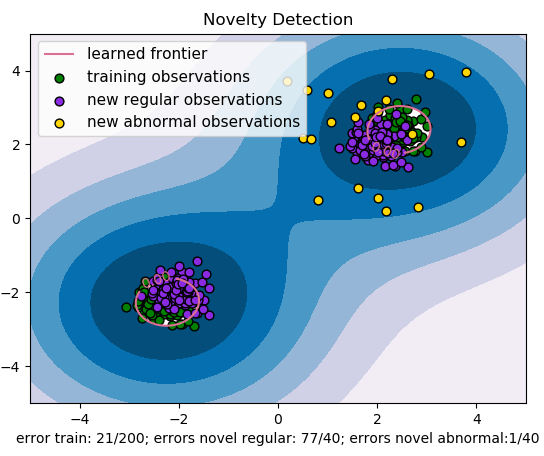
举例:One-class SVM
import numpy as np

import matplotlib.pyplot as plt

import matplotlib.font_manager

from sklearn import svm

xx, yy = np.meshgrid(np.linspace(-5, 5, 500), np.linspace(-5, 5, 500))

# Generate train data

X = 0.3 * np.random.randn(100, 2)

X_train = np.r_[X + 2.4, X - 2.3]

X_test = np.r_[X + 2, X - 2]

# Generate some abnormal novel observations

X_outliers = np.random.uniform(low=0.1, high=4, size=(20, 2))

# fit the model

clf = svm.OneClassSVM(nu=0.1, kernel='rbf', gamma=0.1)

clf.fit(X_train)

y_pred_train = clf.predict(X_train)

y_pred_test = clf.predict(X_test)

y_pred_outliers = clf.predict(X_outliers)

n_error_train = y_pred_train[y_pred_train == -1].size

n_error_test = y_pred_test[y_pred_test == -1].size

n_error_outlier = y_pred_outliers[y_pred_outliers == 1].size

# plot the line , the points, and the nearest vectors to the plane

Z = clf.decision_function(np.c_[xx.ravel(), yy.ravel()])

Z = Z.reshape(xx.shape)

plt.title("Novelty Detection")

# 填充等高线图

plt.contourf(xx, yy, Z, levels=np.linspace(Z.min(), 0, 7), cmap=plt.cm.PuBu)

# 绘制等高线

a = plt.contour(xx, yy, Z, levels=[0, Z.max()], colors='palevioletred')

s = 40

b1 = plt.scatter(X_train[:, 0], X_train[:, 1], c='green', s=s, edgecolors='k')

b2 = plt.scatter(X_test[:, 0], X_test[:, 1], c='blueviolet', s=s, edgecolors='k')

c = plt.scatter(X_outliers[:, 0], X_outliers[:, 1], c='gold', s=s, edgecolors='k')

plt.axis('tight')

plt.xlim((-5, 5))

plt.ylim((-5, 5))

plt.legend([a.collections[0], b1, b2, c],

           ["learned frontier", 'training observations',

            "new regular observations", "new abnormal observations"],

           loc="upper left",

           prop=matplotlib.font_manager.FontProperties(size=11))

plt.xlabel("error train: %d/200; errors novel regular: %d/40; errors novel abnormal:%d/40" %

           (n_error_train, n_error_test, n_error_outlier))

plt.show()
参考文献:
【1】基于matplotlib的数据可视化 - 等高线 contour 与 contourf
matplotlib---画等高线的更多相关文章
- matplotlib画图实例:pyplot、pylab模块及作图參数
http://blog.csdn.net/pipisorry/article/details/40005163 Matplotlib.pyplot画图实例 {使用pyplot模块} matplotli ...
- MatplotLib常用基本操作
本文记录matlibplot常用基本操作,都是基本功能,不涉及复杂联合操作,其中各用法详细用法可参考官网: 1. 基本画图操作 ##mofan_matplotlib.pyplot import mat ...
- matplotlib等高线图-【老鱼学matplotlib】
等高线图是在地理课中讲述山峰山谷时绘制的图形,在机器学习中也会被用在绘制梯度下降算法的图形中. 因为等高线的图有三个信息:x, y以及x,y所对应的高度值. 这个高度值的计算我们用一个函数来表述: # ...
- 基于matplotlib的数据可视化 - 等高线 contour 与 contourf
contour 与contourf 是绘制等高线的利器. contour - 绘制等高线 contourf - 填充等高线 两个的返回值值是一样的(return values are the sam ...
- matplotlib绘制等高线图
参考自Matplotlib Python 画图教程 (莫烦Python)(12)_演讲•公开课_科技_bilibili_哔哩哔哩 https://www.bilibili.com/video/av16 ...
- python+matplotlib 绘制等高线
python+matplotlib 绘制等高线 步骤有七: 有一个m*n维的矩阵(data),其元素的值代表高度 构造两个向量:x(1*n)和y(1*m).这两个向量用来构造网格坐标矩阵(网格坐标矩阵 ...
- python之《matplotlib》
# _*_coding:utf-8_*_# /usr/bin/env python3# Author:book Mikiimport matplotlib.pyplot as pltimport nu ...
- matplotlib的学习10-Contours 等高线图
import matplotlib.pyplot as plt import numpy as np ''' 画等高线 数据集即三维点 (x,y) 和对应的高度值,共有256个点. 高度值使用一个 h ...
- python安装numpy、scipy和matplotlib等whl包的方法
最近装了python和PyCharm开发环境,但是在安装numpy和matplotlib等包时出现了问题,现总结一下在windows平台下的安装方法. 由于现在找不到了工具包新版本的exe文件,所以采 ...
- matplotlib 高级用法实例--共享x轴
http://localhost:8888/notebooks/duanqs/matplotlib_advanced_example.ipynb 我不会弄呀, 刚才从matplotlib文档里吧示例用 ...
随机推荐
- MySQL实战45讲学习笔记:第二十二讲
一.引子 不知道你在实际运维过程中有没有碰到这样的情景:业务高峰期,生产环境的 MySQL 压力太大,没法正常响应,需要短期内.临时性地提升一些性能. 我以前做业务护航的时候,就偶尔会碰上这种场景.用 ...
- [LeetCode] 15. 3Sum 三数之和
Given an array S of n integers, are there elements a, b, c in S such that a + b + c = 0? Find all un ...
- 阿里Sentinel控制台源码修改-对接Apollo规则持久化
改造背景 前面我们讲解了如何对接Apollo来持久化限流的规则,对接后可以直接通过Apollo的后台进行规则的修改,推送到各个客户端实时生效. 但还有一个问题就是Sentinel控制台没有对接Apol ...
- markdown格式接口文档模板
源文件 https://files.cnblogs.com/files/bincoding/%E6%8E%A5%E5%8F%A3%E6%96%87%E6%A1%A3.zip 目录 测试接口 查询指定项 ...
- pgsql 的函数
因为pgsql中没有存储过程和包,所以类似功能通过函数来实现 PostgreSQL的存储过程简单入门 http://blog.csdn.net/rachel_luo/article/details/8 ...
- ng 打包给路径添加前缀
1.ng build --base --href /前缀名/--common - chunk --output-hashing=all --optimization 2.更改ts和html中的路径,将 ...
- pta作业错误点--总结
pta作业错误点--总结 注释:在做pta题目的时候,发现有许多题目的错误点是值得归纳总结起来的,今后翻阅博客园的时候能够明白之前有哪些是可以值得复习的. 7-2 换硬币 习题2-3 求平方与倒数序列 ...
- java内存简单描述
分为四块:data segment,code segment,堆,栈. data segment :数据段,存放静态变量,字符串常量. code segment:代码段,存放代码. 栈:存放局部变量. ...
- scala中的Option
Scala中Option是用来表示一个可选类型 什么是可选? --> 主要是指 有值(Some) 和 无值(None)-->Some和None是Option的子类 val myMap:Ma ...
- WPF DataGrid横向显示
前言 利用各种变换,将其水平改向至横向显示. 注意的是要固定好单元格的高宽,或者手动编写style 否者在滚动的时候,会有高宽比例不一样的时候 再其次,要注意datagrid的容器或者datagrid ...