如何区分prometheus中Histogram和Summary类型的metrics?
要理解它们的区别,关键还是告业务应用。
但如何在学习时,如何区分呢?
有以下几个维度:
histogram有bucket,summary在quatile。
summary分位数是客户端计算上报,histogram中位数涉及服务端计算。
具体可以参看如下两个链接:
https://yunlzheng.gitbook.io/prometheus-book/parti-prometheus-ji-chu/promql/prometheus-metrics-types
https://songjiayang.gitbooks.io/prometheus/content/concepts/metric-types.html
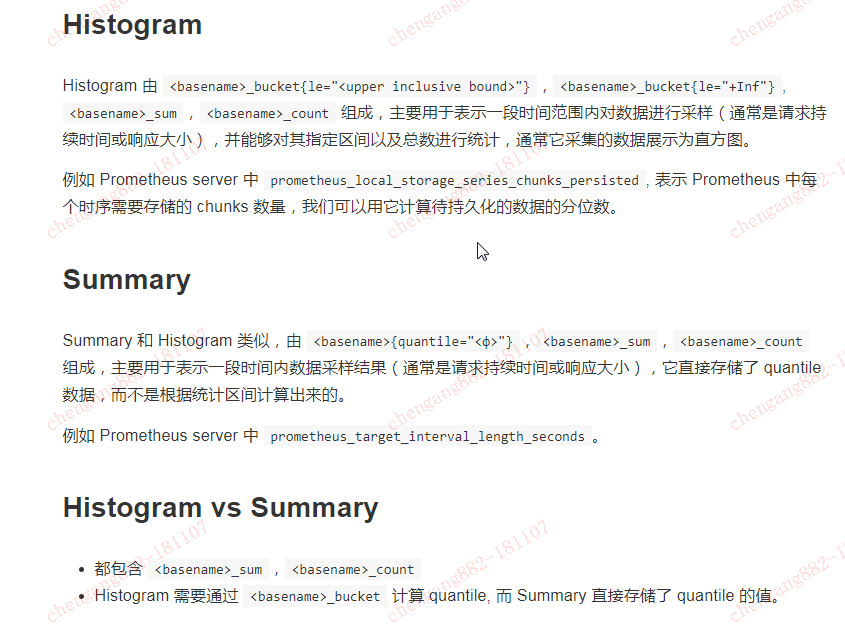
Histogram
Histogram 由 <basename>_bucket{le="<upper inclusive bound>"},<basename>_bucket{le="+Inf"}, <basename>_sum,<basename>_count 组成,主要用于表示一段时间范围内对数据进行采样(通常是请求持续时间或响应大小),并能够对其指定区间以及总数进行统计,通常它采集的数据展示为直方图。
例如 Prometheus server 中 prometheus_local_storage_series_chunks_persisted, 表示 Prometheus 中每个时序需要存储的 chunks 数量,我们可以用它计算待持久化的数据的分位数。
Summary
Summary 和 Histogram 类似,由 <basename>{quantile="<φ>"},<basename>_sum,<basename>_count 组成,主要用于表示一段时间内数据采样结果(通常是请求持续时间或响应大小),它直接存储了 quantile 数据,而不是根据统计区间计算出来的。
例如 Prometheus server 中 prometheus_target_interval_length_seconds。
Histogram vs Summary
都包含 <basename>_sum,<basename>_count
Histogram 需要通过 <basename>_bucket 计算 quantile, 而 Summary 直接存储了 quantile 的值。
====================================
使用Histogram和Summary分析数据分布情况
除了Counter和Gauge类型的监控指标以外,Prometheus还定义分别定义Histogram和Summary的指标类型。Histogram和Summary主用用于统计和分析样本的分布情况。
在大多数情况下人们都倾向于使用某些量化指标的平均值,例如CPU的平均使用率、页面的平均响应时间。这种方式的问题很明显,以系统API调用的平均响应时间为例:如果大多数API请求都维持在100ms的响应时间范围内,而个别请求的响应时间需要5s,那么就会导致某些WEB页面的响应时间落到中位数的情况,而这种现象被称为长尾问题。
为了区分是平均的慢还是长尾的慢,最简单的方式就是按照请求延迟的范围进行分组。例如,统计延迟在0~10ms之间的请求数有多少而10~20ms之间的请求数又有多少。通过这种方式可以快速分析系统慢的原因。Histogram和Summary都是为了能够解决这样问题的存在,通过Histogram和Summary类型的监控指标,我们可以快速了解监控样本的分布情况。
例如,指标prometheus_tsdb_wal_fsync_duration_seconds的指标类型为Summary。 它记录了Prometheus Server中wal_fsync处理的处理时间,通过访问Prometheus Server的/metrics地址,可以获取到以下监控样本数据:
# HELP prometheus_tsdb_wal_fsync_duration_seconds Duration of WAL fsync.
# TYPE prometheus_tsdb_wal_fsync_duration_seconds summary
prometheus_tsdb_wal_fsync_duration_seconds{quantile="0.5"} 0.012352463
prometheus_tsdb_wal_fsync_duration_seconds{quantile="0.9"} 0.014458005
prometheus_tsdb_wal_fsync_duration_seconds{quantile="0.99"} 0.017316173
prometheus_tsdb_wal_fsync_duration_seconds_sum 2.888716127000002
prometheus_tsdb_wal_fsync_duration_seconds_count 216
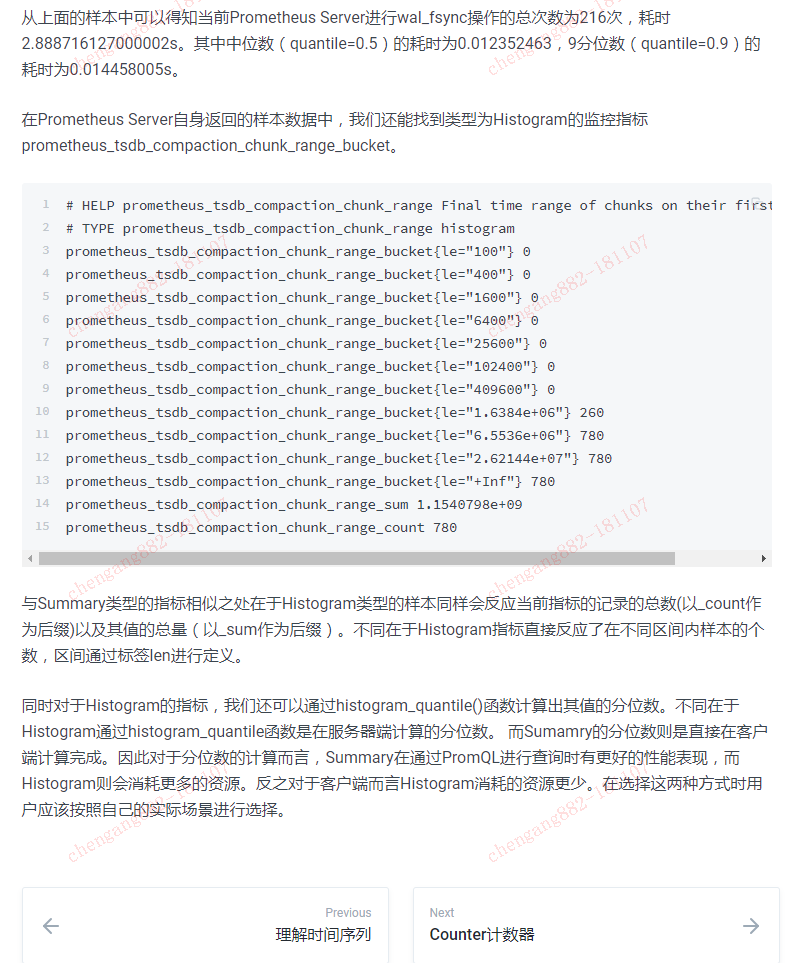
从上面的样本中可以得知当前Prometheus Server进行wal_fsync操作的总次数为216次,耗时2.888716127000002s。其中中位数(quantile=0.5)的耗时为0.012352463,9分位数(quantile=0.9)的耗时为0.014458005s。
在Prometheus Server自身返回的样本数据中,我们还能找到类型为Histogram的监控指标prometheus_tsdb_compaction_chunk_range_bucket。
# HELP prometheus_tsdb_compaction_chunk_range Final time range of chunks on their first compaction
# TYPE prometheus_tsdb_compaction_chunk_range histogram
prometheus_tsdb_compaction_chunk_range_bucket{le="100"} 0
prometheus_tsdb_compaction_chunk_range_bucket{le="400"} 0
prometheus_tsdb_compaction_chunk_range_bucket{le="1600"} 0
prometheus_tsdb_compaction_chunk_range_bucket{le="6400"} 0
prometheus_tsdb_compaction_chunk_range_bucket{le="25600"} 0
prometheus_tsdb_compaction_chunk_range_bucket{le="102400"} 0
prometheus_tsdb_compaction_chunk_range_bucket{le="409600"} 0
prometheus_tsdb_compaction_chunk_range_bucket{le="1.6384e+06"} 260
prometheus_tsdb_compaction_chunk_range_bucket{le="6.5536e+06"} 780
prometheus_tsdb_compaction_chunk_range_bucket{le="2.62144e+07"} 780
prometheus_tsdb_compaction_chunk_range_bucket{le="+Inf"} 780
prometheus_tsdb_compaction_chunk_range_sum 1.1540798e+09
prometheus_tsdb_compaction_chunk_range_count 780
与Summary类型的指标相似之处在于Histogram类型的样本同样会反应当前指标的记录的总数(以_count作为后缀)以及其值的总量(以_sum作为后缀)。不同在于Histogram指标直接反应了在不同区间内样本的个数,区间通过标签len进行定义。
同时对于Histogram的指标,我们还可以通过histogram_quantile()函数计算出其值的分位数。不同在于Histogram通过histogram_quantile函数是在服务器端计算的分位数。 而Sumamry的分位数则是直接在客户端计算完成。因此对于分位数的计算而言,Summary在通过PromQL进行查询时有更好的性能表现,而Histogram则会消耗更多的资源。反之对于客户端而言Histogram消耗的资源更少。在选择这两种方式时用户应该按照自己的实际场景进行选择。
如何区分prometheus中Histogram和Summary类型的metrics?的更多相关文章
- Controller 中Action 返回值类型 及其 页面跳转的用法
•Controller 中Action 返回值类型 View – 返回 ViewResult,相当于返回一个View 页面. -------------------------------- ...
- [C++]C++中的运行时类型检测
Date:2014-1-3 Summary: 使用C++中的运行时类型检测.(文章重点在于记录本人的使用情况,并非深层讨论RTTI) Contents:写习惯C#的我,在C++依然存在哪些.NET的惯 ...
- JavaScript Array 对象方法 以及 如何区分javascript中的toString()、toLocaleString()、valueOf()方法
1.concat() 2.join() 3.pop() 4.push() 5.reverse() 6.shift() 7.unshift() 8.slice() 9.sort() 10.splice( ...
- C#中的常量、类型推断和作用域
一.常量 常量是其值在使用过程中不会发生变化的变量.在声明和初始化变量时,在变量前面家关键字const,就可以把该变量指定为一个常量: const int a=100;//a的值将不可以改变 常量的特 ...
- C# 中的基本数值类型
在之前的文章中(地址:https://www.vinanysoft.com/c-sharp-basics/introducing/),以 HelloWorld 程序为基础,介绍 C# 语言.它的结构. ...
- cassandra表中主键的类型
cassandra表中主键的类型及区分? 一.类型及区分 二.参考文章 一.类型及区分 Cassandra的4种Key Primary Key 主键 Composite Key,Compound Ke ...
- SQL数据库中字段类型 与C#中的对应字段类型
数据库中的字段类型和对应的C#中的对应字段类型 数据库 C#程序int int32text stringbigint int64binary System.Byte[] ...
- 【AspNetCore】【WebApi】扩展Webapi中的RouteConstraint中,让DateTime类型,支持时间格式化(DateTimeFormat)
扩展Webapi中的RouteConstraint中,让DateTime类型,支持时间格式化(DateTimeFormat) 一.背景 大家在使用WebApi时,会用到DateTime为参数,类似于这 ...
- java中基本类型和包装类型实践经验
至今,小菜用java快两年了,有些事,也该有个总结. 基本类型和包装类型的概念在本文不作赘述. 如果这两种类型直接使用,倒没什么值得讨论的,无非就是自动装箱拆箱,java可以让你感觉不到他们的存在,但 ...
随机推荐
- 别在int与float上栽跟头
int与float是我们每天编程都用的两种类型,但是我们真的足够了解它们吗.昨天在博客园看到一个比较老的笑话: “昨天晚上下班回家,一民警迎面巡逻而来.突然对我大喊:站住!民警:int 类型占几个字节 ...
- BZOJ 4540 [Hnoi2016]序列 | 莫队 详细题解
传送门 BZOJ 4540 题解 --怎么说呢--本来想写线段树+矩阵乘法的-- --但是嘛--yali的机房太热了--困--写不出来-- 于是弃疗,写起了莫队.(但是我连莫队都想不出来!) 首先用单 ...
- git push --set-upstream
我在本地建了一个分支wangxiao,开发完之后,提交代码 git add .git commit -m '注释'git push 出现下面的问题,这个意思是:当前分支没有与远程分支关联. 因此导致了 ...
- pandas重置索引的几种方法探究
pandas重置索引的几种方法探究 reset_index() reindex() set_index() 函数名字看起来非常有趣吧! 不仅如此. 需要探究. http://nbviewer.jupy ...
- 10个造型奇特的css3进度条(有的html被编辑器转义了,上面的代码还是OK的)。。。转载
<div id="caseVerte"> <div id="case1"></div> <div id="c ...
- 20155203 2016-2017-2 《Java程序设计》第7周学习总结
20155203 2016-2017-2 <Java程序设计>第6周学习总结 教材学习内容总结 1.Lambda表达式.(使用interface函数接口) 2.Lambda的方法参考Met ...
- Linux - awk 文本处理工具三
AWK 文件打印匹配 格式示例 awk '/Tom/' file # 打印匹配到得行 awk '/^Tom/{print $1}' # 匹配Tom开头的行 打印第一个字段 awk '$1 !~ /ly ...
- Hive笔记之宏(macro)
一.啥是宏 宏可以看做是一个简短的函数,或者是对一个表达式取别名,同时可以将这个表达式中的一些值做成变量调用时传入,比较适合于做分析时为一些临时需要用到很多次的表达式操作封装一下取个简短点的别名来调用 ...
- Hive笔记之Fetch Task
在使用Hive的时候,有时候只是想取表中某个分区的前几条的记录看下数据格式,比如一个很常用的查询: select * from foo where partition_column=bar limit ...
- 在vue-cli下读取模拟数据请求服务器
写此记录时vue脚手架的webpack是3.6.0 此文章方法亦可用于vue-cli3,直接在vue.config.js里面添加 本记录使用vue-resource,先安装: cnpm install ...