postgresql 去重计数改写案例
最近帮忙在搞一个内网报表系统的项目,里面的逻辑比较复杂,很多视图套视图的语句。
最多的一个视图除了它本身以外,一层层嵌套了7个视图在里面,贼恶心。
SQL遇到性能问题只能每一层视图捋清对象关系来排查缓慢的原因,只看执行计划根本行不通,慢的语句根本跑不出结果。
这两天就遇到个很郁闷的问题,查询视图慢得要死,不过还是给哥解决了。
内网项目不能泄密,本案例SQL是我自己数据模拟的,大家看看就好。
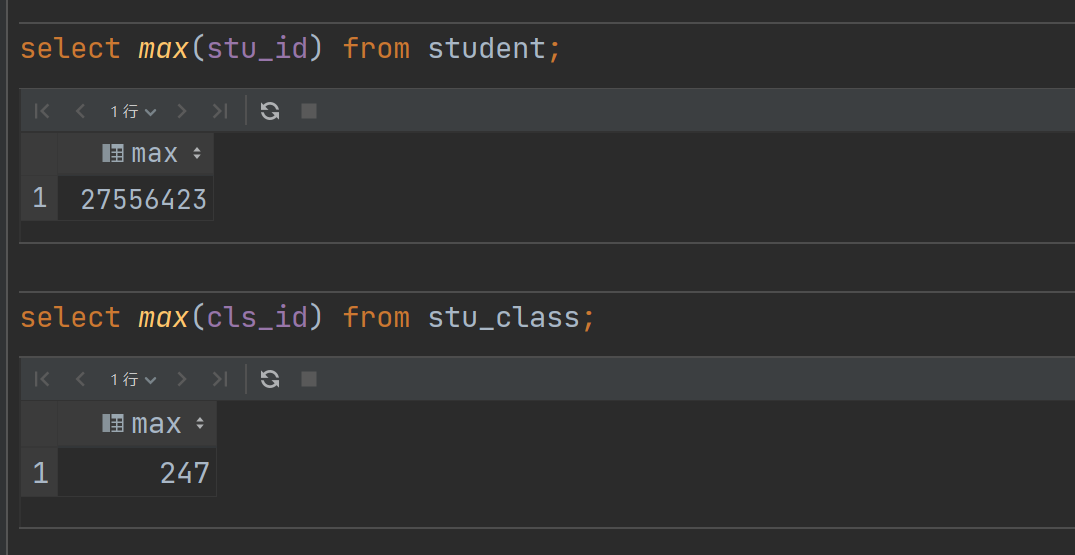
学生表 2千多万行数据、课程表 247 行数据,视图SQL如下:
-- create or replace view view_student

select

    sc.cls_id,

    count(distinct stu_date)

from student s

         left join stu_class sc on s.stu_classid = sc.cls_id

group by sc.cls_id order by 1;
其他报表SQL和这个视图关联统计根本出不来结果,我定位了好久才找到这个视图的问题,其实就是 count(distinct )的性能问题。
哥优化了这么多ORACLE的 SQL 在count(distinct ) 从来都不是瓶颈,今天就栽在PG这里了,先举个简单的例子。
explain analyze

select count(distinct stu_name) from student;

Aggregate  (cost=550713.05..550713.06 rows=1 width=8) (actual time=103819.440..103819.442 rows=1 loops=1)

  ->  Seq Scan on student  (cost=0.00..484627.44 rows=26434244 width=7) (actual time=0.015..1310.280 rows=26434261 loops=1)

Planning Time: 0.082 ms

Execution Time: 103819.479 ms
这种写法在 PG15 用103s,相同语句 ORACLE 仅用了12s (ORACLE这里学生表 3000W行数据,比PG的还更多)。
-- ORACLE

select  count(distinct stu_name) from student;

--------------------------------------------------------------------------------------------------------------------------------------------------

"| Id  | Operation            | Name     | Starts | E-Rows | A-Rows |   A-Time   | Buffers | Reads  | Writes |  OMem |  1Mem | Used-Mem | Used-Tmp|"

--------------------------------------------------------------------------------------------------------------------------------------------------

"|   0 | SELECT STATEMENT     |          |      1 |        |      1 |00:00:12.93 |     160K|  51801 |  51801 |       |       |          |         |"

"|   1 |  SORT AGGREGATE      |          |      1 |      1 |      1 |00:00:12.93 |     160K|  51801 |  51801 |       |       |          |         |"

"|   2 |   VIEW               | VW_DAG_0 |      1 |     26M|     26M|00:00:12.21 |     160K|  51801 |  51801 |       |       |          |         |"

"|   3 |    HASH GROUP BY     |          |      1 |     26M|     26M|00:00:10.74 |     160K|  51801 |  51801 |  1378M|    36M|   82M (1)|     418K|"

"|   4 |     TABLE ACCESS FULL| STUDENT  |      1 |     30M|     30M|00:00:01.40 |     160K|      0 |      0 |       |       |          |         |"

--------------------------------------------------------------------------------------------------------------------------------------------------
所以为什么刚开始我说在ORACLE上没遇到瓶颈,而在PG上就是瓶颈了,也是因为把 ORACLE 优化的思维带入到PG,搞得我排查了好久才找到是这里的性能问题。
换了一种等价的写法后,只需要20S就能跑出结果(PG15 优化器更聪明了,走了 HashAggregate,性能更好提升),但是明显这种算法也不是最好的。
explain analyze

select count(1) from (select distinct stu_name from student ) x ;

Aggregate  (cost=765972.04..765972.05 rows=1 width=8) (actual time=20448.106..20448.108 rows=1 loops=1)

  ->  HashAggregate  (cost=550713.05..646383.71 rows=9567066 width=7) (actual time=10505.357..19778.740 rows=23252100 loops=1)

        Group Key: student.stu_name

        Batches: 5  Memory Usage: 688177kB  Disk Usage: 474152kB

        ->  Seq Scan on student  (cost=0.00..484627.44 rows=26434244 width=7) (actual time=0.041..1350.891 rows=26434261 loops=1)

Planning Time: 0.145 ms

Execution Time: 20537.727 ms
这种语句最好的性能还是得走 IndexOnlyScan ,所以说人的脑袋才是最好的CBO(请允许我装一次逼 嘿嘿)
explain analyze

select

    /*+ IndexOnlyScan(student student_stu_name_index) */

    count(1)

from (select distinct stu_name from student) x;

Aggregate  (cost=882824.16..882824.17 rows=1 width=8) (actual time=5981.763..5981.765 rows=1 loops=1)

  ->  Unique  (cost=0.56..763235.83 rows=9567066 width=7) (actual time=0.024..5296.364 rows=23252100 loops=1)

        ->  Index Only Scan using student_stu_name_index on student  (cost=0.56..697150.22 rows=26434244 width=7) (actual time=0.023..2677.423 rows=26434261 loops=1)

              Heap Fetches: 0

Planning Time: 0.146 ms

Execution Time: 5981.794 ms
人为干预后,这条语句从原来 103 s 到最后 5.9 s 就能跑出结果,质的飞跃。
回到最开始视图的案例本身,先创建个索引:
create index idx_student_classid_stu_date on student(stu_classid,stu_date);
explain analyze

    -- create or replace view view_student as

select /*+ parallel(s 4 hard)  IndexOnlyScan(s idx_student_classid_stu_date) */

    sc.cls_id,

    count(distinct stu_date)

from student s

         left join stu_class sc on s.stu_classid = sc.cls_id

group by sc.cls_id order by 1;

GroupAggregate  (cost=3780941.85..3979201.27 rows=247 width=13) (actual time=11025.449..16154.259 rows=248 loops=1)

  Group Key: sc.cls_id

  ->  Sort  (cost=3780941.85..3847027.50 rows=26434260 width=9) (actual time=11007.958..13205.445 rows=26434261 loops=1)

        Sort Key: sc.cls_id

        Sort Method: external merge  Disk: 532480kB

        ->  Hash Left Join  (cost=9.56..70379.76 rows=26434260 width=9) (actual time=0.340..5058.768 rows=26434261 loops=1)

              Hash Cond: (s.stu_classid = sc.cls_id)

              ->  Gather  (cost=0.00..0.00 rows=26434260 width=8) (actual time=0.293..1290.132 rows=26434261 loops=1)

                    Workers Planned: 4

                    Workers Launched: 4

                    ->  Parallel Index Only Scan using idx_student_classid_stu_date on student s  (cost=0.00..0.00 rows=6608565 width=8) (actual time=0.108..654.199 rows=5286852 loops=5)

                          Heap Fetches: 0

              ->  Hash  (cost=6.47..6.47 rows=247 width=5) (actual time=0.042..0.043 rows=247 loops=1)

                    Buckets: 1024  Batches: 1  Memory Usage: 17kB

                    ->  Seq Scan on stu_class sc  (cost=0.00..6.47 rows=247 width=5) (actual time=0.007..0.022 rows=247 loops=1)

Planning Time: 0.260 ms

Execution Time: 16210.168 ms
这种聚合计算的SQL在报表系统里面适当添加并行对SQL也是一种很好的优化方式,加了4个并行,利用PG独特的并行索引扫描的特性,16s 就能跑出结果。
我们可以对上面的SQL进行等价改写:
explain analyze

-- create or replace view view_student as

select /*+

        parallel(s 4 hard)

        IndexOnlyScan(s idx_student_classid_stu_date)

         */

    sc.cls_id,

    count_stu_date

from (select stu_classid, count(distinct stu_date) count_stu_date

      from student s

      group by stu_classid) s

         inner join stu_class sc

                   on s.stu_classid = sc.cls_id;

Nested Loop  (cost=0.56..937074.01 rows=300 width=13) (actual time=30.679..3782.580 rows=247 loops=1)

  Join Filter: (s.stu_classid = sc.cls_id)

  Rows Removed by Join Filter: 30628

  ->  Seq Scan on stu_class sc  (cost=0.00..6.47 rows=247 width=5) (actual time=0.015..0.127 rows=247 loops=1)

  ->  Materialize  (cost=0.56..935961.26 rows=300 width=12) (actual time=0.062..15.303 rows=125 loops=247)

        ->  Subquery Scan on s  (cost=0.56..935959.76 rows=300 width=12) (actual time=15.235..3778.893 rows=248 loops=1)

              ->  GroupAggregate  (cost=0.56..935956.76 rows=300 width=12) (actual time=15.234..3778.730 rows=248 loops=1)

                    Group Key: s_1.stu_classid

                    ->  Index Only Scan using idx_student_classid_stu_date on student s_1  (cost=0.56..803782.46 rows=26434260 width=8) (actual time=0.020..1929.839 rows=21849736 loops=1)

                          Heap Fetches: 0

Planning Time: 0.185 ms

Execution Time: 3782.708 ms
等价改写完后相同并行下,该SQL只需要 3.7S 就能跑出结果,提升了13s 的时间,这种语句SQL数据量越大,效果越显著。
原来还没有优化之前跑了15分钟还没跑完,太蛋疼了。在生产环境下用这种方式改写优化以后,嵌套这个视图的SQL在 2分钟内就能返回结果。
洗洗睡了,明天还得继续搬砖,系统就快上线了 ,嘿嘿。
postgresql 去重计数改写案例的更多相关文章
- Java使用极小的内存完成对超大数据的去重计数,用于实时计算中统计UV
Java使用极小的内存完成对超大数据的去重计数,用于实时计算中统计UV – lxw的大数据田地 http://lxw1234.com/archives/2015/09/516.htm Java使用极小 ...
- MONGODB03 - 分组计数_分组去重计数(基于 spring-data-mongodb)
前因 项目中有查询MongoDB单表统计相关功能,涉及到MongoDB数据聚合相关操作,其中在多字段分组去重计数相关操作API上资料较少,spring-data-mongodb相关的API介绍也不够直 ...
- HyperLogLog(不精确的去重计数方案)
pfadd 用法和sadd一样 pfcount 用法和scard一样 127.0.0.1:6379> get lan (nil) 127.0.0.1:6379> pfadd lan js ...
- PostgreSQL性能优化综合案例 - 1
[测试模型] 设计一个包含INSERT, UPDATE, SELECT语句的业务模型用于本优化案例. [测试表] create table user_info (userid int, engname ...
- react框架实现点击事件计数小案例
下面将以一个小案例来讲解react的框架的一般应用,重点内容在代码段都有详细的解释,希望对大家有帮助 代码块: 代码块: import React from 'react'; import React ...
- PostgreSQL性能优化综合案例 - 2
[调优阶段8] 1. 压力测试 pgbench -M prepared -r -c 1 -f /home/postgres/test/login0.sql -j 1 -n -T 180 -h 172. ...
- 1.uniq去重命令讲解
uniq命令: 常见参数: -c,--count ***** 在每行旁边显示改行重复出现的次数 -d,--repeated 仅显示重复出现的行,2次或2次以上的行,默认的去重包 ...
- Storm入门2-单词计数案例学习
[本篇文章主要是通过一个单词计数的案例学习,来加深对storm的基本概念的理解以及基本的开发流程和如何提交并运行一个拓扑] 单词计数拓扑WordCountTopology实现的基本功能就是不停地读入 ...
- 关于distinct 和group by的去重逻辑浅析
在数据库操作中,我们常常遇到需要将数据去重计数的工作.例如: 表A,列col A C A B C D A B 结果就是一共出现4个不同的字母A.B.C.D 即结果为4 大体上我们可以选择count(d ...
- MySQL—增删改查,分组,连表,limit,union,alter,排序,去重
MySQL增删改查 在表格的增删改查中,查的内容是最多的,包括group by ,join,limit,union,alter,排序都是服务于查的 #sql语句数据行操作补充 #增加: #insert ...
随机推荐
- yum与软件包
从一个命令开始 yum provides iostat ## 找到软件包名为:sysstat-10.1.5-19.el7.x86_64 安装软件包 yum install sysstat-10.1.5 ...
- 基础版本:用KNN算法实现预测facebook签到位置模型的训练(内含数据集下载)
实现模型的训练一般的流程便是 # 导包 # 导入数据 # 数据处理 # 特征工程 # KNN算法预估流程 # 模型评估 接下来便实现以上流程 实现该模型训练我们需要导入一下的函数 1 # 导包 2 3 ...
- 手动安装vur-router并引用
安装并引用 安装 npm install vue-router 引用 步骤一:在src路径下,创建router文件夹, 其下创建index.js // router/index.js import V ...
- openpyxl 统一表格样式
# 统一表格样式 rows = ws.max_row columns = ws.max_column # print(rows) # print(columns) for row in range(1 ...
- Unity的IFilterBuildAssemblies:深入解析与实用案例
Unity IFilterBuildAssemblies Unity IFilterBuildAssemblies是Unity引擎中的一个非常有用的功能,它可以让开发者在构建项目时自定义哪些程序集需要 ...
- 牛客小白月赛65 E题 题解
原题链接 题意描述 构造一个\(1\)到\(n\)的排列,使得其中正好有\(k\)个二元组\((i, j)\)满足,\(1\le i\lt j\le n\) && \(a_i - a_ ...
- 开源.NetCore通用工具库Xmtool使用连载 - HTTP请求篇
[Github源码] <上一篇> 介绍了Xmtool工具库中的XML操作类库,今天我们继续为大家介绍其中的HTTP请求类库. 在现如今的软件需求场景中,HTTP网络请求几乎是开发过程中必然 ...
- Kioptrix Level 1
Kioptrix这个系列靶机默认是桥接模式,如果我们kali使用NAT是扫描不到靶机的,通过VM的靶机网络设置也不能更改成功. 解决方式:每次下载好靶机先不导入VM,如果已经导入,需要"移除 ...
- 5.0 CRC32校验技术概述
CRC校验技术是用于检测数据传输或存储过程中是否出现了错误的一种方法,校验算法可以通过计算应用与数据的循环冗余校验(CRC)检验值来检测任何数据损坏.通过运用本校验技术我们可以实现对特定内存区域以及磁 ...
- Python 网页爬虫原理及代理 IP 使用
一.Python 网页爬虫原理 Python 是一种高效的编程语言,在 Web 开发和数据分析领域广受欢迎.Python 的优秀模块使其更加适合大规模数据处理和 Web 服务的编程.网络爬虫是 Pyt ...