Kubernetes监控手册06-监控APIServer
写在前面
如果是用的公有云托管的 Kubernetes 集群,控制面的组件都交由云厂商托管的,那作为客户的我们就省事了,基本不用操心 APIServer 的运维。个人也推荐使用云厂商这个服务,毕竟 Kubernetes 还是有点复杂的,升级也不好搞,我们自己来维护整个集群,性价比有点低。当然,如果因为各种原因最后我们还是要维护控制面这些组件,那就要好好看看本系列接下来的几篇博客了。
黑盒测试
APIServer 在 Kubernetes 架构中非常核心,是所有 API 的入口,APIServer 也暴露了 metrics 数据,我们尝试获取一下:
[root@tt-fc-dev01.nj etcd]# ss -tlpn|grep apiserver

LISTEN 0      128                *:6443             *:*    users:(("kube-apiserver",pid=164445,fd=7))

[root@tt-fc-dev01.nj etcd]# curl -s http://localhost:6443/metrics

Client sent an HTTP request to an HTTPS server.

[root@tt-fc-dev01.nj etcd]# curl -s -k https://localhost:6443/metrics

{

  "kind": "Status",

  "apiVersion": "v1",

  "metadata": {},

  "status": "Failure",

  "message": "forbidden: User \"system:anonymous\" cannot get path \"/metrics\"",

  "reason": "Forbidden",

  "details": {},

  "code": 403

}
解释一下上面的命令和结果。首先我通过 ss 命令查看 apiserver 模块监听在哪些端口,发现这个进程在 6443 端口有监听。然后,使用 curl 命令请求 6443 的 metrics 接口,结果又说这是一个 HTTPS Server,不能用 HTTP 协议请求。好,那我用 HTTPS 协议请求,自签证书,加了 -k 参数,返回 Forbidden,说没权限访问 /metrics 接口。OK,那看来是需要 Token 鉴权,我们创建一下相关的 ServiceAccount。
准备认证信息
下面的内容可以保存为 auth-server.yaml。
---

apiVersion: rbac.authorization.k8s.io/v1

kind: ClusterRole

metadata:

  name: categraf

rules:

  - apiGroups: [""]

    resources:

      - nodes

      - nodes/metrics

      - nodes/stats

      - nodes/proxy

      - services

      - endpoints

      - pods

    verbs: ["get", "list", "watch"]

  - apiGroups:

      - extensions

      - networking.k8s.io

    resources:

      - ingresses

    verbs: ["get", "list", "watch"]

  - nonResourceURLs: ["/metrics", "/metrics/cadvisor"]

    verbs: ["get"]

---

apiVersion: v1

kind: ServiceAccount

metadata:

  name: categraf

  namespace: flashcat

---

apiVersion: rbac.authorization.k8s.io/v1

kind: ClusterRoleBinding

metadata:

  name: categraf

roleRef:

  apiGroup: rbac.authorization.k8s.io

  kind: ClusterRole

  name: categraf

subjects:

- kind: ServiceAccount

  name: categraf

  namespace: flashcat
在上一节《Kubernetes监控手册05-监控Kubelet》中,我们为 daemonset 创建过认证信息,那个认证信息主要是用于调用 kubelet 的接口。而这次我们要调用的是 apiserver 的接口,所以增加了一些权限点,当然,上例 yaml 中给出的权限点有点多,没关系,反正都是只读的,后面再需要其他权限的时候,省的再创建新的 ServiceAccount 了。与上一讲相比,这次 ServiceAccount 名字改成了 categraf,与上一讲用到的 ServiceAccount 区分开。
通过下面的命令创建相关内容,然后查看一下是否创建成功:
[root@tt-fc-dev01.nj yamls]# kubectl apply -f auth-server.yaml -n flashcat

clusterrole.rbac.authorization.k8s.io/categraf unchanged

serviceaccount/categraf unchanged

clusterrolebinding.rbac.authorization.k8s.io/categraf unchanged

[root@tt-fc-dev01.nj yamls]# kubectl get sa categraf -n flashcat

NAME       SECRETS   AGE

categraf   1         7h13m

[root@tt-fc-dev01.nj yamls]# kubectl get sa categraf -n flashcat -o yaml

apiVersion: v1

kind: ServiceAccount

metadata:

  annotations:

    kubectl.kubernetes.io/last-applied-configuration: |

      {"apiVersion":"v1","kind":"ServiceAccount","metadata":{"annotations":{},"name":"categraf","namespace":"flashcat"}}

  creationTimestamp: "2022-11-28T05:00:17Z"

  name: categraf

  namespace: flashcat

  resourceVersion: "127151612"

  uid: 8b473b31-ce09-4abe-ae55-ea799160a9d5

secrets:

- name: categraf-token-6whbs

[root@tt-fc-dev01.nj yamls]# kubectl get secret categraf-token-6whbs -n flashcat

NAME                   TYPE                                  DATA   AGE

categraf-token-6whbs   kubernetes.io/service-account-token   3      7h15m
上例中,因为我之前创建过了,所以显示的是 unchanged,获取 sa 的时候,可以看到 AGE 已经七个多小时了。通过 -o yaml 可以看到 sa 对应的 secret 的名字,最下面那一行,可以看到 secret 名字是 categraf-token-6whbs。然后我们用这个 secret 中的 token 来调用一下 APIServer 试试:
[root@tt-fc-dev01.nj yamls]# token=`kubectl get secret categraf-token-6whbs -n flashcat -o jsonpath={.data.token} | base64 -d`

[root@tt-fc-dev01.nj yamls]# curl -s -k -H "Authorization: Bearer $token" https://localhost:6443/metrics > metrics

[root@tt-fc-dev01.nj yamls]# head -n 6 metrics

# HELP aggregator_openapi_v2_regeneration_count [ALPHA] Counter of OpenAPI v2 spec regeneration count broken down by causing APIService name and reason.

# TYPE aggregator_openapi_v2_regeneration_count counter

aggregator_openapi_v2_regeneration_count{apiservice="*",reason="startup"} 0

aggregator_openapi_v2_regeneration_count{apiservice="k8s_internal_local_delegation_chain_0000000002",reason="update"} 0

aggregator_openapi_v2_regeneration_count{apiservice="v1beta1.metrics.k8s.io",reason="add"} 0

aggregator_openapi_v2_regeneration_count{apiservice="v1beta1.metrics.k8s.io",reason="update"} 0
OK,这个新的 Token 是可以获取到数据的了,权限认证通过。
采集原理
既然 Token 已经有了,采集器抓取 APIServer 的数据的时候,只要在 Header 里传入这个 Token 理论上就可以拿到数据了。如果 APIServer 是二进制方式部署,咱们就直接通过 Categraf 的 Prometheus 插件来抓取就可以了。如果 APIServer 是部署在 Kubernetes 的容器里,咱们最好是使用服务发现机制来做。
支持 Kubernetes 服务发现的 agent 有不少,但是要说最原汁原味的还是 Prometheus 自身,Prometheus 新版本(v2.32.0)支持了 agent mode 模式,即把 Prometheus 进程当做采集器 agent,采集了数据之后通过 remote write 方式传给中心(这里使用早就准备好的 Nightingale 作为数据接收服务端)。那这里我就使用 Prometheus 的 agent mode 方式来采集 APIServer。
部署 agent mode prometheus
首先准备一下 Prometheus agent 需要的配置文件,我们做成一个 ConfigMap:
apiVersion: v1

kind: ConfigMap

metadata:

  name: prometheus-agent-conf

  labels:

    name: prometheus-agent-conf

  namespace: flashcat

data:

  prometheus.yml: |-

    global:

      scrape_interval: 15s

      evaluation_interval: 15s

    scrape_configs:

      - job_name: 'apiserver'

        kubernetes_sd_configs:

        - role: endpoints

        scheme: https

        tls_config:

          insecure_skip_verify: true

        authorization:

          credentials_file: /var/run/secrets/kubernetes.io/serviceaccount/token

        relabel_configs:

        - source_labels: [__meta_kubernetes_namespace, __meta_kubernetes_service_name, __meta_kubernetes_endpoint_port_name]

          action: keep

          regex: default;kubernetes;https

    remote_write:

    - url: 'http://10.206.0.16:19000/prometheus/v1/write'
可以把上面的内容保存为 prometheus-agent-configmap.yaml,然后 kubectl -f prometheus-agent-configmap.yaml 创建一下即可。
有了配置了,下面我们就可以部署 Prometheus 了,要把 Prometheus 进程当做 agent 来用,需要启用这个 feature,通过命令行参数 --enable-feature=agent 即可轻松启用了,我们把 agent mode 模式的 Prometheus 部署成一个 Deployment,单副本。
apiVersion: apps/v1

kind: Deployment

metadata:

  name: prometheus-agent

  namespace: flashcat

  labels:

    app: prometheus-agent

spec:

  replicas: 1

  selector:

    matchLabels:

      app: prometheus-agent

  template:

    metadata:

      labels:

        app: prometheus-agent

    spec:

      serviceAccountName: categraf

      containers:

        - name: prometheus

          image: prom/prometheus

          args:

            - "--config.file=/etc/prometheus/prometheus.yml"

            - "--web.enable-lifecycle"

            - "--enable-feature=agent"

          ports:

            - containerPort: 9090

          resources:

            requests:

              cpu: 500m

              memory: 500M

            limits:

              cpu: 1

              memory: 1Gi

          volumeMounts:

            - name: prometheus-config-volume

              mountPath: /etc/prometheus/

            - name: prometheus-storage-volume

              mountPath: /prometheus/

      volumes:

        - name: prometheus-config-volume

          configMap:

            defaultMode: 420

            name: prometheus-agent-conf

        - name: prometheus-storage-volume

          emptyDir: {}
要特别注意 serviceAccountName: categraf 这一行内容别忘记了,以上 yaml 内容保存为 prometheus-agent-deployment.yaml,然后 apply 一下:
[work@tt-fc-dev01.nj yamls]$ kubectl apply -f prometheus-agent-deployment.yaml

deployment.apps/prometheus-agent created
可以通过 kubectl logs <podname> -n flashcat 查看刚才创建的 prometheus-agent-xx 那个 Pod 的日志,如果没有报错,理论上就问题不大了。
查看监控数据
在即时查询里查一下 apiserver_request_total 这个指标,如果可以查到,就说明数据上报是正常的。孔飞老师之前整理过夜莺的 Kubernetes / Apiserver 监控大盘,可以导入测试,地址在这里。效果如下:
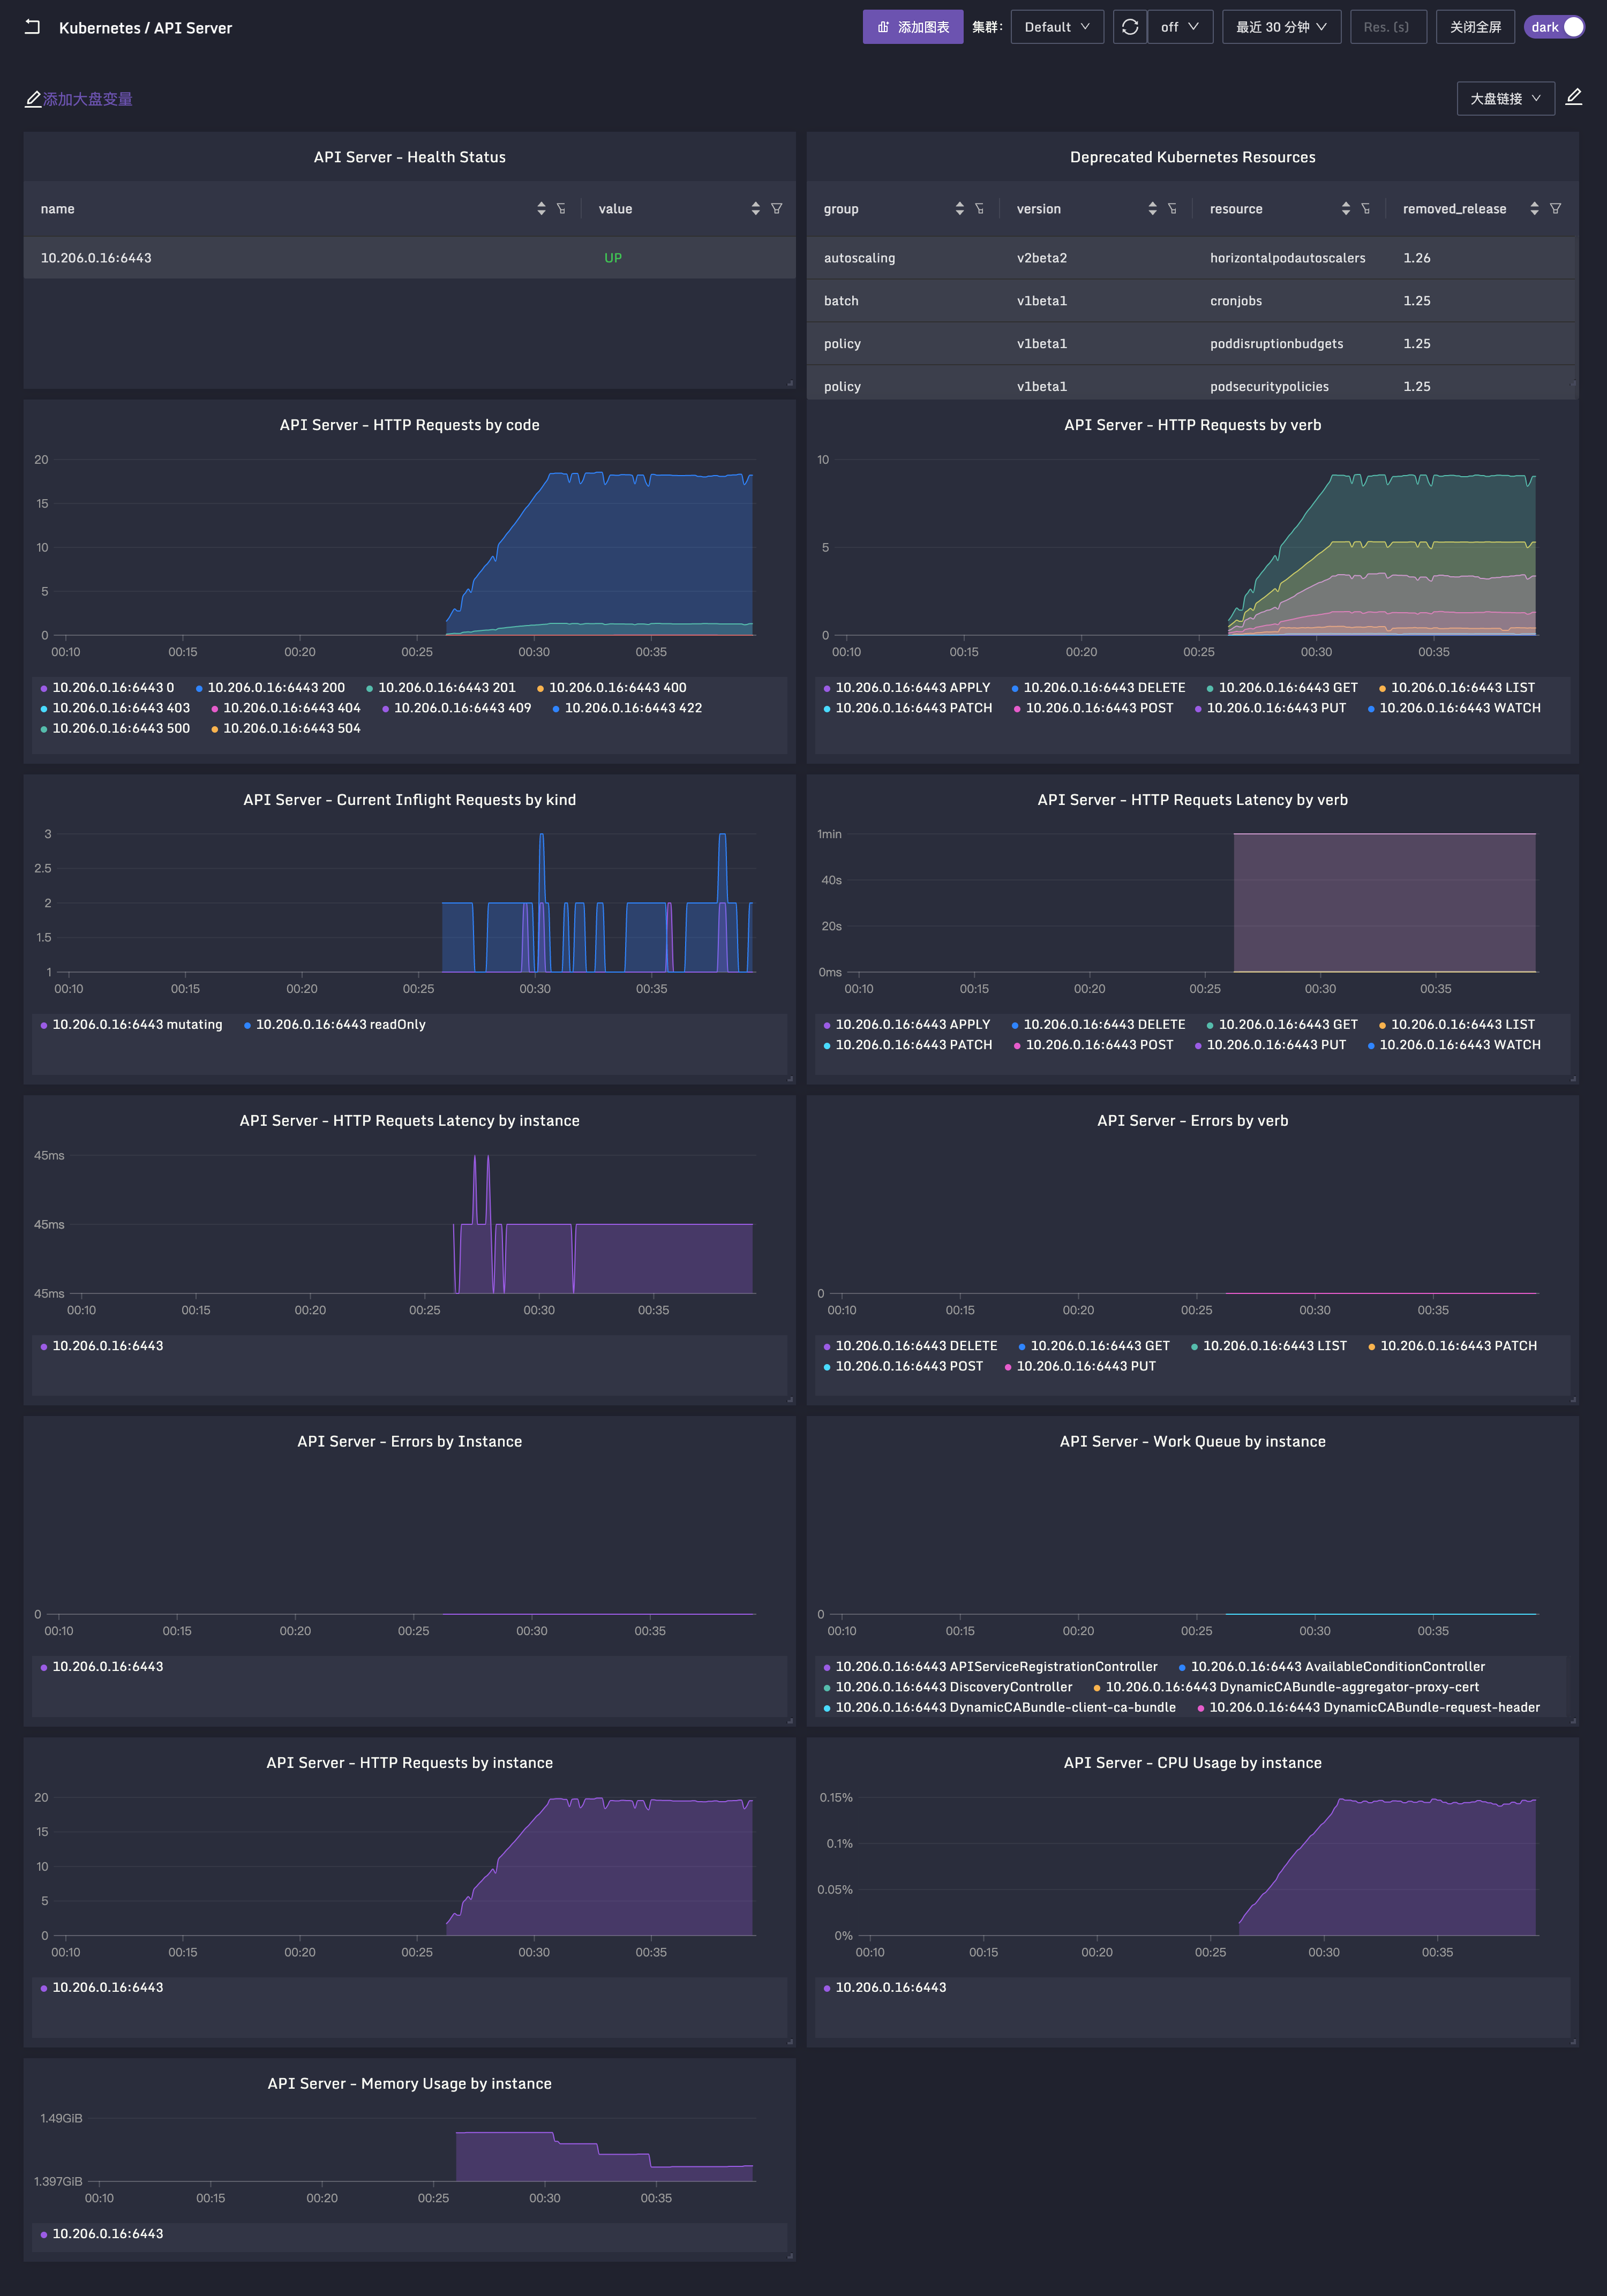
另外,Apiserver 的关键指标的含义,孔飞老师也做了整理,我也给摘过来了:
# HELP apiserver_request_duration_seconds [STABLE] Response latency distribution in seconds for each verb, dry run value, group, version, resource, subresource, scope and component.

# TYPE apiserver_request_duration_seconds histogram

apiserver响应的时间分布,按照url 和 verb 分类

一般按照instance和verb+时间 汇聚

# HELP apiserver_request_total [STABLE] Counter of apiserver requests broken out for each verb, dry run value, group, version, resource, scope, component, and HTTP response code.

# TYPE apiserver_request_total counter

apiserver的请求总数,按照verb、 version、 group、resource、scope、component、 http返回码分类统计

# HELP apiserver_current_inflight_requests [STABLE] Maximal number of currently used inflight request limit of this apiserver per request kind in last second.

# TYPE apiserver_current_inflight_requests gauge

最大并发请求数, 按mutating(非get list watch的请求)和readOnly(get list watch)分别限制

超过max-requests-inflight(默认值400)和max-mutating-requests-inflight(默认200)的请求会被限流

apiserver变更时要注意观察,也是反馈集群容量的一个重要指标

# HELP apiserver_response_sizes [STABLE] Response size distribution in bytes for each group, version, verb, resource, subresource, scope and component.

# TYPE apiserver_response_sizes histogram

apiserver 响应大小,单位byte, 按照verb、 version、 group、resource、scope、component分类统计

# HELP watch_cache_capacity [ALPHA] Total capacity of watch cache broken by resource type.

# TYPE watch_cache_capacity gauge

按照资源类型统计的watch缓存大小

# HELP process_cpu_seconds_total Total user and system CPU time spent in seconds.

# TYPE process_cpu_seconds_total counter

每秒钟用户态和系统态cpu消耗时间, 计算apiserver进程的cpu的使用率

# HELP process_resident_memory_bytes Resident memory size in bytes.

# TYPE process_resident_memory_bytes gauge

apiserver的内存使用量(单位:Byte)

# HELP workqueue_adds_total [ALPHA] Total number of adds handled by workqueue

# TYPE workqueue_adds_total counter

apiserver中包含的controller的工作队列,已处理的任务总数

# HELP workqueue_depth [ALPHA] Current depth of workqueue

# TYPE workqueue_depth gauge

apiserver中包含的controller的工作队列深度,表示当前队列中要处理的任务的数量,数值越小越好

例如APIServiceRegistrationController admission_quota_controller
相关文章
- Kubernetes监控手册01-体系介绍
- Kubernetes监控手册02-宿主监控概述
- Kubernetes监控手册03-宿主监控实操
- Kubernetes监控手册04-监控Kube-Proxy
- Kubernetes监控手册05-监控Kubelet
关于作者
本文作者秦晓辉,Flashcat合伙人,文章内容是Flashcat技术团队共同沉淀的结晶,作者做了编辑整理,我们会持续输出监控、稳定性保障相关的技术文章,文章可转载,转载请注明出处,尊重技术人员的成果。
如果对 Nightingale、Categraf、Prometheus 等技术感兴趣,欢迎加入我们的微信群组,联系我(picobyte)拉入部落,和社区同仁一起探讨监控技术。
Kubernetes监控手册06-监控APIServer的更多相关文章
- Kubernetes监控手册-01体系概述
Kubernetes 监控体系驳杂,涉及到的内容非常多,总是感觉摸不到头绪,网上虽然有很多资料,都略显凌乱,没有一个体系化的讲解,今天开始,我们准备撰写一系列文章,把 Kubernetes 监控说透, ...
- (转)实验文档4:kubernetes集群的监控和日志分析
改造dubbo-demo-web项目为Tomcat启动项目 Tomcat官网 准备Tomcat的镜像底包 准备tomcat二进制包 运维主机HDSS7-200.host.com上:Tomcat8下载链 ...
- 高可用Kubernetes集群-14. 部署Kubernetes集群性能监控平台
参考文档: Github介绍:https://github.com/kubernetes/heapster Github yaml文件: https://github.com/kubernetes/h ...
- Kubernetes集群的监控报警策略最佳实践
版权声明:本文为博主原创文章,未经博主同意不得转载. https://blog.csdn.net/M2l0ZgSsVc7r69eFdTj/article/details/79652064 本文为Kub ...
- kubernetes 安装手册(成功版)
管理组件采用staticPod或者daemonSet形式跑的,宿主机os能跑docker应该本篇教程能大多适用安装完成仅供学习和实验 本次安裝的版本: Kubernetes v1.10.0 (1.10 ...
- Prometheus 监控K8S Node监控
Prometheus 监控K8S Node监控 Prometheus社区提供的NodeExporter项目可以对主机的关键度量指标进行监控,通过Kubernetes的DeamonSet可以在各个主机节 ...
- 【干货】解密监控宝Docker监控实现原理
分享人高驰涛(Neeke),云智慧高级架构师,PHP 开发组成员,同时也是 PECL/SeasLog 的作者.8 年研发管理经验,早期从事大规模企业信息化研发架构,09 年涉足互联网数字营销领域并深入 ...
- nagios监控linux主机监控内存脚本
说明 工作包括两部分监控端(一二三)和被监控端(四) 一.nrpe.cfg中添加脚本 nrpe.cfg中添加命令索引 command[check_used_mem]=/usr/local/nagios ...
- 探索Windows Azure 监控和自动伸缩系列2 - 获取虚拟机的监控定义和监控数据
上一篇博文介绍了如何连接Windows Azure: http://www.cnblogs.com/teld/p/5113063.html 本篇我们继续上次的示例代码,获取虚拟机的监控定义和监控数据. ...
- 指导手册06:HBase安装部署
指导手册06:HBase安装部署 配置环境 1.参考文件: https://www.cnblogs.com/lzxlfly/p/7221890.html https://www.cnblogs.com ...
随机推荐
- Docker 安装,常用命令
安装Docker 官方所有操作系统安装教程:Install Docker Engine on CentOS | Docker Documentation,其中CentOS安装docker引擎的代码: ...
- 携手数字人、数字空间、XR平台,阿里云与伙伴共同建设“新视界”
简介:2022阿里云视觉计算私享会:加速虚拟与现实的交互. 引言:2022年互联网行业里XR.数字孪生.虚拟现实等领域再次"翻红".新旧概念频出,不少人相信这些技术将给当下的互联 ...
- 性能提升一倍!云原生网关支持 TLS 硬件加速
简介:业界在优化 HTTPS 的性能上也做了诸多探索,传统的软件优化方案有 Session 复用.OCSP Stapling.False Start.dynamic record size.TLS1. ...
- WebAssembly + Dapr = 下一代云原生运行时?
简介: 云计算已经成为了支撑数字经济发展的关键基础设施.云计算基础设施也在持续进化,从 IaaS,到容器即服务(CaaS),再到 Serverless 容器和函数 PaaS (fPaaS 或者 Faa ...
- [FAQ] VScode 用户代码片段设置
以PHP为示例,配置如下: { "dpe": { "prefix": "dpe", "body": [ " ...
- [PHP] 浅谈 Laravel Authorization 的 gates 与 policies
首先要区分 Authentication 与 Authorization,认证和授权,粗细有别. 授权(Authorization) 有两种主要方式,Gates 和 Policies. Gates 和 ...
- Prometheus+Grafana+alertmanager构建企业级监控系统(三)
七.Prometheus监控扩展 7.1 Promethues 采集tomcat监控数据 tomcat_exporter地址:https://github.com/nlighten/tomcat_ex ...
- STM32F10X 部分引脚不能使用的问题
一.概述 说来惭愧,我到现在都没有完整的学习过STM32.接触 STM32 还是突然的一个项目,需要用到 STM32,紧急需求,只能边学边完成.不过好在 ST 的资料还是比较多的,相对也比较简单,基本 ...
- ADV7123驱动VGA显示色条
VGA显示色条-基于ADV7123 用ADV7123代替权电阻网络,执行数模转换,差别在于rgb都变成8位,显示的色彩更多.控制端口多了3个:像素时钟,复合同步信号(不用就置0),消隐信号. 相对权电 ...
- 记录一个解决固定定位内容不能滚动的方法(vant组件tab必用的css样式)
vant组件下边是循环出来的,在开发中这部分必定是个单独的组件,内容溢出时添加滚动的样式,当然这个需要写在外部引入的自定义的vant组件样式当中 .van-tabs__content{ width: ...