事后调试之MiniDump转储
程序发布后,针对在用户使用过程中出现的一些问题进行调试,这个过程可以称为是事后调试。在程序Crash时转储MiniDump文件供软件开发工程师分析是一种比较常用的方法。下面介绍两种常用的在程序Crash时转储MiniDump文件的方法。
1. MiniDumpWriteDump
MiniDumpWriteDump是windows DbgHelp.dll提供的一个转储进程MiniDump的API,可以将其导入到C#程序中。
     using System;

     using System.Diagnostics;

     using System.IO;

     using System.Runtime.InteropServices;

     using System.Threading;

     public class MiniDumpUtil

     {

         [DllImport("kernel32.dll")]

         private static extern int GetCurrentThreadId();

         [DllImport("DbgHelp.dll")]

         private static extern bool MiniDumpWriteDump(IntPtr hProcess, int processId, IntPtr fileHandle, MiniDumpType dumpType, ref MiniDumpExceptionInfo excepInfo, IntPtr userInfo, IntPtr extInfo);

         [DllImport("DbgHelp.dll")]

         private static extern bool MiniDumpWriteDump(IntPtr hProcess, int processId, IntPtr fileHandle, MiniDumpType dumpType, IntPtr excepParam, IntPtr userInfo, IntPtr extInfo);

         public static bool TryWriteMiniDump(string dmpFileName, MiniDumpType dmpType)

         {

             using (FileStream stream = new FileStream(dmpFileName, FileMode.OpenOrCreate))

             {

                 Process process = Process.GetCurrentProcess();

                 MiniDumpExceptionInfo exceptionInfo = new MiniDumpExceptionInfo();

                 exceptionInfo.ThreadId = GetCurrentThreadId();

                 exceptionInfo.ExceptionPointers = Marshal.GetExceptionPointers();

                 exceptionInfo.ClientPointers = true;

                 if (exceptionInfo.ExceptionPointers == IntPtr.Zero)

                 {

                     return MiniDumpWriteDump(process.Handle, process.Id, stream.SafeFileHandle.DangerousGetHandle(), dmpType, IntPtr.Zero, IntPtr.Zero, IntPtr.Zero);

                 }

                 else

                 {

                     return MiniDumpWriteDump(process.Handle, process.Id, stream.SafeFileHandle.DangerousGetHandle(), dmpType, ref exceptionInfo, IntPtr.Zero, IntPtr.Zero);

                 }

             }

         }

     }

     [Flags]

     public enum MiniDumpType

     {

         MiniDumpNormal = 0x00000000,

         MiniDumpWithDataSegs = 0x00000001,

         MiniDumpWithFullMemory = 0x00000002,

         MiniDumpWithHandleData = 0x00000004,

         MiniDumpFilterMemory = 0x00000008,

         MiniDumpScanMemory = 0x00000010,

         MiniDumpWithUnloadedModules = 0x00000020,

         MiniDumpWithIndirectlyReferencedMemory = 0x00000040,

         MiniDumpFilterModulePaths = 0x00000080,

         MiniDumpWithProcessThreadData = 0x00000100,

         MiniDumpWithPrivateReadWriteMemory = 0x00000200,

         MiniDumpWithoutOptionalData = 0x00000400,

         MiniDumpWithFullMemoryInfo = 0x00000800,

         MiniDumpWithThreadInfo = 0x00001000,

         MiniDumpWithCodeSegs = 0x00002000,

         MiniDumpWithoutAuxiliaryState = 0x00004000,

         MiniDumpWithFullAuxiliaryState = 0x00008000,

         MiniDumpWithPrivateWriteCopyMemory = 0x00010000,

         MiniDumpIgnoreInaccessibleMemory = 0x00020000,

         MiniDumpWithTokenInformation = 0x00040000,

         MiniDumpWithModuleHeaders = 0x00080000,

         MiniDumpFilterTriage = 0x00100000,

         MiniDumpValidTypeFlags = 0x001fffff

     }

     public struct MiniDumpExceptionInfo

     {

         public int ThreadId;

         public IntPtr ExceptionPointers;

         public bool ClientPointers;

     }
这里要注意的一点是当前线程的ID,不能用当前线程的托管线程ID(即Thread.CurrentThread.ManagedThreadId),而是用当前线程的操作系统ID(即OSID),否则用windbg加载dump文件时可能会出现一些错误信息:
ERROR: Unable to find system thread 1
ERROR: The thread being debugged has either exited or cannot be accessed
ERROR: Many commands will not work properly
当然,这似乎对调试影响并不是很大,切换线程很容易通过windbg命令完成。
可以简单地在未处理异常中转储进程的MiniDump
     class Program

     {

         static void Main(string[] args)

         {

             AppDomain.CurrentDomain.UnhandledException += new UnhandledExceptionEventHandler(CurrentDomain_UnhandledException);

             TestMethod(-);

         }

         static void CurrentDomain_UnhandledException(object sender, UnhandledExceptionEventArgs e)

         {

             MiniDumpUtil.TryWriteMiniDump("E:\\dump\\test.dmp", MiniDumpType.MiniDumpWithFullMemory);

         }

         static void TestMethod(int num)

         {

             if (num < )

             {

                 throw new ArgumentException("The argument 'num' is less than zero!");

             }

         }

     }
运行程序后,会生成test.dmp文件,用windbg加载该dump文件,设置pdb路径,可以分析异常信息。以下是采用windbg分析输出的一些信息:
Loading Dump File [E:\dump\test.dmp]
User Mini Dump File with Full Memory: Only application data is available
Symbol search path is: srv*
Executable search path is:
Windows 7 Version 7600 MP (4 procs) Free x86 compatible
Product: WinNt, suite: SingleUserTS
Machine Name:
Debug session time: Tue Oct 29 21:42:14.000 2013 (UTC + 8:00)
System Uptime: 0 days 2:42:59.907
Process Uptime: not available
...............................
This dump file has an exception of interest stored in it.
The stored exception information can be accessed via .ecxr.
(168.1474): CLR exception - code e0434352 (first/second chance not available)
eax=fffffffd ebx=038b0d78 ecx=0013d7f8 edx=77886194 esi=038b0d38 edi=0013d898
eip=77886194 esp=0013d558 ebp=0013d568 iopl=0 nv up ei pl zr na pe nc
cs=001b ss=0023 ds=0023 es=0023 fs=003b gs=0000 efl=00000246
ntdll!KiFastSystemCallRet:
77886194 c3 ret
0:000> .sympath+ E:\dump
Symbol search path is: srv*;E:\dump
Expanded Symbol search path is: cache*;SRV*http://msdl.microsoft.com/download/symbols;e:\dump
0:000> .loadby sos clr
0:000> !pe
Exception object: 017eb58c
Exception type: System.ArgumentException
Message: The argument 'num' is less than zero!
InnerException: <none>
StackTrace (generated):
SP IP Function
0013EC98 002B00E6 DumpUtilDemo!DumpUtilDemo.Program.Main(System.String[])+0x76
StackTraceString: <none>
HResult: 80070057
加粗部分是输入的调试命令,具体命令这里不作过多的说明。
2. Windows Error Reporting - Local Dump
Windows系统在 Server 2008, Vista SP1以后的版本中,Windows Error Reporting能够自动转储Crash程序的Dump文件。可以通过修改注册表来设定Dump文件的路径,类型等等。
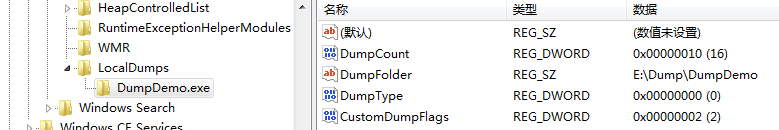
运行regedit打开注册表,找到注册表项 HKEY_LOCAL_MACHINE\SOFTWARE\Microsoft\Windows\Windows Error Reporting\LocalDumps ,如果没有可以自己建。这里包括以下几个值:
(1) DumpFolder 转储Dump文件的目录,默认路径为%LOCALAPPDATA%\CrashDumps
(2) DumpCount 最大Dump数,若转储的Dump数超出该限制,则会以最新转储的Dump文件替换最早的
(3) DumpType 即Dump的类型,1-Mini Dump 2-Full Dump 0-Custom Dump
(4) CustomDumpFlags 该值仅在DumpType=0时有效,可以定制转储Dump的内容。可以取前面定义的枚举类型MiniDumpType中某几个值之和,如MiniDumpWithDataSegs | MiniDumpWithUnloadedModules
如果要针对某一个具体的应用程序来设置的话,可以在LocalDumps下面在以应用程序集的名称建一个项,然后同样要设置上述的几个值。
例如,在上面的程序中将转储进程MiniDump的相关代码去掉,在LocalDumps下创建DumpDemo.exe项,设置DumpType=0,CustomDumpFlags=2(即MiniDumpWithFullMemory),DumpFolder=E:\dump\DumpDemo 。运行程序(DumpDemo.exe)后,在E:\dump\DumpDemo\ 目录下就可以得到一个Dump文件。
事后调试之MiniDump转储的更多相关文章
- 关于Windows系统里的事后调试
我一直在想,应用程序抛出未处理的异常和附加到进程的调试器之间会发生什么.显然这些信息就在我眼皮底下,但我是瞎子.Windows调试器关于事后调试的文档包含了您想要知道的所有详细信息. 最常见的应用程序 ...
- 事后调试.VC_资料01
1.windows中的调试_VC语言_编程开发B1_最全面的网站教程.html(http://study.qqcf.com/web/522/98401.htm) windows中的调试 1.事后调试有 ...
- centos7使用lldb调试netcore应用转储dump文件
centos7下安装lldb,dotnet netcore 进程生成转储文件,并使用lldb进行分析 随着netcore应用在linux上部署的应用越来越多,碰到cpu 100%,内存暴涨的情况也一直 ...
- 使用dbghelp生成dump文件以及事后调试分析
前言 在产品的实际应用环境中,如果我们的程序在客户那里出现了问题,例如程序异常了,而这个时候的现象又不能还原或者很难还原重现,那么只有使用dump文件来保存程序的当前运行信息,例如调用堆栈等,同时使用 ...
- 事后调试.ZC资料
1.查了一下,Delphi 程序 可以生成 map文件,可以用来 根据崩溃的内存报错 定位出错的代码位置 2.但是,Delphi程序 无法再崩溃的时候 生成dump文件 (这个不一定,研究了再说.记得 ...
- Windbg程序调试--转载
WinDbg是微软发布的一款相当优秀的源码级(source-level)调试工具,可以用于Kernel模式调试和用户模式调试,还可以调试Dump文件. WinDbg是微软很重要的诊断调试工具: 可以查 ...
- [转]使用 Minidumps 和 Visual Studio .NET 进行崩溃后调试
本文关键字:Minidumps, Windows, SEH, VisualC, .NET 摘要 本文讲述了 minidumps 是怎样工作的.当你的程序崩溃的时候应该如何生成它们.以及如何在 Visu ...
- SOS 调试扩展 (SOS.dll) 《第五篇》
一.SOS扩展命令 SOS包含几十个命令,要熟练使用SOS,首先要了解SOS有哪些命令.下面给出SOS命令列表. 命令 描述 BPMD [<module name> <method ...
- minidump详细介绍
Effective minidump 简介 在过去几年里,崩溃转储(crash dump)成为了调试工作的一个重要部分.如果软件在客户现场或者测试实验室发生故障,最有价值的解决方式是能够创建一个故障瞬 ...
随机推荐
- 暴力求解——最大乘积 Maximum Product,UVa 11059
最大乘积 Maximum Product 题目链接:http://acm.hust.edu.cn/vjudge/contest/view.action?cid=84562#problem/B 解题思路 ...
- QQ互联 回调地址
http://wiki.connect.qq.com/%E5%9B%9E%E8%B0%83%E5%9C%B0%E5%9D%80%E5%B8%B8%E8%A7%81%E9%97%AE%E9%A2%98% ...
- firefox HackBar组件模拟请求POST请求
组件下载地址:https://addons.mozilla.org/zh-CN/firefox/addon/hackbar/
- Blue Jeans - POJ 3080(多串的共同子串)
题目大意:有M个串,每个串的长度都是60,查找这M个串的最长公共子串(连续的),长度不能小于3,如果同等长度的有多个输出字典序最小的那个. 分析:因为串不多,而且比较短,所致直接暴力枚举的第一个串 ...
- Java调用R(三)_系统命令调用
java通过配置的系统命令Rscript直接调用R脚本. 优点:R脚本和Java代码完全分离 缺点:R中变量不能控制 1. Java本地能够成功调用. public void CallR() { Ru ...
- NOI2015 程序自动分析 prog
何等水题 某神犇仿关押罪犯的写法 却写挂了 然而实际上并不需要补集之类的 #include<iostream> #include<cstring> #include<c ...
- android——api
一.1.复用首页做法—从Intent中获取”com.example.android.apis.Path”.根据这个结合PackageManger获得的Activities来展示不同等级的List界面( ...
- MYSQL 体系结构图
- sync fsync fdatasync ---systemtap跟踪
aa.stp: probe kernel .function ( "sys_sync" ) { printf ( "probfunc:%s fun:%s\n", ...
- TCP的封包与拆包
对于基于TCP开发的通讯程序,有个很重要的问题需要解决,就是封包和拆包. 一.为什么基于TCP的通讯程序需要进行封包和拆包. TCP是个"流"协议,所谓流,就是没有界限的一串数据. ...