SciTech-Mathematics-Probability+Statistics-7 Key Statistics Concepts
7 Key Statistics Concepts Every Data Scientist Must Master
BY BALA PRIYA CPOSTED ON AUGUST 9, 2024
Statistics is one of the must-have skills for all data scientists. But learning statistics can be quite the task.
That's why we put together this guide to help you understand essential statistics concepts for data science. This should give you an overview of the statistics you need to know as a data scientist and explore further on specific topics.
Let's get started.
1. Descriptive Statistics
Descriptive statistics provide a summary of the main features of a dataset for preliminary data analysis. Key metrics include measures of central tendency, dispersion, and shape.
Measures of Central Tendency
These metrics describe the center or typical value of a dataset:
- Mean: Average value, sensitive to outliers
- Median: Middle value, robust to outliers
- Mode: Most frequent value, indicating common patterns
Measures of Dispersion
These metrics describe data spread or variability:
- Range: Difference between highest and lowest values, sensitive to outliers
- Variance: Average squared deviation from the mean, indicating overall data spread.
- Standard deviation: Square root of variance, in the same unit as the data.
Low values indicate data points close to the mean, high values indicate widespread data.
Measures of Shape
These metrics describe the data distribution shape:
- Skewness: Asymmetry of the distribution; Positive for right-skewed, negative for left-skewed
- Kurtosis: "Tailedness" of the distribution;
High values indicate heavy tails(outliers), low values indicate light tails
Understanding these metrics is foundational for further statistical analysis and modeling, helping to characterize the distribution, spread, and central tendencies of your data.
2. Sampling Methods
You need to understand sampling for estimating population characteristics. When sampling, you should ensure that these samples accurately reflect the population. Let's go over the common sampling methods.
Random Sampling
Random sampling minimizes bias, ensuring the samples are representative enough. In this, you assign unique numbers to population members and use a random number generator to select the samples at random.
Stratified Sampling
Ensures representation of all subgroups. Stratified sampling divides population into homogeneous strata(such as age, gender) and randomly samples from each stratum proportional to its size.
Cluster Sampling
Cluster sampling is cost-effective for large, spread-out populations. In this, divide population into clusters (such as geographical areas), randomly select clusters, and sample all or randomly select members within chosen clusters.
Systematic Sampling
Systematic sampling is another technique that ensures evenly spread samples.
You assign unique numbers, determine sampling interval (k), randomly select a starting point, and select every k-th member.
Choosing the right sampling method ensures the design effectiveness of study and more representative samples. This in turn improves the reliability of conclusions.
3. Probability Distributions
Probability distributions represent the likelihood of different outcomes. When you’re starting out, you should learn about the normal, binomial, poisson, and exponential distributions—each with its properties and applications.
Normal Distribution
Many real-world distributions follow normal distribution which has the following properties:
Symmetric around the mean, with mean, median, and mode being equal. The normal distribution is characterized by mean (µ) and standard deviation (σ).
As an empirical rule, ~68% of data within one standard deviation, ~95% within two, and ~99.7% within three.
It’s also important to talk about Central Limit Theorem (CLT) when talking about normal distributions. In simple terms, the CLT states that with a large enough sample size, the sampling distribution of the sample mean approximates a normal distribution.
Binomial Distribution
Binomial distribution is used to model the expected number of successes in n independent Bernoulli trials. Each binomial trial has only two possible outcomes: success or failure. The binomial distribution is:
Defined by the probability of success (p)
Suitable for binary outcomes like yes/no or success/failure
Poisson Distribution
Poisson distribution is generally used to model the number of events occurring within a fixed interval of time. It’s especially suited for rare events and has the following properties:
Events are independent and have a fixed average rate (λ) of occurrence
Useful for counting events over continuous domains (time, area, volume)
Exponential Distribution
The exponential distribution is continuous and is used to model the time between events in a Poisson process.
The exponential distribution is:
Characterized by the rate parameter (λ) (which is the inverse of the mean)
Memoryless, meaning the probability of an event occurring in the future is independent of the past
Understanding these distributions helps in modeling various types of data.
4. Hypothesis Testing
Hypothesis testing is a method to make inferences on the population from sample data, determining if there is enough evidence to support a certain condition.
The \(\large Null\ Hypothesis (H0)\) assumes no effect or difference.
Example: Hypothesis that a new drug has no effect on recovery time compared to an existing drug.
The \(\large Alternative\ Hypothesis (H1)\) assumes an effect exists.
A new drug reduces recovery time compared to an existing drug.
\(\large P-value\) is the probability of obtaining results at least as extreme as observed,
assuming H0 is true.
- Low \(\large p-value\) (say ≤ 0.05): Strong evidence against H0; Reject H0.
- High $\large p-value (say > 0.05): Weak evidence against H0; Do not reject H0.
You should also be aware of Type I and Type II errors:
- Type I Error (\(\large \alpha\)): Rejecting H0 when it is true.
Such as concluding the drug is effective when it is not. - Type II Error (\(\large \beta\)): Not rejecting H0 when it is false.
Such as concluding the drug has no effect when it actually does.
The general procedure for hypothesis testing can be summed up as follows:
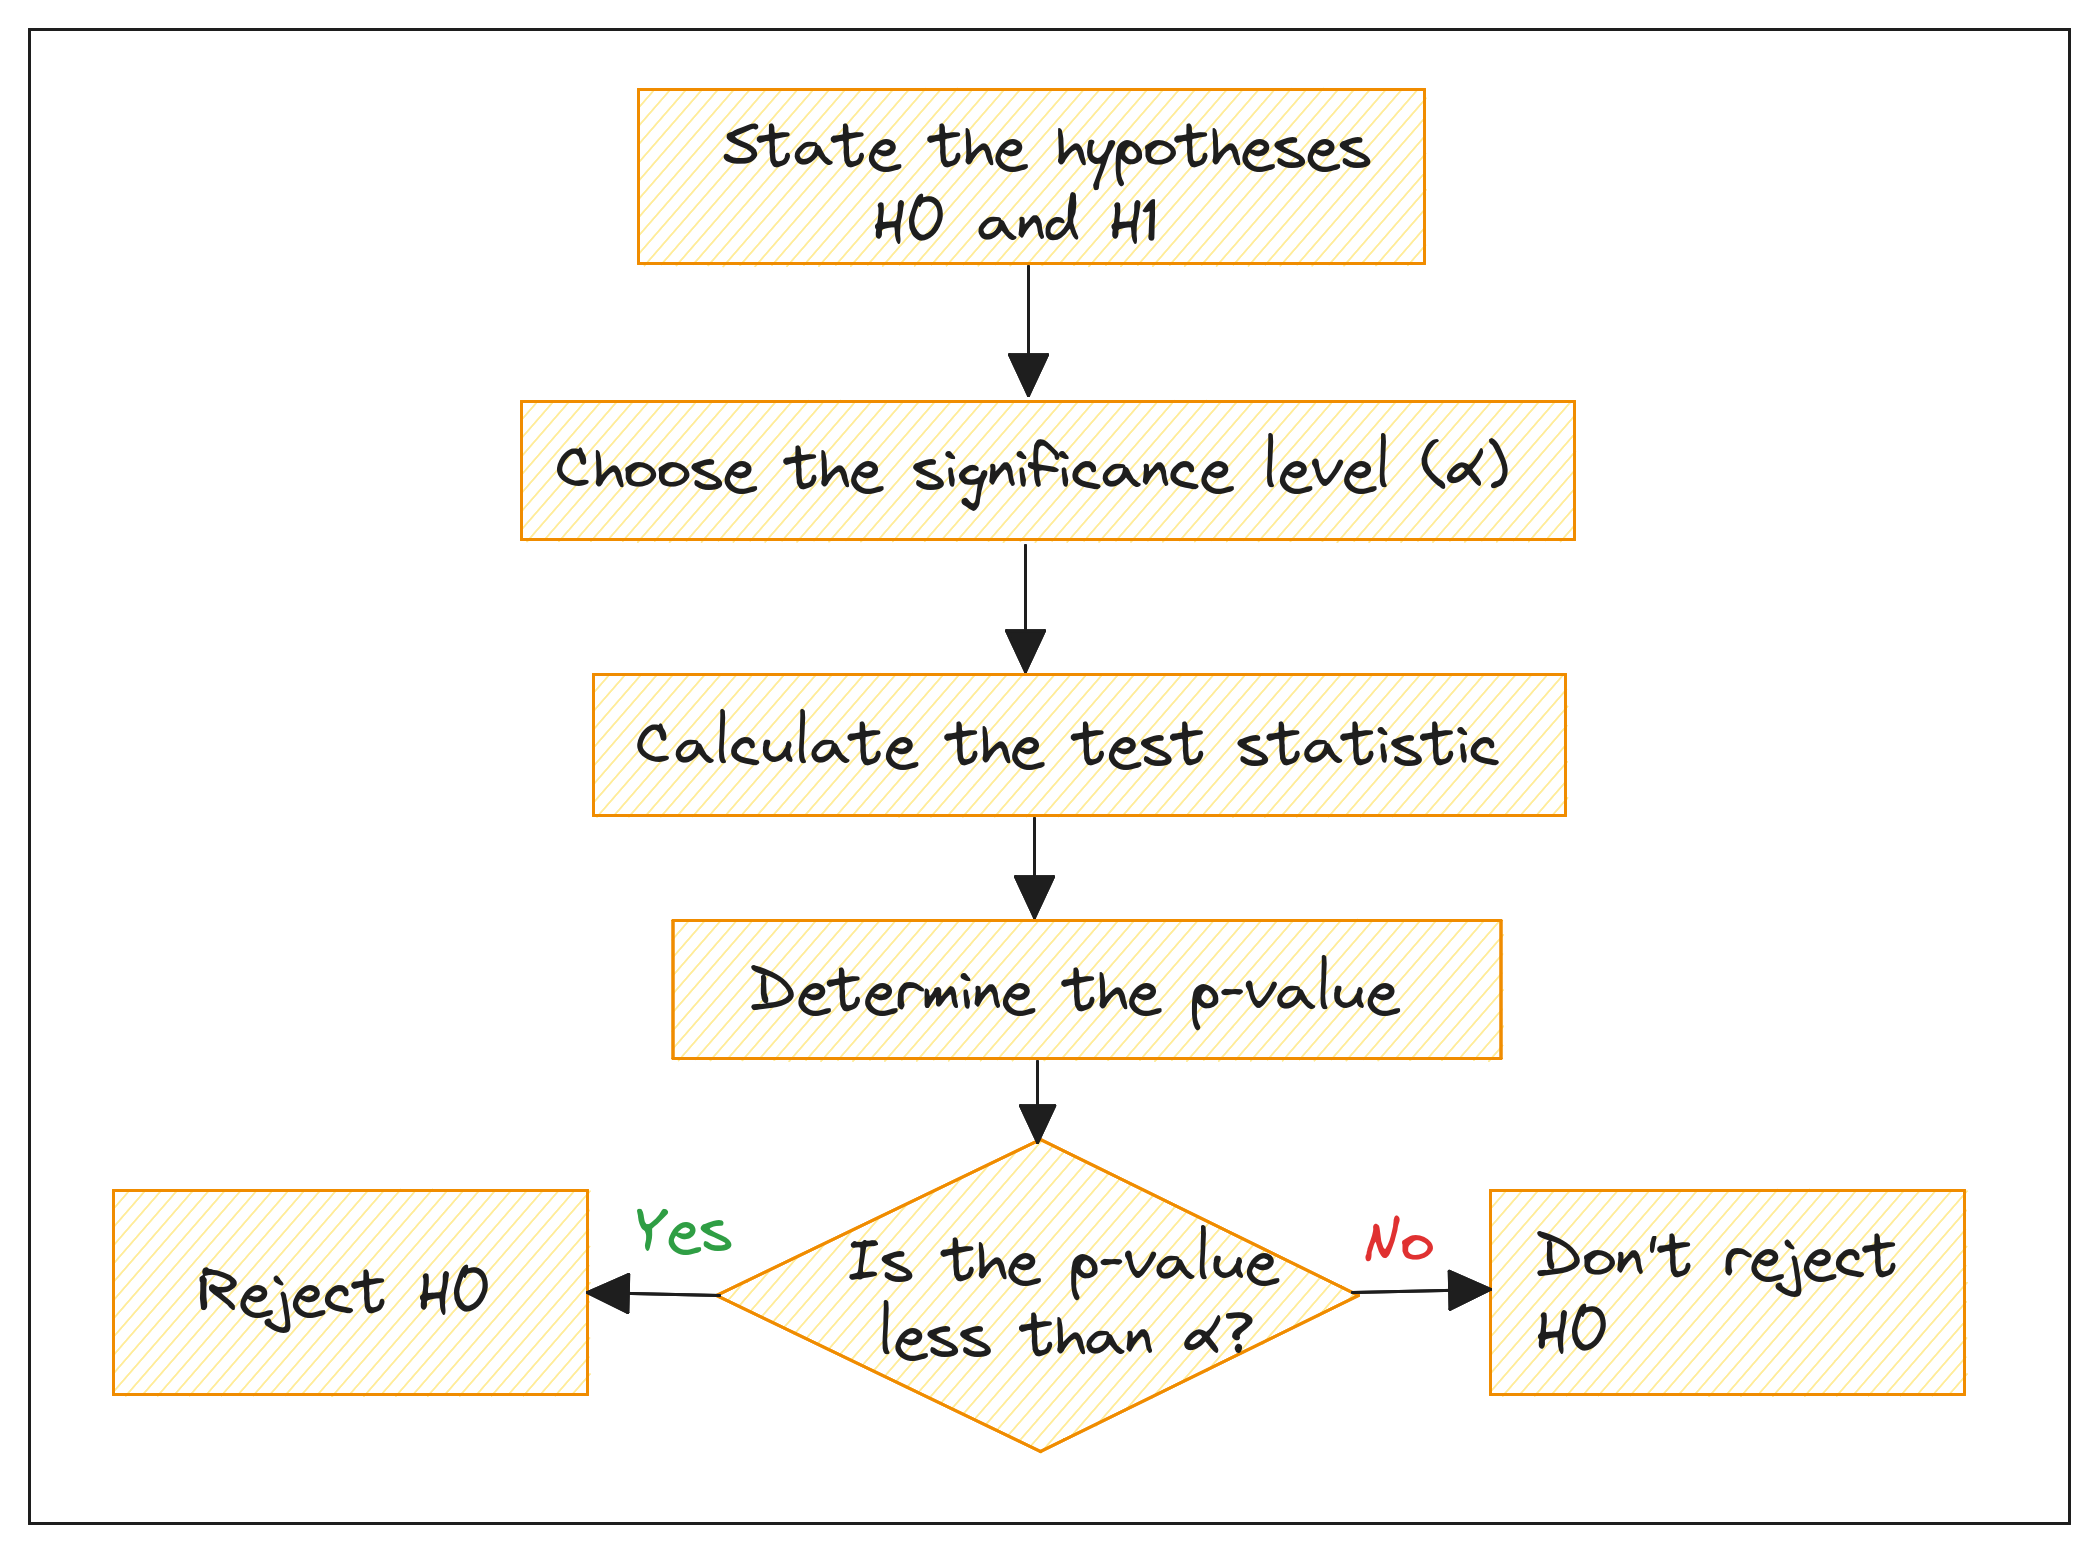
hypothesis-testing
5. Confidence Intervals
A confidence interval (CI) is a range of values derived from sample data,
that is likely to contain the true population parameter.
The confidence level (e.g., 95%) represents the frequency with which the true population parameter would fall within the calculated interval if the experiment were repeated multiple times.
A 95% CI means we are 95% confident that the true population mean lies within the interval.
Suppose the 95% confidence interval for the average price of houses in the city is 64.412K to 65.588K. This means that we are 95% confident that the true average price of all houses in the city lies within this range.
6. Regression Analysis
You should also learn regression analysis to model relationships between a dependent variable and one or more independent variables.
Linear regression models the linear relationship between a dependent variable and an independent variable.
You can use multiple regression to include multiple independent variables. It models the relationship between one dependent variable and two or more independent variables.
Check out Step-by-Step Guide to Linear Regression in Python to learn more about building regression models in Python.
Understanding regression is, therefore, fundamental for predictive modeling and forecasting problems.
7. Bayesian Statistics
Bayesian statistics provides a probabilistic approach to inference, updating beliefs about parameters or hypotheses based on prior knowledge and observed data. Key concepts include Bayes’ theorem, prior distribution, and posterior distribution.
The Bayes' theorem updates the probability of a \(\large hypothesis\ H\) given new \(\large evidence\ E\) :

- \(\large P(H | E)\) : Posterior probability of H given E
- \(\largeP(E | H)\) : Likelihood of E given H
- \(\large P(H)\) : Prior probability of H
- \(\large P(E)\) : Probability of E
The prior distribution represents initial information about a parameter before observing data.
The posterior distribution is the updated probability distribution after considering observed data.
Wrapping Up
I hope you found this guide helpful. This is not an exhaustible list of stats concepts for data science, but it should serve as a good starting point.
If you’re interested in a step-by-step guide to learn statistics, check out 7 Steps to Mastering Statistics for Data Science.
SciTech-Mathematics-Probability+Statistics-7 Key Statistics Concepts的更多相关文章
- Create STATISTICS,UPDATE STATISTICS
该命令在一张表或者索引了的视图上更新查询优化统计数字信息. 默认情况下, 查询优化器已经更新了必要的用来提高查询计划的统计信息; 在某些情况下, 你可以通过使用UPDATE STATISTICS 命令 ...
- Solr In Action 笔记(1) 之 Key Solr Concepts
Solr In Action 笔记(1) 之 Key Solr Concepts 题记:看了下<Solr In Action>还是收益良多的,只是奈何没有中文版,只能查看英语原版有点类,第 ...
- [Hive - LanguageManual] Statistics in Hive
Statistics in Hive Statistics in Hive Motivation Scope Table and Partition Statistics Column Statist ...
- Statistics : Data Distribution
1.Normal distribution In probability theory, the normal (or Gaussian or Gauss or Laplace–Gauss) dist ...
- What Is Mathematics?
What Is Mathematics? The National Council of Teachers of Mathematics (NCTM), the world's largest org ...
- How do I learn mathematics for machine learning?
https://www.quora.com/How-do-I-learn-mathematics-for-machine-learning How do I learn mathematics f ...
- How do I learn machine learning?
https://www.quora.com/How-do-I-learn-machine-learning-1?redirected_qid=6578644 How Can I Learn X? ...
- What are some good books/papers for learning deep learning?
What's the most effective way to get started with deep learning? 29 Answers Yoshua Bengio, ...
- Machine Learning and Data Mining(机器学习与数据挖掘)
Problems[show] Classification Clustering Regression Anomaly detection Association rules Reinforcemen ...
- 【转】The most comprehensive Data Science learning plan for 2017
I joined Analytics Vidhya as an intern last summer. I had no clue what was in store for me. I had be ...
随机推荐
- StarBlog和Masuit.MyBlogs博客程序学习使用日记(一)
最近买了个简单的服务器,想着搞点花活,就去找了找网上的开源代码,感谢大佬的开源库:(https://gitee.com/ysgdaydayup/DotNetGuide) 在上面有列开源的博客框架,我是 ...
- windows快速开启【程序和功能】
程序和功能一般常用的操作是对软件进行卸载. 方式一: 1. Win+R打开运行 2. 输入appwiz.cpl命令 方式二: 1.Win+X打开快捷开关 2. F进去应用和功能 3.点击右侧程序和功能 ...
- linux期末考试题(2)
linux期末考试题 一.选择题(共30分,每小题2分) 1.以下关于自由软件的说法,正确的是(D) A.自由软件是一种有版权保护的软件 B.修改自由软件应取得原作者的许可 C.微软的 Ofice 软 ...
- 获取接口方式(Bean注入方式总结)
一.在工具类中使用SpringContextHolder获取Bean对象,用来调用各个接口 /** * 获取阿里巴巴属性列表映射 * * @author 王子威 * @param alibabaPro ...
- 模板导入_分页_cookie_装饰器_实例
程序目录 urls.py """s14_day21 URL Configuration"""from django.contrib impo ...
- 【工程应用十】 基于Hessian矩阵的Frangi滤波算法 == 血管图像增强 == Matlab中fibermetric函数的自我实现、加速和优化。
前几天在翻一翻matlab中的帮助文档,无意中发现一个叫fibermetric的图像处理函数,感觉有点意思,可以增强或者说突出一些类似于管状的对象,后面看了下算法的帮助文档,在百度上找了找,原来这也是 ...
- dll正由另一进程使用,因此该进程无法访问此文件
打开 Windows 资源监视器:按下 Win+R 快捷键打开"运行"对话框,输入 resmon 命令并按下回车键.在资源监视器中,选择"CPU"选项卡,然后在 ...
- 张高兴的大模型开发实战:(六)在 LangGraph 中使用 MCP 协议
目录 什么是 MCP 协议 MCP 协议与 API 调用的区别 MCP 协议的连接方式 SSE(Server-Sent Events) stdio(标准输入输出) 在 LangGraph 中使用 MC ...
- CountDownLatch和FutureTask类使用方法解析
摘要:使用CountDownLatch和FutureTask解决主线程需要拿到多个子线程任务的执行结果之后再进行执行的问题. 综述 我们在工作中,经常遇到有些业务场景需要使用多线程异步执行任务,从 ...
- 直击运维痛点,大数据计算引擎 EasyMR 的监控告警设计优化之路
当企业的业务发展到一定的阶段时,在系统中引入监控告警系统来对系统/业务进行监控是必备的流程.没有监控或者没有一个好的监控,会导致开发人员无法快速判断系统是否健康:告警的实质则是"把人当服务用 ...