Kubernetes之日志和监控(十五)
一、日志和监控
1.1、Log
1.1.1、容器级别
通过docker命令查看容器级别的日志
docker ps --->containerid
docker logs containerid --->查看容器的日志情况
kubectl logs -f <pod-name> -c <container-name>
1.1.2、Pod级别
kubectl describe pod springboot-demo-68b89b96b6-sl8bq
1.1.3、组件服务级别
journalctl -u kubelet
1.1.4、LogPilot+ES+Kibana
前面的方式可以很好的查看日志,但是也有问题,如果发生服务器故障,日志无法得到很好的保存,这时就必须要做到持久化保存及方便人员查看,最好有UI页面查看,这时就到了接下来要说的事了
github:https://github.com/AliyunContainerService/log-pilot
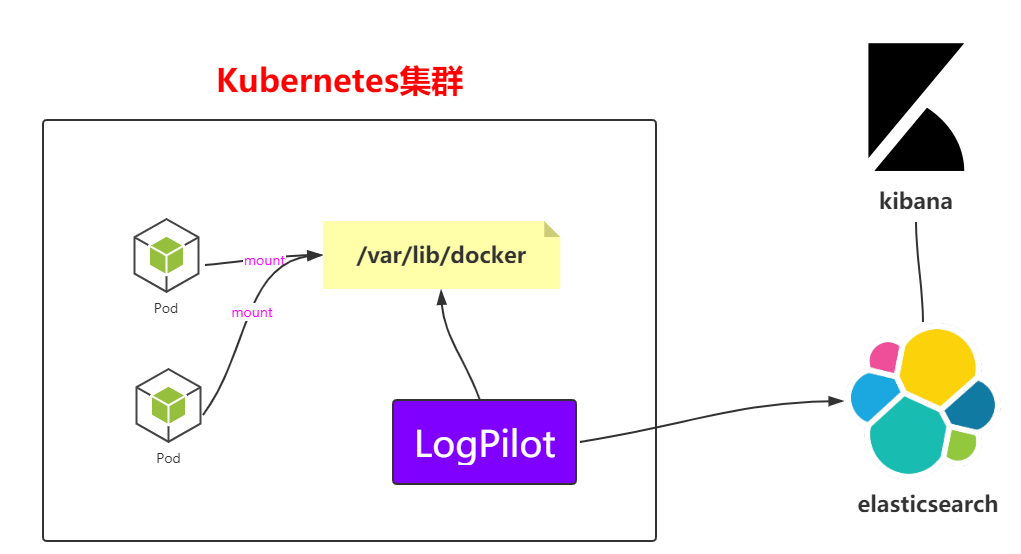
上面是一个架构图,看一眼就很明白采集方式了,就不过多解析了,接下来就直接在k8s中部署这个架构
---

apiVersion: extensions/v1beta1

kind: DaemonSet

metadata:

  name: log-pilot

  namespace: kube-system

  labels:

    k8s-app: log-pilot

    kubernetes.io/cluster-service: "true"

spec:

  template:

    metadata:

      labels:

        k8s-app: log-es

        kubernetes.io/cluster-service: "true"

        version: v1.22

    spec:

      tolerations:

      - key: node-role.kubernetes.io/master

        effect: NoSchedule

      containers:

      - name: log-pilot

        image: registry.cn-hangzhou.aliyuncs.com/log-monitor/log-pilot:0.9-filebeat  #这块要上网拉取,最好是自己拉取然后放到自己的镜像仓库中

        resources:

          limits:

            memory: 200Mi

          requests:

            cpu: 100m

            memory: 200Mi

        env:

          - name: "FILEBEAT_OUTPUT"

            value: "elasticsearch"

          - name: "ELASTICSEARCH_HOST"

            value: "elasticsearch-api"

          - name: "ELASTICSEARCH_PORT"

            value: "9200"

          - name: "ELASTICSEARCH_USER"

            value: "elastic"

          - name: "ELASTICSEARCH_PASSWORD"

            value: "changeme"

        volumeMounts:

        - name: sock

          mountPath: /var/run/docker.sock

        - name: root

          mountPath: /host

          readOnly: true

        - name: varlib

          mountPath: /var/lib/filebeat

        - name: varlog

          mountPath: /var/log/filebeat

        securityContext:

          capabilities:

            add:

            - SYS_ADMIN

      terminationGracePeriodSeconds: 30

      volumes:

      - name: sock

        hostPath:

          path: /var/run/docker.sock

      - name: root

        hostPath:

          path: /

      - name: varlib

        hostPath:

          path: /var/lib/filebeat

          type: DirectoryOrCreate

      - name: varlog

        hostPath:

          path: /var/log/filebeat

          type: DirectoryOrCreate
(2)启动脚本
kubectl apply -f log-pilot.yaml
(3)查看pod和daemonset的信息
kubectl get pods -n kube-system
kubectl get pods -n kube-system -o wide | grep log
kubectl get ds -n kube-system
(1)创建elasticsearch.yaml文件
---

apiVersion: v1

kind: Service

metadata:

  name: elasticsearch-api

  namespace: kube-system

  labels:

    name: elasticsearch

spec:

  selector:

    app: es

  ports:

  - name: transport

    port: 9200

    protocol: TCP

---

apiVersion: v1

kind: Service

metadata:

  name: elasticsearch-discovery

  namespace: kube-system

  labels:

    name: elasticsearch

spec:

  selector:

    app: es

  ports:

  - name: transport

    port: 9300

    protocol: TCP

---

apiVersion: apps/v1beta1

kind: StatefulSet

metadata:

  name: elasticsearch

  namespace: kube-system

  labels:

    kubernetes.io/cluster-service: "true"

spec:

  replicas: 3

  serviceName: "elasticsearch-service"

  selector:

    matchLabels:

      app: es

  template:

    metadata:

      labels:

        app: es

    spec:

      tolerations:

      - effect: NoSchedule

        key: node-role.kubernetes.io/master

      initContainers:

      - name: init-sysctl

        image: busybox:1.27

        command:

        - sysctl

        - -w

        - vm.max_map_count=262144

        securityContext:

          privileged: true

      containers:

      - name: elasticsearch

        image: registry.cn-hangzhou.aliyuncs.com/log-monitor/elasticsearch:v5.5.1  #这里面也一样自己拉取包在自己的私服

        ports:

        - containerPort: 9200

          protocol: TCP

        - containerPort: 9300

          protocol: TCP

        securityContext:

          capabilities:

            add:

              - IPC_LOCK

              - SYS_RESOURCE

        resources:

          limits:

            memory: 4000Mi

          requests:

            cpu: 100m

            memory: 2000Mi

        env:

          - name: "http.host"

            value: "0.0.0.0"

          - name: "network.host"

            value: "_eth0_"

          - name: "cluster.name"

            value: "docker-cluster"

          - name: "bootstrap.memory_lock"

            value: "false"

          - name: "discovery.zen.ping.unicast.hosts"

            value: "elasticsearch-discovery"

          - name: "discovery.zen.ping.unicast.hosts.resolve_timeout"

            value: "10s"

          - name: "discovery.zen.ping_timeout"

            value: "6s"

          - name: "discovery.zen.minimum_master_nodes"

            value: "2"

          - name: "discovery.zen.fd.ping_interval"

            value: "2s"

          - name: "discovery.zen.no_master_block"

            value: "write"

          - name: "gateway.expected_nodes"

            value: "2"

          - name: "gateway.expected_master_nodes"

            value: "1"

          - name: "transport.tcp.connect_timeout"

            value: "60s"

          - name: "ES_JAVA_OPTS"

            value: "-Xms2g -Xmx2g"

        livenessProbe:

          tcpSocket:

            port: transport

          initialDelaySeconds: 20

          periodSeconds: 10

        volumeMounts:

        - name: es-data

          mountPath: /data

      terminationGracePeriodSeconds: 30

      volumes:

      - name: es-data

        hostPath:

          path: /es-data
(2)启动脚本文件
kubectl apply -f elasticsearch.yaml
kubectl get pods -n kube-system
kubectl get pods -n kube-system -o wide | grep ela
(3)查看kube-system下的svc
kubectl get svc -n kube-system
elasticsearch-api       ClusterIP 10.106.65.2    <none> 9200/TCP
elasticsearch-discovery ClusterIP 10.101.117.180 <none> 9300/TCP
kube-dns                ClusterIP 10.96.0.10     <none>
(4)查看kube-system下的statefulset
kubectl get statefulset -n kube-system
NAME           READY    AGE
elasticsearch  3/3      106s
---

# Deployment

apiVersion: apps/v1beta1

kind: Deployment

metadata:

  name: kibana

  namespace: kube-system

  labels:

    component: kibana

spec:

  replicas: 1

  selector:

    matchLabels:

     component: kibana

  template:

    metadata:

      labels:

        component: kibana

    spec:

      containers:

      - name: kibana

        image: registry.cn-hangzhou.aliyuncs.com/log-monitor/kibana:v5.5.1  #这块一样,自己拉取保存私服

        env:

        - name: CLUSTER_NAME

          value: docker-cluster

        - name: ELASTICSEARCH_URL

          value: http://elasticsearch-api:9200/

        resources:

          limits:

            cpu: 1000m

          requests:

            cpu: 100m

        ports:

        - containerPort: 5601

          name: http

---

# Service

apiVersion: v1

kind: Service

metadata:

  name: kibana

  namespace: kube-system

  labels:

    component: kibana

spec:

  selector:

    component: kibana

  ports:

  - name: http

    port: 80

    targetPort: http

---

# Ingress

apiVersion: extensions/v1beta1

kind: Ingress

metadata:

  name: kibana

  namespace: kube-system

spec:

  rules:

  - host: log.k8s.ghy.com

    http:

      paths:

      - path: /

        backend:

          serviceName: kibana

          servicePort: 80
(2)执行脚本启动
kubectl apply -f kibana.yaml
(3)查看pod和deployment的信息
kubectl get pods -n kube-system | grep ki
kubectl get deploy -n kube-system
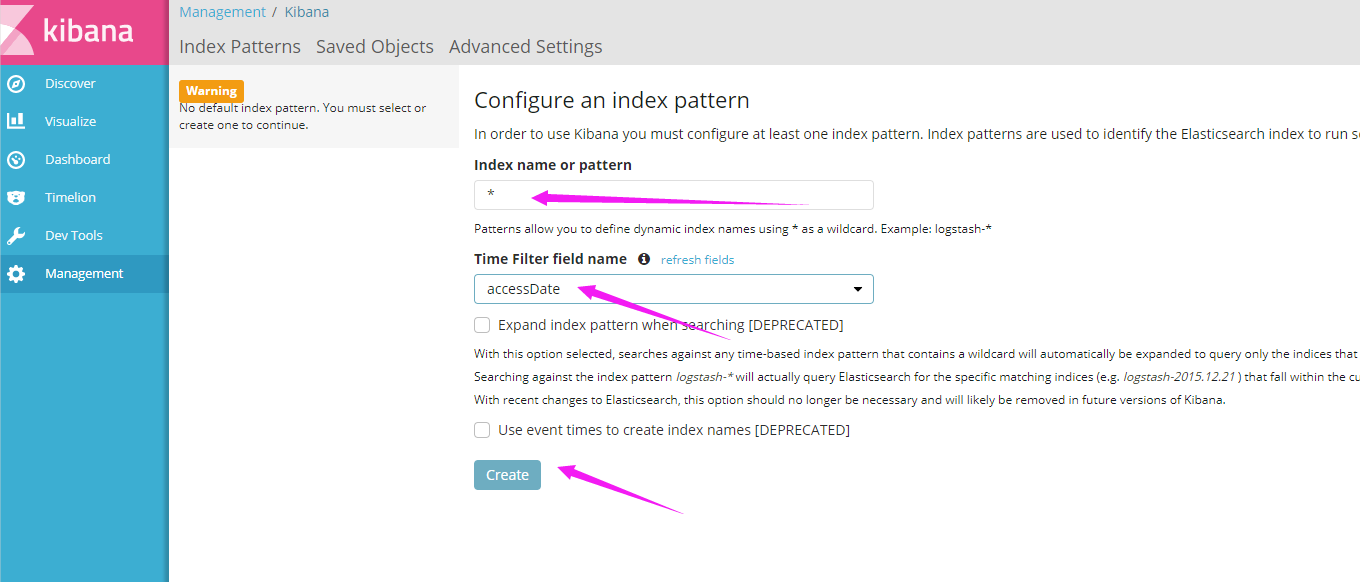
(4)配置Ingress需要的域名,打开windows上的hosts文件
# 注意这边是worker01的IP
121.41.10.126 kibana.ghy.com
(5)在windows访问
1.2、Monitor
日志经过上面的步骤就有了,接下来就是搞监控了,例如监控CPU,系统资源等等;而Prometheus是K8S官方推荐使用的方式,接下来就看看这玩意。
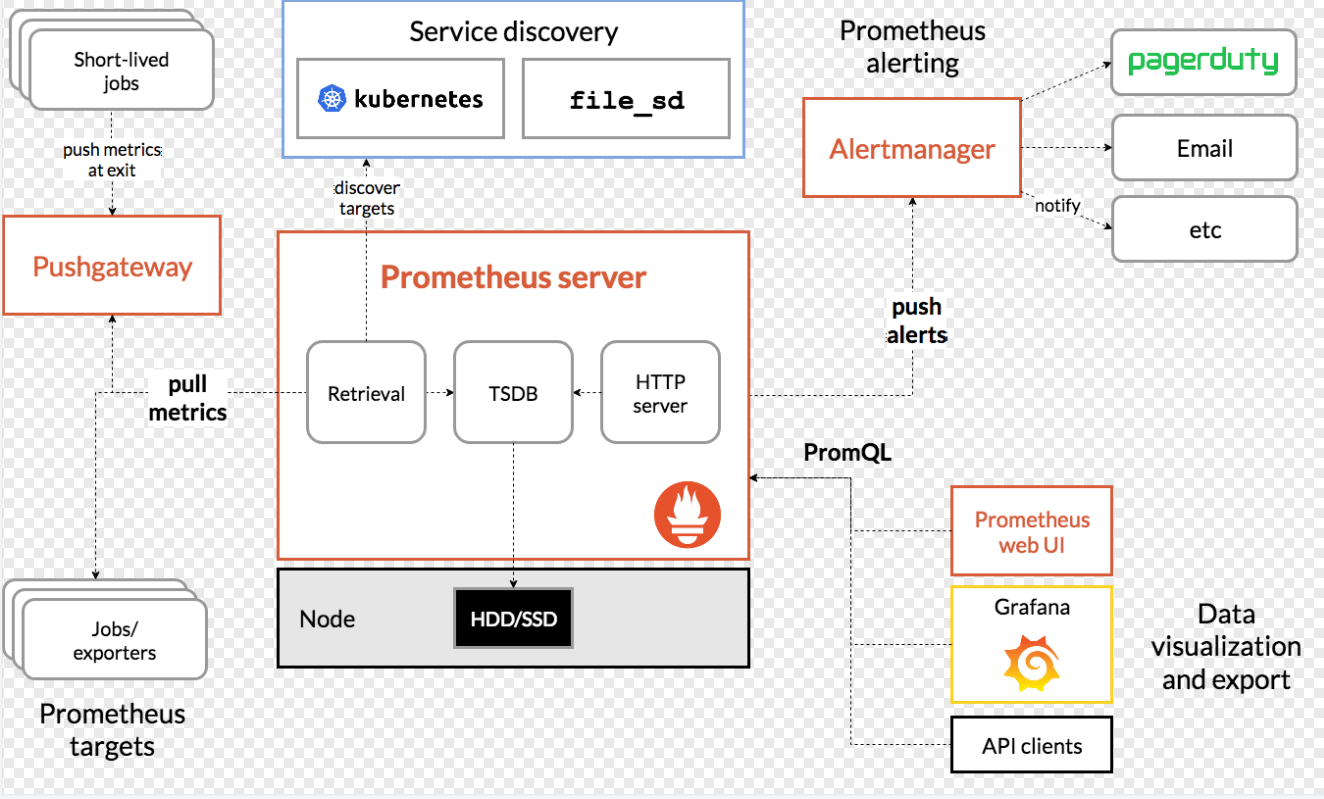
1.2.1、Prometheus简介
官网:https://prometheus.io/
github:https://github.com/kubernetes/kubernetes/tree/master/cluster/addons/prometheus
1.2.2、Prometheus架构
1.2.3、Prometheus+Grafana
(1)在master上创建prometheus目录然后创建下面这些yaml文件
apiVersion: v1

kind: Namespace

metadata:

  name: ns-monitor

  labels:

    name: ns-monitor
kind: DaemonSet

apiVersion: apps/v1beta2

metadata:

  labels:

    app: node-exporter

  name: node-exporter

  namespace: ns-monitor

spec:

  revisionHistoryLimit: 10

  selector:

    matchLabels:

      app: node-exporter

  template:

    metadata:

      labels:

        app: node-exporter

    spec:

      containers:

        - name: node-exporter

          image: prom/node-exporter:v0.16.0

          ports:

            - containerPort: 9100

              protocol: TCP

              name:    http

      hostNetwork: true

      hostPID: true

      tolerations:

        - effect: NoSchedule

          operator: Exists

---

kind: Service

apiVersion: v1

metadata:

  labels:

    app: node-exporter

  name: node-exporter-service

  namespace: ns-monitor

spec:

  ports:

    - name:    http

      port: 9100

      nodePort: 31672

      protocol: TCP

  type: NodePort

  selector:

    app: node-exporter
---

apiVersion: rbac.authorization.k8s.io/v1beta1

kind: ClusterRole

metadata:

  name: prometheus

rules:

  - apiGroups: [""] # "" indicates the core API group

    resources:

      - nodes

      - nodes/proxy

      - services

      - endpoints

      - pods

    verbs:

      - get

      - watch

      - list

  - apiGroups:

      - extensions

    resources:

      - ingresses

    verbs:

      - get

      - watch

      - list

  - nonResourceURLs: ["/metrics"]

    verbs:

      - get

---

apiVersion: v1

kind: ServiceAccount

metadata:

  name: prometheus

  namespace: ns-monitor

  labels:

    app: prometheus

---

apiVersion: rbac.authorization.k8s.io/v1beta1

kind: ClusterRoleBinding

metadata:

  name: prometheus

subjects:

  - kind: ServiceAccount

    name: prometheus

    namespace: ns-monitor

roleRef:

  kind: ClusterRole

  name: prometheus

  apiGroup: rbac.authorization.k8s.io

---

apiVersion: v1

kind: ConfigMap

metadata:

  name: prometheus-conf

  namespace: ns-monitor

  labels:

    app: prometheus

data:

  prometheus.yml: |-

    # my global config

    global:

      scrape_interval:     15s # Set the scrape interval to every 15 seconds. Default is every 1 minute.

      evaluation_interval: 15s # Evaluate rules every 15 seconds. The default is every 1 minute.

      # scrape_timeout is set to the global default (10s).

    # Alertmanager configuration

    alerting:

      alertmanagers:

      - static_configs:

        - targets:

          # - alertmanager:9093

    # Load rules once and periodically evaluate them according to the global 'evaluation_interval'.

    rule_files:

      # - "first_rules.yml"

      # - "second_rules.yml"

    # A scrape configuration containing exactly one endpoint to scrape:

    # Here it's Prometheus itself.

    scrape_configs:

      # The job name is added as a label `job=<job_name>` to any timeseries scraped from this config.

      - job_name: 'prometheus'

        # metrics_path defaults to '/metrics'

        # scheme defaults to 'http'.

        static_configs:

          - targets: ['localhost:9090']

      - job_name: 'grafana'

        static_configs:

          - targets:

              - 'grafana-service.ns-monitor:3000'

      - job_name: 'kubernetes-apiservers'

        kubernetes_sd_configs:

        - role: endpoints

        # Default to scraping over https. If required, just disable this or change to

        # `http`.

        scheme: https

        # This TLS & bearer token file config is used to connect to the actual scrape

        # endpoints for cluster components. This is separate to discovery auth

        # configuration because discovery & scraping are two separate concerns in

        # Prometheus. The discovery auth config is automatic if Prometheus runs inside

        # the cluster. Otherwise, more config options have to be provided within the

        # <kubernetes_sd_config>.

        tls_config:

          ca_file: /var/run/secrets/kubernetes.io/serviceaccount/ca.crt

          # If your node certificates are self-signed or use a different CA to the

          # master CA, then disable certificate verification below. Note that

          # certificate verification is an integral part of a secure infrastructure

          # so this should only be disabled in a controlled environment. You can

          # disable certificate verification by uncommenting the line below.

          #

          # insecure_skip_verify: true

        bearer_token_file: /var/run/secrets/kubernetes.io/serviceaccount/token

        # Keep only the default/kubernetes service endpoints for the https port. This

        # will add targets for each API server which Kubernetes adds an endpoint to

        # the default/kubernetes service.

        relabel_configs:

        - source_labels: [__meta_kubernetes_namespace, __meta_kubernetes_service_name, __meta_kubernetes_endpoint_port_name]

          action: keep

          regex: default;kubernetes;https

      # Scrape config for nodes (kubelet).

      #

      # Rather than connecting directly to the node, the scrape is proxied though the

      # Kubernetes apiserver.  This means it will work if Prometheus is running out of

      # cluster, or can't connect to nodes for some other reason (e.g. because of

      # firewalling).

      - job_name: 'kubernetes-nodes'

        # Default to scraping over https. If required, just disable this or change to

        # `http`.

        scheme: https

        # This TLS & bearer token file config is used to connect to the actual scrape

        # endpoints for cluster components. This is separate to discovery auth

        # configuration because discovery & scraping are two separate concerns in

        # Prometheus. The discovery auth config is automatic if Prometheus runs inside

        # the cluster. Otherwise, more config options have to be provided within the

        # <kubernetes_sd_config>.

        tls_config:

          ca_file: /var/run/secrets/kubernetes.io/serviceaccount/ca.crt

        bearer_token_file: /var/run/secrets/kubernetes.io/serviceaccount/token

        kubernetes_sd_configs:

        - role: node

        relabel_configs:

        - action: labelmap

          regex: __meta_kubernetes_node_label_(.+)

        - target_label: __address__

          replacement: kubernetes.default.svc:443

        - source_labels: [__meta_kubernetes_node_name]

          regex: (.+)

          target_label: __metrics_path__

          replacement: /api/v1/nodes/${1}/proxy/metrics

      # Scrape config for Kubelet cAdvisor.

      #

      # This is required for Kubernetes 1.7.3 and later, where cAdvisor metrics

      # (those whose names begin with 'container_') have been removed from the

      # Kubelet metrics endpoint.  This job scrapes the cAdvisor endpoint to

      # retrieve those metrics.

      #

      # In Kubernetes 1.7.0-1.7.2, these metrics are only exposed on the cAdvisor

      # HTTP endpoint; use "replacement: /api/v1/nodes/${1}:4194/proxy/metrics"

      # in that case (and ensure cAdvisor's HTTP server hasn't been disabled with

      # the --cadvisor-port=0 Kubelet flag).

      #

      # This job is not necessary and should be removed in Kubernetes 1.6 and

      # earlier versions, or it will cause the metrics to be scraped twice.

      - job_name: 'kubernetes-cadvisor'

        # Default to scraping over https. If required, just disable this or change to

        # `http`.

        scheme: https

        # This TLS & bearer token file config is used to connect to the actual scrape

        # endpoints for cluster components. This is separate to discovery auth

        # configuration because discovery & scraping are two separate concerns in

        # Prometheus. The discovery auth config is automatic if Prometheus runs inside

        # the cluster. Otherwise, more config options have to be provided within the

        # <kubernetes_sd_config>.

        tls_config:

          ca_file: /var/run/secrets/kubernetes.io/serviceaccount/ca.crt

        bearer_token_file: /var/run/secrets/kubernetes.io/serviceaccount/token

        kubernetes_sd_configs:

        - role: node

        relabel_configs:

        - action: labelmap

          regex: __meta_kubernetes_node_label_(.+)

        - target_label: __address__

          replacement: kubernetes.default.svc:443

        - source_labels: [__meta_kubernetes_node_name]

          regex: (.+)

          target_label: __metrics_path__

          replacement: /api/v1/nodes/${1}/proxy/metrics/cadvisor

      # Scrape config for service endpoints.

      #

      # The relabeling allows the actual service scrape endpoint to be configured

      # via the following annotations:

      #

      # * `prometheus.io/scrape`: Only scrape services that have a value of `true`

      # * `prometheus.io/scheme`: If the metrics endpoint is secured then you will need

      # to set this to `https` & most likely set the `tls_config` of the scrape config.

      # * `prometheus.io/path`: If the metrics path is not `/metrics` override this.

      # * `prometheus.io/port`: If the metrics are exposed on a different port to the

      # service then set this appropriately.

      - job_name: 'kubernetes-service-endpoints'

        kubernetes_sd_configs:

        - role: endpoints

        relabel_configs:

        - source_labels: [__meta_kubernetes_service_annotation_prometheus_io_scrape]

          action: keep

          regex: true

        - source_labels: [__meta_kubernetes_service_annotation_prometheus_io_scheme]

          action: replace

          target_label: __scheme__

          regex: (https?)

        - source_labels: [__meta_kubernetes_service_annotation_prometheus_io_path]

          action: replace

          target_label: __metrics_path__

          regex: (.+)

        - source_labels: [__address__, __meta_kubernetes_service_annotation_prometheus_io_port]

          action: replace

          target_label: __address__

          regex: ([^:]+)(?::\d+)?;(\d+)

          replacement: $1:$2

        - action: labelmap

          regex: __meta_kubernetes_service_label_(.+)

        - source_labels: [__meta_kubernetes_namespace]

          action: replace

          target_label: kubernetes_namespace

        - source_labels: [__meta_kubernetes_service_name]

          action: replace

          target_label: kubernetes_name

      # Example scrape config for probing services via the Blackbox Exporter.

      #

      # The relabeling allows the actual service scrape endpoint to be configured

      # via the following annotations:

      #

      # * `prometheus.io/probe`: Only probe services that have a value of `true`

      - job_name: 'kubernetes-services'

        metrics_path: /probe

        params:

          module: [http_2xx]

        kubernetes_sd_configs:

        - role: service

        relabel_configs:

        - source_labels: [__meta_kubernetes_service_annotation_prometheus_io_probe]

          action: keep

          regex: true

        - source_labels: [__address__]

          target_label: __param_target

        - target_label: __address__

          replacement: blackbox-exporter.example.com:9115

        - source_labels: [__param_target]

          target_label: instance

        - action: labelmap

          regex: __meta_kubernetes_service_label_(.+)

        - source_labels: [__meta_kubernetes_namespace]

          target_label: kubernetes_namespace

        - source_labels: [__meta_kubernetes_service_name]

          target_label: kubernetes_name

      # Example scrape config for probing ingresses via the Blackbox Exporter.

      #

      # The relabeling allows the actual ingress scrape endpoint to be configured

      # via the following annotations:

      #

      # * `prometheus.io/probe`: Only probe services that have a value of `true`

      - job_name: 'kubernetes-ingresses'

        metrics_path: /probe

        params:

          module: [http_2xx]

        kubernetes_sd_configs:

          - role: ingress

        relabel_configs:

          - source_labels: [__meta_kubernetes_ingress_annotation_prometheus_io_probe]

            action: keep

            regex: true

          - source_labels: [__meta_kubernetes_ingress_scheme,__address__,__meta_kubernetes_ingress_path]

            regex: (.+);(.+);(.+)

            replacement: ${1}://${2}${3}

            target_label: __param_target

          - target_label: __address__

            replacement: blackbox-exporter.example.com:9115

          - source_labels: [__param_target]

            target_label: instance

          - action: labelmap

            regex: __meta_kubernetes_ingress_label_(.+)

          - source_labels: [__meta_kubernetes_namespace]

            target_label: kubernetes_namespace

          - source_labels: [__meta_kubernetes_ingress_name]

            target_label: kubernetes_name

      # Example scrape config for pods

      #

      # The relabeling allows the actual pod scrape endpoint to be configured via the

      # following annotations:

      #

      # * `prometheus.io/scrape`: Only scrape pods that have a value of `true`

      # * `prometheus.io/path`: If the metrics path is not `/metrics` override this.

      # * `prometheus.io/port`: Scrape the pod on the indicated port instead of the

      # pod's declared ports (default is a port-free target if none are declared).

      - job_name: 'kubernetes-pods'

        kubernetes_sd_configs:

        - role: pod

        relabel_configs:

        - source_labels: [__meta_kubernetes_pod_annotation_prometheus_io_scrape]

          action: keep

          regex: true

        - source_labels: [__meta_kubernetes_pod_annotation_prometheus_io_path]

          action: replace

          target_label: __metrics_path__

          regex: (.+)

        - source_labels: [__address__, __meta_kubernetes_pod_annotation_prometheus_io_port]

          action: replace

          regex: ([^:]+)(?::\d+)?;(\d+)

          replacement: $1:$2

          target_label: __address__

        - action: labelmap

          regex: __meta_kubernetes_pod_label_(.+)

        - source_labels: [__meta_kubernetes_namespace]

          action: replace

          target_label: kubernetes_namespace

        - source_labels: [__meta_kubernetes_pod_name]

          action: replace

          target_label: kubernetes_pod_name

---

apiVersion: v1

kind: ConfigMap

metadata:

  name: prometheus-rules

  namespace: ns-monitor

  labels:

    app: prometheus

data:

  cpu-usage.rule: |

    groups:

      - name: NodeCPUUsage

        rules:

          - alert: NodeCPUUsage

            expr: (100 - (avg by (instance) (irate(node_cpu{name="node-exporter",mode="idle"}[5m])) * 100)) > 75

            for: 2m

            labels:

              severity: "page"

            annotations:

              summary: "{{$labels.instance}}: High CPU usage detected"

              description: "{{$labels.instance}}: CPU usage is above 75% (current value is: {{ $value }})"

---

apiVersion: v1

kind: PersistentVolume

metadata:

  name: "prometheus-data-pv"

  labels:

    name: prometheus-data-pv

    release: stable

spec:

  capacity:

    storage: 5Gi

  accessModes:

    - ReadWriteOnce

  persistentVolumeReclaimPolicy: Recycle

  nfs:

    path: /nfs/data/prometheus

    server: 121.41.10.13

---

apiVersion: v1

kind: PersistentVolumeClaim

metadata:

  name: prometheus-data-pvc

  namespace: ns-monitor

spec:

  accessModes:

    - ReadWriteOnce

  resources:

    requests:

      storage: 5Gi

  selector:

    matchLabels:

      name: prometheus-data-pv

      release: stable

---

kind: Deployment

apiVersion: apps/v1beta2

metadata:

  labels:

    app: prometheus

  name: prometheus

  namespace: ns-monitor

spec:

  replicas: 1

  revisionHistoryLimit: 10

  selector:

    matchLabels:

      app: prometheus

  template:

    metadata:

      labels:

        app: prometheus

    spec:

      serviceAccountName: prometheus

      securityContext:

        runAsUser: 0

      containers:

        - name: prometheus

          image: prom/prometheus:latest

          imagePullPolicy: IfNotPresent

          volumeMounts:

            - mountPath: /prometheus

              name: prometheus-data-volume

            - mountPath: /etc/prometheus/prometheus.yml

              name: prometheus-conf-volume

              subPath: prometheus.yml

            - mountPath: /etc/prometheus/rules

              name: prometheus-rules-volume

          ports:

            - containerPort: 9090

              protocol: TCP

      volumes:

        - name: prometheus-data-volume

          persistentVolumeClaim:

            claimName: prometheus-data-pvc

        - name: prometheus-conf-volume

          configMap:

            name: prometheus-conf

        - name: prometheus-rules-volume

          configMap:

            name: prometheus-rules

      tolerations:

        - key: node-role.kubernetes.io/master

          effect: NoSchedule

---

kind: Service

apiVersion: v1

metadata:

  annotations:

    prometheus.io/scrape: 'true'

  labels:

    app: prometheus

  name: prometheus-service

  namespace: ns-monitor

spec:

  ports:

    - port: 9090

      targetPort: 9090

  selector:

    app: prometheus

  type: NodePort
apiVersion: v1

kind: PersistentVolume

metadata:

  name: "grafana-data-pv"

  labels:

    name: grafana-data-pv

    release: stable

spec:

  capacity:

    storage: 5Gi

  accessModes:

    - ReadWriteOnce

  persistentVolumeReclaimPolicy: Recycle

  nfs:

    path: /nfs/data/grafana

    server: 121.41.10.13

---

apiVersion: v1

kind: PersistentVolumeClaim

metadata:

  name: grafana-data-pvc

  namespace: ns-monitor

spec:

  accessModes:

    - ReadWriteOnce

  resources:

    requests:

      storage: 5Gi

  selector:

    matchLabels:

      name: grafana-data-pv

      release: stable

---

kind: Deployment

apiVersion: apps/v1beta2

metadata:

  labels:

    app: grafana

  name: grafana

  namespace: ns-monitor

spec:

  replicas: 1

  revisionHistoryLimit: 10

  selector:

    matchLabels:

      app: grafana

  template:

    metadata:

      labels:

        app: grafana

    spec:

      securityContext:

        runAsUser: 0

      containers:

        - name: grafana

          image: grafana/grafana:latest

          imagePullPolicy: IfNotPresent

          env:

            - name: GF_AUTH_BASIC_ENABLED

              value: "true"

            - name: GF_AUTH_ANONYMOUS_ENABLED

              value: "false"

          readinessProbe:

            httpGet:

              path: /login

              port: 3000

          volumeMounts:

            - mountPath: /var/lib/grafana

              name: grafana-data-volume

          ports:

            - containerPort: 3000

              protocol: TCP

      volumes:

        - name: grafana-data-volume

          persistentVolumeClaim:

            claimName: grafana-data-pvc

---

kind: Service

apiVersion: v1

metadata:

  labels:

    app: grafana

  name: grafana-service

  namespace: ns-monitor

spec:

  ports:

    - port: 3000

      targetPort: 3000

  selector:

    app: grafana

  type: NodePort
#ingress

apiVersion: extensions/v1beta1

kind: Ingress

metadata:

  name: ingress

  namespace: ns-monitor

spec:

  rules:

  - host: monitor.k8s.ghy.com

    http:

      paths:

      - path: /

        backend:

          serviceName: grafana-service

          servicePort: 3000
(2)创建命名空间ns-monitor
kubectl apply -f namespace.yaml
kubectl get namespace
(3)创建node-exporter
kubectl apply -f node-exporter.yaml
kubectl get pod -n ns-monitor kubectl get svc -n ns-monitor
kubectl get ds -n ns-monitor
kubectl apply -f prometheus.yaml
kubectl get pod -n ns-monitor
kubectl get svc -n ns-monitor
(5)部署grafana
kubectl apply -f grafana.yaml
kubectl get pod -n ns-monitor
kubectl get svc -n ns-monitor
kubectl apply - ingress.yaml
kubectl get ingress -n ns-monitor
kubectl describe ingress -n ns-monitor
Kubernetes之日志和监控(十五)的更多相关文章
- Kubernetes学习之路(十五)之Ingress和Ingress Controller
目录 一.什么是Ingress? 1.Pod 漂移问题 2.端口管理问题 3.域名分配及动态更新问题 二.如何创建Ingress资源 三.Ingress资源类型 1.单Service资源型Ingres ...
- 我的MYSQL学习心得(十五) 日志
我的MYSQL学习心得(十五) 日志 我的MYSQL学习心得(一) 简单语法 我的MYSQL学习心得(二) 数据类型宽度 我的MYSQL学习心得(三) 查看字段长度 我的MYSQL学习心得(四) 数据 ...
- 别人的的MYSQL学习心得(十五) 日志
我的MYSQL学习心得(十五) 日志 我的MYSQL学习心得(一) 简单语法 我的MYSQL学习心得(二) 数据类型宽度 我的MYSQL学习心得(三) 查看字段长度 我的MYSQL学习心得(四) 数据 ...
- Docker+ Kubernetes已成为云计算的主流(二十五)
前言 最近正在抽时间编写k8s的相关教程,很是费时,等相关内容初步完成后,再和大家分享.对于k8s,还是上云更为简单.稳定并且节省成本,因此我们需要对主流云服务的容器服务进行了解,以便更好地应用于生产 ...
- 使用Typescript重构axios(二十五)——文件上传下载进度监控
0. 系列文章 1.使用Typescript重构axios(一)--写在最前面 2.使用Typescript重构axios(二)--项目起手,跑通流程 3.使用Typescript重构axios(三) ...
- Kubernetes Ingress 日志分析与监控的最佳实践
摘要: Ingress主要提供HTTP层(7层)路由功能,是目前K8s中HTTP/HTTPS服务的主流暴露方式.为简化广大用户对于Ingress日志分析与监控的门槛,阿里云容器服务和日志服务将Ingr ...
- 《手把手教你》系列基础篇(八十五)-java+ selenium自动化测试-框架设计基础-TestNG自定义日志-下篇(详解教程)
1.简介 TestNG为日志记录和报告提供的不同选项.现在,宏哥讲解分享如何开始使用它们.首先,我们将编写一个示例程序,在该程序中我们将使用 ITestListener方法进行日志记录. 2.Test ...
- 了解Kubernetes主体架构(二十八)
前言 Kubernetes的教程一直在编写,目前已经初步完成了以下内容: 1)基础理论 2)使用Minikube部署本地Kubernetes集群 3)使用Kubeadm创建集群 接下来还会逐步完善本教 ...
- 跟我学SpringCloud | 第十五篇:微服务利剑之APM平台(一)Skywalking
目录 SpringCloud系列教程 | 第十五篇:微服务利剑之APM平台(一)Skywalking 1. Skywalking概述 2. Skywalking主要功能 3. Skywalking主要 ...
随机推荐
- Codeforces 450C:Jzzhu and Chocolate(贪心)
C. Jzzhu and Chocolate time limit per test: 1 seconds memory limit per test: 256 megabytes input: st ...
- (原创)WinForm中莫名其妙的小BUG——RichTextBox自动选择字词问题
一.前言 使用WinForm很久了,多多少少会遇到一些小BUG. 这些小BUG影响并不严重,而且稍微设置一下就能正常使用,而且微软一直也没有修复这些小BUG. 写本系列文章,是为了记录一下这些无伤大雅 ...
- 网站迁移纪实:从Web Form 到 Asp.Net Core (Abp vNext 自定义开发)
问题和需求 从2004年上线,ZLDNN.COM运行已经超过16年了,一直使用DotNetNuke平台(现在叫DNN Platform),从最初的DotNetNuke 2.1到现在使用的7.4.先是在 ...
- [opencv]zxing c++ 库的编译,安装,以及api的介绍
环境:ubuntu 16.04 1. 下载:zxing的源码 git clone https://github.com/15903016222/zxing-cpp.git2. 安装编译依赖的工具:cm ...
- Java初学者作业——编写Java程序,输出1~100之间能够同时被3和4整除的最大的五个数字。
返回本章节 返回作业目录 需求说明: 编写Java程序,输出1-100之间能够同时被3和4整除的最大的五个数字. 实现思路: 声明变量count,用于存储满足条件的数据个数,设置初始值为0. 在区间1 ...
- Android 悬浮窗
悬浮窗是一种比较常见的需求.例如把视频通话界面缩小成一个悬浮窗,然后用户可以在其他界面上处理事情. 本文给出一个简单的悬浮窗实现.可缩小activity和还原大小.可悬浮在其他activity上.使用 ...
- SpringCloud发现服务代码(EurekaClient,DiscoveryClient)
1.说明 本文介绍SpringCloud发现服务代码的开发, 通过使用EurekaClient,DiscoveryClient来发现注册中心的服务等, 从而可以自定义客户端对注册中心的高级用法. 2. ...
- Eclipse启动SpringCloud微服务集群的方法
1.说明 下面这篇文章介绍了Eureka Server集群的启动方法, SpringCloud创建Eureka模块集群 是通过jar包启动时指定配置文件的方式实现的. 现在只有Eureka Serve ...
- hisql 与sqlsugar,freesql 数据插入性能测试
hisql与目前比较流行的ORM框架性能测试对比 hisql 一直定位为新一代的ORM框架 为低代码开发而生 测试数据数据库为sqlserver数据库 测试源码地址hisql与sqlsugar fre ...
- PL/SQL连接时,报无法解析指定的字符串
前言: 工作原因,需要安装PL/SQL连接数据,oracle和PL/SQL都装好了,环境变量也配好了,启动PL/SQL进行连接数据库,结果报"无法解析指定的字符串",连接失败了. ...