prometheus(3)之grafan可视化展现
可视化UI界面Grafana的安装和配置
Grafana介绍
Grafana是一个跨平台的开源的度量分析和可视化工具,可以将采集的数据可视化的展示,并及时通知给告警接收方。它主要有以下六大特点:
1、展示方式:快速灵活的客户端图表,面板插件有许多不同方式的可视化指标和日志,官方库中具有丰富的仪表盘插件,比如热图、折线图、图表等多种展示方式;
2、数据源:Graphite,InfluxDB,OpenTSDB,Prometheus,Elasticsearch,CloudWatch和KairosDB等;
3、通知提醒:以可视方式定义最重要指标的警报规则,Grafana将不断计算并发送通知,在数据达到阈值时通过Slack、PagerDuty等获得通知;
4、混合展示:在同一图表中混合使用不同的数据源,可以基于每个查询指定数据源,甚至自定义数据源;
5、注释:使用来自不同数据源的丰富事件注释图表,将鼠标悬停在事件上会显示完整的事件元数据和标记。
安装Grafana
安装Grafana需要的镜像heapster-grafana-amd64_v5_0_4.tar.gz,把镜像上传到k8s的工作节点xianchaonode1上,手动解压:

[root@xianchaonode1 ~]# docker load -i heapster-grafana-amd64_v5_0_4.tar.gz

grafana.yaml文件在课件里,可上传到k8s的控制节点:

更新yaml文件:

[root@xianchaomaster1 prometheus]# kubectl apply -f grafana.yaml

#查看grafana是否创建成功:

[root@xianchaomaster1 prometheus]# kubectl get pods -n kube-system -l task=monitoring

显示如下,说明部署成功

NAME                                  READY   STATUS    RESTARTS   AGE

monitoring-grafana-675798bf47-cw9hr   1/1     Running   0          39s


apiVersion: apps/v1

kind: Deployment

metadata:

  name: monitoring-grafana

  namespace: kube-system

spec:

  replicas: 1

  selector:

    matchLabels:

      task: monitoring

      k8s-app: grafana

  template:

    metadata:

      labels:

        task: monitoring

apiVersion: apps/v1

kind: Deployment

metadata:

  name: monitoring-grafana

  namespace: kube-system

spec:

  replicas: 1

  selector:

    matchLabels:

      task: monitoring

      k8s-app: grafana

  template:

    metadata:

      labels:

        task: monitoring

        k8s-app: grafana

    spec:

      containers:

      - name: grafana

        image: 172.17.166.217/kubenetes/heapster-grafana-amd64:v5.0.4

        ports:

        - containerPort: 3000

          protocol: TCP

        volumeMounts:

        - mountPath: /etc/ssl/certs

          name: ca-certificates

          readOnly: true

        - mountPath: /var

          name: grafana-storage

        env:

        - name: INFLUXDB_HOST

          value: monitoring-influxdb

        - name: GF_SERVER_HTTP_PORT

          value: "3000"

          # The following env variables are required to make Grafana accessible via

          # the kubernetes api-server proxy. On production clusters, we recommend

          # removing these env variables, setup auth for grafana, and expose the grafana

          # service using a LoadBalancer or a public IP.

        - name: GF_AUTH_BASIC_ENABLED

          value: "false"

        - name: GF_AUTH_ANONYMOUS_ENABLED

          value: "true"

        - name: GF_AUTH_ANONYMOUS_ORG_ROLE

          value: Admin

        - name: GF_SERVER_ROOT_URL

          # If you're only using the API Server proxy, set this value instead:

          # value: /api/v1/namespaces/kube-system/services/monitoring-grafana/proxy

          value: /

      volumes:

      - name: ca-certificates

        hostPath:

          path: /etc/ssl/certs

      - name: grafana-storage

        emptyDir: {}

---

apiVersion: v1

kind: Service

metadata:

  labels:

    # For use as a Cluster add-on (https://github.com/kubernetes/kubernetes/tree/master/cluster/addons)

    # If you are NOT using this as an addon, you should comment out this line.

    kubernetes.io/cluster-service: 'true'

    kubernetes.io/name: monitoring-grafana

  name: monitoring-grafana

  namespace: kube-system

spec:

  # In a production setup, we recommend accessing Grafana through an external Loadbalancer

  # or through a public IP.

  # type: LoadBalancer

  # You could also use NodePort to expose the service at a randomly-generated port

  # type: NodePort

  ports:

  - port: 80

    targetPort: 3000

  selector:

    k8s-app: grafana

  type: ClusterIP
grafana.yaml
Grafana界面接入Prometheus数据源
查看grafana前端的service
[root@xianchaomaster1]# kubectl get svc -n kube-system | grep grafana
显示如下:
monitoring-grafana NodePort 10.106.3.47 <none> 80:30858/TCP
1)登陆grafana,在浏览器访问
192.168.40.180:30858
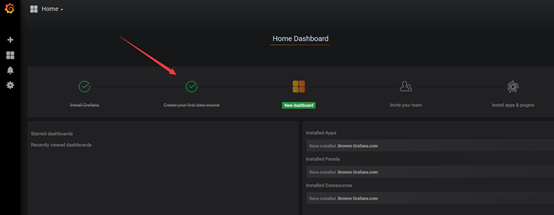
可看到如下界面:

2)配置grafana界面:
开始配置grafana的web界面:
选择Create your first data source
出现如下
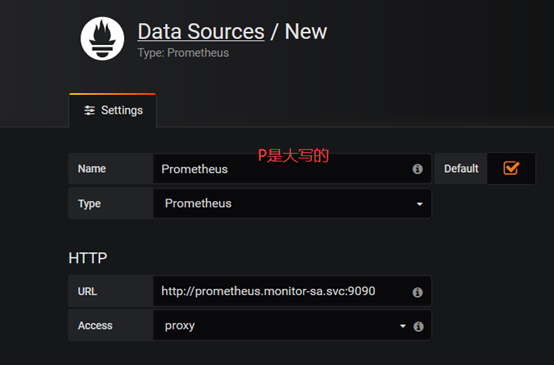
Name: Prometheus
Type: Prometheus
HTTP 处的URL写 如下:
http://prometheus.monitor-sa.svc:9090
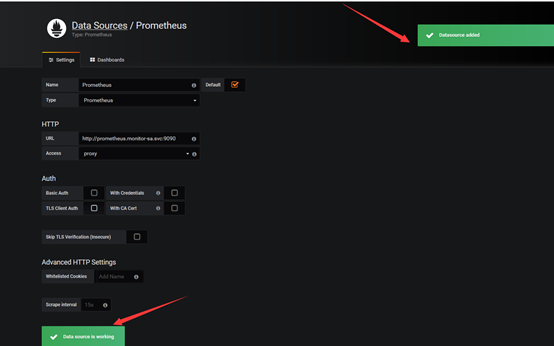
配置好的整体页面如下:
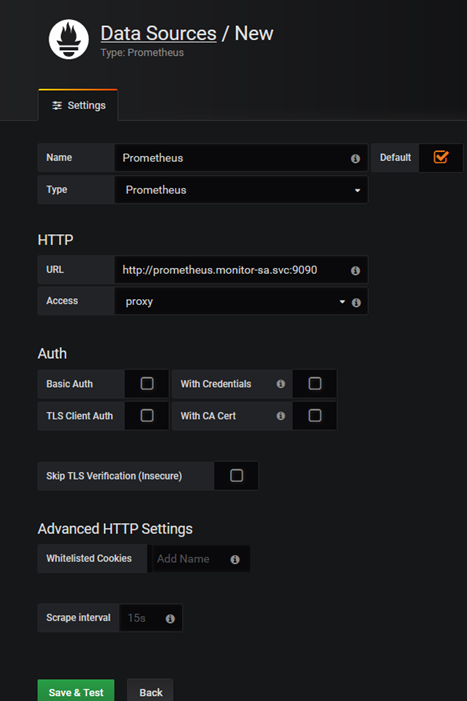
点击左下角Save & Test,出现如下Data source is working,说明prometheus数据源成功的被grafana接入了
导入的监控模板,可在如下链接搜索
https://grafana.com/dashboards?dataSource=prometheus&search=kubernetes
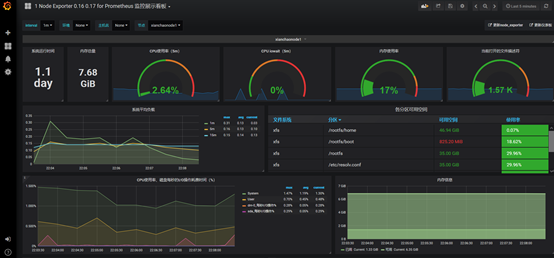
可直接导入node_exporter.json监控模板,这个可以把node节点指标显示出来
node_exporter.json在课件里
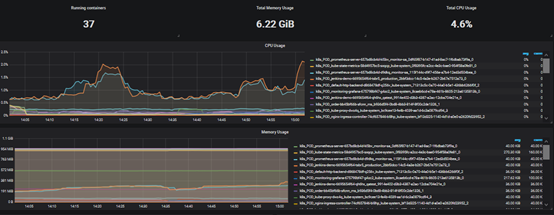
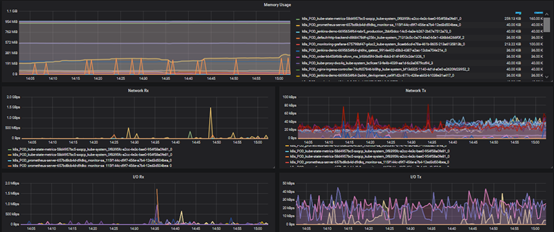
可直接导入docker_rev1.json,显示容器资源指标的,docker_rev1.json在课件里
怎么导入监控模板,按如下步骤:
上面Save & Test测试没问题之后,就可以返回Grafana主页面
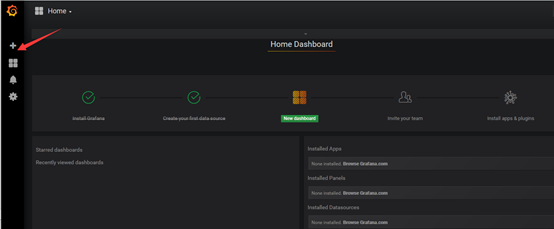
点击左侧+号下面的Import,出现如下界面

选择Upload json file,出现如下
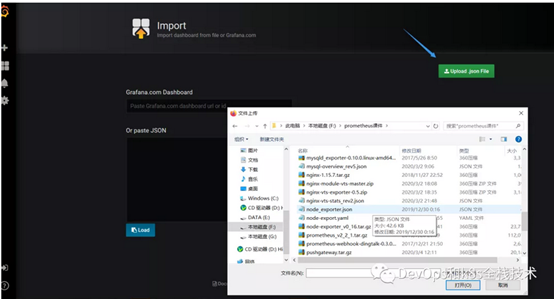
选择一个本地的json文件,我们选择的是上面让大家下载的node_exporter.json这个文件,选择之后出现如下:
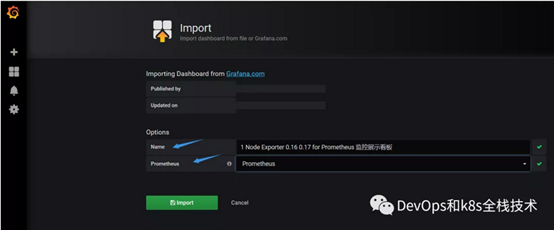
注:箭头标注的地方Name后面的名字是node_exporter.json定义的
Prometheus后面需要变成Prometheus,然后再点击Import,就可以出现如下界面:
{
"__inputs": [
{
"name": "DS_PROMETHEUS",
"label": "Prometheus",
"description": "",
"type": "datasource",
"pluginId": "prometheus",
"pluginName": "Prometheus"
}
],
"__requires": [
{
"type": "grafana",
"id": "grafana",
"name": "Grafana",
"version": "v5.0.4"
},
{
"type": "panel",
"id": "graph",
"name": "Graph",
"version": "5.0.0"
},
{
"type": "datasource",
"id": "prometheus",
"name": "Prometheus",
"version": "5.0.0"
},
{
"type": "panel",
"id": "singlestat",
"name": "Singlestat",
"version": "5.0.0"
},
{
"type": "panel",
"id": "table",
"name": "Table",
"version": "5.0.0"
},
{
"type": "panel",
"id": "text",
"name": "Text",
"version": "5.0.0"
}
],
"annotations": {
"list": [
{
"builtIn": 1,
"datasource": "-- Grafana --",
"enable": true,
"hide": true,
"iconColor": "rgba(0, 211, 255, 1)",
"name": "Annotations & Alerts",
"type": "dashboard"
}
]
},
"description": "使用 Node Exporter v0.16 0.17,精简优化重要指标展示。包含:CPU 内存 磁盘 IO 网络 温度等监控指标。https://github.com/starsliao/Prometheus",
"editable": true,
"gnetId": 8919,
"graphTooltip": 0,
"id": null,
"iteration": 1577635529131,
"links": [
{
"icon": "external link",
"tags": [],
"targetBlank": true,
"title": "更新node_exporter",
"tooltip": "",
"type": "link",
"url": "https://github.com/prometheus/node_exporter/releases"
},
{
"icon": "external link",
"tags": [],
"targetBlank": true,
"title": "更新仪表板",
"tooltip": "",
"type": "link",
"url": "https://grafana.com/dashboards/8919"
}
],
"panels": [
{
"content": "",
"editable": true,
"error": false,
"gridPos": {
"h": 1,
"w": 24,
"x": 0,
"y": 0
},
"id": 11,
"links": [],
"minSpan": 4,
"mode": "html",
"repeat": "node",
"repeatDirection": "h",
"style": {},
"title": "$node",
"type": "text"
},
{
"cacheTimeout": null,
"colorBackground": false,
"colorValue": false,
"colors": [
"rgba(245, 54, 54, 0.9)",
"rgba(237, 129, 40, 0.89)",
"rgba(50, 172, 45, 0.97)"
],
"datasource": "${DS_PROMETHEUS}",
"decimals": 1,
"description": "",
"format": "s",
"gauge": {
"maxValue": 100,
"minValue": 0,
"show": false,
"thresholdLabels": false,
"thresholdMarkers": true
},
"gridPos": {
"h": 5,
"w": 2,
"x": 0,
"y": 2
},
"hideTimeOverride": true,
"id": 15,
"interval": null,
"links": [],
"mappingType": 1,
"mappingTypes": [
{
"name": "value to text",
"value": 1
},
{
"name": "range to text",
"value": 2
}
],
"maxDataPoints": 100,
"nullPointMode": "null",
"nullText": null,
"postfix": "",
"postfixFontSize": "50%",
"prefix": "",
"prefixFontSize": "50%",
"rangeMaps": [
{
"from": "null",
"text": "N/A",
"to": "null"
}
],
"sparkline": {
"fillColor": "rgba(31, 118, 189, 0.18)",
"full": false,
"lineColor": "rgb(31, 120, 193)",
"show": false
},
"tableColumn": "",
"targets": [
{
"expr": "time() - node_boot_time_seconds{instance=~\"$node\"}",
"format": "time_series",
"hide": false,
"instant": true,
"intervalFactor": 2,
"refId": "A",
"step": 40
}
],
"thresholds": "",
"title": "系统运行时间",
"transparent": false,
"type": "singlestat",
"valueFontSize": "100%",
"valueMaps": [
{
"op": "=",
"text": "N/A",
"value": "null"
}
],
"valueName": "current"
},
{
"cacheTimeout": null,
"colorBackground": false,
"colorValue": false,
"colors": [
"rgba(245, 54, 54, 0.9)",
"rgba(237, 129, 40, 0.89)",
"rgba(50, 172, 45, 0.97)"
],
"datasource": "${DS_PROMETHEUS}",
"decimals": null,
"description": "",
"format": "bytes",
"gauge": {
"maxValue": 100,
"minValue": 0,
"show": false,
"thresholdLabels": false,
"thresholdMarkers": true
},
"gridPos": {
"h": 5,
"w": 2,
"x": 2,
"y": 2
},
"id": 75,
"interval": null,
"links": [],
"mappingType": 1,
"mappingTypes": [
{
"name": "value to text",
"value": 1
},
{
"name": "range to text",
"value": 2
}
],
"maxDataPoints": 100,
"minSpan": 4,
"nullPointMode": "null",
"nullText": null,
"postfix": "",
"postfixFontSize": "70%",
"prefix": "",
"prefixFontSize": "50%",
"rangeMaps": [
{
"from": "null",
"text": "N/A",
"to": "null"
}
],
"sparkline": {
"fillColor": "rgba(31, 118, 189, 0.18)",
"full": false,
"lineColor": "rgb(31, 120, 193)",
"show": false
},
"tableColumn": "",
"targets": [
{
"expr": "node_memory_MemTotal_bytes{instance=~\"$node\"}",
"format": "time_series",
"instant": true,
"intervalFactor": 1,
"legendFormat": "{{instance}}",
"refId": "A",
"step": 20
}
],
"thresholds": "",
"title": "内存总量",
"type": "singlestat",
"valueFontSize": "80%",
"valueMaps": [
{
"op": "=",
"text": "N/A",
"value": "null"
}
],
"valueName": "current"
},
{
"cacheTimeout": null,
"colorBackground": false,
"colorValue": true,
"colors": [
"rgba(50, 172, 45, 0.97)",
"rgba(237, 129, 40, 0.89)",
"rgba(245, 54, 54, 0.9)"
],
"datasource": "${DS_PROMETHEUS}",
"decimals": 2,
"description": "",
"format": "percent",
"gauge": {
"maxValue": 100,
"minValue": 0,
"show": true,
"thresholdLabels": false,
"thresholdMarkers": true
},
"gridPos": {
"h": 5,
"w": 5,
"x": 4,
"y": 2
},
"id": 167,
"interval": null,
"links": [],
"mappingType": 1,
"mappingTypes": [
{
"name": "value to text",
"value": 1
},
{
"name": "range to text",
"value": 2
}
],
"maxDataPoints": 100,
"minSpan": 2,
"nullPointMode": "null",
"nullText": null,
"postfix": "",
"postfixFontSize": "50%",
"prefix": "",
"prefixFontSize": "50%",
"rangeMaps": [
{
"from": "null",
"text": "N/A",
"to": "null"
}
],
"sparkline": {
"fillColor": "rgba(31, 118, 189, 0.18)",
"full": false,
"lineColor": "rgb(31, 120, 193)",
"show": true
},
"tableColumn": "",
"targets": [
{
"expr": "100 - (avg(irate(node_cpu_seconds_total{instance=~\"$node\",mode=\"idle\"}[5m])) * 100)",
"format": "time_series",
"hide": false,
"interval": "",
"intervalFactor": 1,
"legendFormat": "",
"refId": "A",
"step": 20
}
],
"thresholds": "50,80",
"title": "CPU使用率(5m)",
"type": "singlestat",
"valueFontSize": "80%",
"valueMaps": [
{
"op": "=",
"text": "N/A",
"value": "null"
}
],
"valueName": "current"
},
{
"cacheTimeout": null,
"colorBackground": false,
"colorValue": true,
"colors": [
"rgba(50, 172, 45, 0.97)",
"rgba(237, 129, 40, 0.89)",
"rgba(245, 54, 54, 0.9)"
],
"datasource": "${DS_PROMETHEUS}",
"decimals": 2,
"description": "",
"format": "percent",
"gauge": {
"maxValue": 100,
"minValue": 0,
"show": true,
"thresholdLabels": false,
"thresholdMarkers": true
},
"gridPos": {
"h": 5,
"w": 5,
"x": 9,
"y": 2
},
"id": 20,
"interval": null,
"links": [],
"mappingType": 1,
"mappingTypes": [
{
"name": "value to text",
"value": 1
},
{
"name": "range to text",
"value": 2
}
],
"maxDataPoints": 100,
"minSpan": 2,
"nullPointMode": "null",
"nullText": null,
"postfix": "",
"postfixFontSize": "50%",
"prefix": "",
"prefixFontSize": "50%",
"rangeMaps": [
{
"from": "null",
"text": "N/A",
"to": "null"
}
],
"sparkline": {
"fillColor": "rgba(31, 118, 189, 0.18)",
"full": false,
"lineColor": "rgb(31, 120, 193)",
"show": true
},
"tableColumn": "",
"targets": [
{
"expr": "avg(irate(node_cpu_seconds_total{instance=~\"$node\",mode=\"iowait\"}[5m])) * 100",
"format": "time_series",
"hide": false,
"interval": "",
"intervalFactor": 1,
"legendFormat": "",
"refId": "A",
"step": 20
}
],
"thresholds": "20,50",
"title": "CPU iowait(5m)",
"type": "singlestat",
"valueFontSize": "80%",
"valueMaps": [
{
"op": "=",
"text": "N/A",
"value": "null"
}
],
"valueName": "current"
},
{
"cacheTimeout": null,
"colorBackground": false,
"colorValue": true,
"colors": [
"rgba(50, 172, 45, 0.97)",
"rgba(237, 129, 40, 0.89)",
"rgba(245, 54, 54, 0.9)"
],
"datasource": "${DS_PROMETHEUS}",
"decimals": 0,
"description": "",
"format": "percent",
"gauge": {
"maxValue": 100,
"minValue": 0,
"show": true,
"thresholdLabels": false,
"thresholdMarkers": true
},
"gridPos": {
"h": 5,
"w": 5,
"x": 14,
"y": 2
},
"hideTimeOverride": false,
"id": 172,
"interval": null,
"links": [],
"mappingType": 1,
"mappingTypes": [
{
"name": "value to text",
"value": 1
},
{
"name": "range to text",
"value": 2
}
],
"maxDataPoints": 100,
"minSpan": 4,
"nullPointMode": "null",
"nullText": null,
"postfix": "",
"postfixFontSize": "50%",
"prefix": "",
"prefixFontSize": "50%",
"rangeMaps": [
{
"from": "null",
"text": "N/A",
"to": "null"
}
],
"sparkline": {
"fillColor": "rgba(31, 118, 189, 0.18)",
"full": false,
"lineColor": "rgb(31, 120, 193)",
"show": true
},
"tableColumn": "",
"targets": [
{
"expr": "(1 - (node_memory_MemAvailable_bytes{instance=~\"$node\"} / (node_memory_MemTotal_bytes{instance=~\"$node\"})))* 100",
"format": "time_series",
"hide": false,
"interval": "10s",
"intervalFactor": 1,
"refId": "A",
"step": 20
}
],
"thresholds": "80,90",
"title": "内存使用率",
"type": "singlestat",
"valueFontSize": "80%",
"valueMaps": [],
"valueName": "current"
},
{
"cacheTimeout": null,
"colorBackground": false,
"colorPostfix": false,
"colorPrefix": false,
"colorValue": true,
"colors": [
"rgba(50, 172, 45, 0.97)",
"rgba(237, 129, 40, 0.89)",
"rgba(245, 54, 54, 0.9)"
],
"datasource": "${DS_PROMETHEUS}",
"decimals": 2,
"description": "",
"format": "short",
"gauge": {
"maxValue": 10000,
"minValue": null,
"show": true,
"thresholdLabels": false,
"thresholdMarkers": true
},
"gridPos": {
"h": 5,
"w": 5,
"x": 19,
"y": 2
},
"hideTimeOverride": false,
"id": 16,
"interval": null,
"links": [],
"mappingType": 1,
"mappingTypes": [
{
"name": "value to text",
"value": 1
},
{
"name": "range to text",
"value": 2
}
],
"maxDataPoints": 100,
"minSpan": 4,
"nullPointMode": "null",
"nullText": null,
"postfix": "",
"postfixFontSize": "50%",
"prefix": "",
"prefixFontSize": "50%",
"rangeMaps": [
{
"from": "null",
"text": "N/A",
"to": "null"
}
],
"sparkline": {
"fillColor": "rgba(31, 118, 189, 0.18)",
"full": false,
"lineColor": "rgb(31, 120, 193)",
"show": true
},
"tableColumn": "",
"targets": [
{
"expr": "node_filefd_allocated{instance=~\"$node\"}",
"format": "time_series",
"instant": false,
"interval": "10s",
"intervalFactor": 1,
"refId": "B"
}
],
"thresholds": "7000,9000",
"title": "当前打开的文件描述符",
"transparent": false,
"type": "singlestat",
"valueFontSize": "70%",
"valueMaps": [],
"valueName": "current"
},
{
"aliasColors": {
"15分钟": "#6ED0E0",
"1分钟": "#BF1B00",
"5分钟": "#CCA300"
},
"bars": false,
"dashLength": 10,
"dashes": false,
"datasource": "${DS_PROMETHEUS}",
"editable": true,
"error": false,
"fill": 1,
"grid": {},
"gridPos": {
"h": 6,
"w": 11,
"x": 0,
"y": 7
},
"height": "300",
"id": 13,
"legend": {
"alignAsTable": true,
"avg": true,
"current": true,
"max": true,
"min": false,
"rightSide": true,
"show": true,
"total": false,
"values": true
},
"lines": true,
"linewidth": 2,
"links": [],
"minSpan": 4,
"nullPointMode": "null as zero",
"percentage": false,
"pointradius": 5,
"points": false,
"renderer": "flot",
"repeat": null,
"seriesOverrides": [],
"spaceLength": 10,
"stack": false,
"steppedLine": false,
"targets": [
{
"expr": "node_load1{instance=~\"$node\"}",
"format": "time_series",
"instant": false,
"interval": "10s",
"intervalFactor": 2,
"legendFormat": "1m",
"metric": "",
"refId": "A",
"step": 20,
"target": ""
},
{
"expr": "node_load5{instance=~\"$node\"}",
"format": "time_series",
"instant": false,
"interval": "10s",
"intervalFactor": 2,
"legendFormat": "5m",
"refId": "B",
"step": 20
},
{
"expr": "node_load15{instance=~\"$node\"}",
"format": "time_series",
"instant": false,
"interval": "10s",
"intervalFactor": 2,
"legendFormat": "15m",
"refId": "C",
"step": 20
}
],
"thresholds": [],
"timeFrom": null,
"timeRegions": [],
"timeShift": null,
"title": "系统平均负载",
"tooltip": {
"msResolution": false,
"shared": true,
"sort": 0,
"value_type": "cumulative"
},
"type": "graph",
"xaxis": {
"buckets": null,
"mode": "time",
"name": null,
"show": true,
"values": []
},
"yaxes": [
{
"format": "short",
"logBase": 1,
"max": null,
"min": null,
"show": true
},
{
"format": "short",
"logBase": 1,
"max": null,
"min": null,
"show": true
}
],
"yaxis": {
"align": false,
"alignLevel": null
}
},
{
"columns": [],
"datasource": "${DS_PROMETHEUS}",
"fontSize": "120%",
"gridPos": {
"h": 6,
"w": 13,
"x": 11,
"y": 7
},
"id": 164,
"links": [],
"pageSize": null,
"scroll": true,
"showHeader": true,
"sort": {
"col": 11,
"desc": true
},
"styles": [
{
"alias": "Time",
"dateFormat": "YYYY-MM-DD HH:mm:ss",
"pattern": "Time",
"type": "hidden"
},
{
"alias": "分区",
"colorMode": null,
"colors": [
"rgba(50, 172, 45, 0.97)",
"rgba(237, 129, 40, 0.89)",
"rgba(245, 54, 54, 0.9)"
],
"dateFormat": "YYYY-MM-DD HH:mm:ss",
"decimals": 2,
"mappingType": 1,
"pattern": "mountpoint",
"thresholds": [
""
],
"type": "string",
"unit": "bytes"
},
{
"alias": "可用空间",
"colorMode": "value",
"colors": [
"rgba(245, 54, 54, 0.9)",
"rgba(237, 129, 40, 0.89)",
"rgba(50, 172, 45, 0.97)"
],
"dateFormat": "YYYY-MM-DD HH:mm:ss",
"decimals": 2,
"mappingType": 1,
"pattern": "Value #A",
"thresholds": [
"10000000000",
"20000000000"
],
"type": "number",
"unit": "bytes"
},
{
"alias": "使用率",
"colorMode": "cell",
"colors": [
"rgba(50, 172, 45, 0.97)",
"rgba(237, 129, 40, 0.89)",
"rgba(245, 54, 54, 0.9)"
],
"dateFormat": "YYYY-MM-DD HH:mm:ss",
"decimals": 2,
"mappingType": 1,
"pattern": "Value #B",
"thresholds": [
"70",
"90"
],
"type": "number",
"unit": "percentunit"
},
{
"alias": "总空间",
"colorMode": null,
"colors": [
"rgba(245, 54, 54, 0.9)",
"rgba(237, 129, 40, 0.89)",
"rgba(50, 172, 45, 0.97)"
],
"dateFormat": "YYYY-MM-DD HH:mm:ss",
"decimals": 1,
"link": false,
"mappingType": 1,
"pattern": "Value #C",
"thresholds": [],
"type": "number",
"unit": "bytes"
},
{
"alias": "文件系统",
"colorMode": null,
"colors": [
"rgba(245, 54, 54, 0.9)",
"rgba(237, 129, 40, 0.89)",
"rgba(50, 172, 45, 0.97)"
],
"dateFormat": "YYYY-MM-DD HH:mm:ss",
"decimals": 2,
"link": false,
"mappingType": 1,
"pattern": "fstype",
"thresholds": [],
"type": "number",
"unit": "short"
},
{
"alias": "",
"colorMode": null,
"colors": [
"rgba(245, 54, 54, 0.9)",
"rgba(237, 129, 40, 0.89)",
"rgba(50, 172, 45, 0.97)"
],
"decimals": 2,
"pattern": "/.*/",
"preserveFormat": true,
"sanitize": false,
"thresholds": [],
"type": "hidden",
"unit": "short"
}
],
"targets": [
{
"expr": "node_filesystem_size{instance=~'$node',fstype=~\"ext4|xfs\"}",
"format": "table",
"hide": true,
"instant": true,
"intervalFactor": 1,
"legendFormat": "",
"refId": "C"
},
{
"expr": "node_filesystem_avail_bytes{instance=~'$node',fstype=~\"ext4|xfs\"}",
"format": "table",
"hide": false,
"instant": true,
"interval": "10s",
"intervalFactor": 1,
"legendFormat": "",
"refId": "A"
},
{
"expr": "1-(node_filesystem_free_bytes{instance=~'$node',fstype=~\"ext4|xfs\"} / node_filesystem_size_bytes{instance=~'$node',fstype=~\"ext4|xfs\"})",
"format": "table",
"hide": false,
"instant": true,
"intervalFactor": 1,
"legendFormat": "",
"refId": "B"
},
{
"expr": "",
"format": "table",
"interval": "10s",
"intervalFactor": 1,
"legendFormat": "",
"refId": "D"
}
],
"title": "各分区可用空间",
"transform": "table",
"transparent": false,
"type": "table"
},
{
"aliasColors": {
"Idle - Waiting for something to happen": "#052B51",
"guest": "#9AC48A",
"idle": "#052B51",
"iowait": "#EAB839",
"irq": "#BF1B00",
"nice": "#C15C17",
"sdb_每秒I/O操作%": "#d683ce",
"softirq": "#E24D42",
"steal": "#FCE2DE",
"system": "#508642",
"user": "#5195CE",
"磁盘花费在I/O操作占比": "#ba43a9"
},
"bars": false,
"dashLength": 10,
"dashes": false,
"datasource": "${DS_PROMETHEUS}",
"decimals": 2,
"description": "node_disk_io_time_seconds_total:\n磁盘花费在输入/输出操作上的毫秒数。该值为累加值。(Milliseconds Spent Doing I/Os)\n\nirate(node_disk_io_time_seconds_total[1m]):\n计算每秒的速率:(last值-last前一个值)/时间戳差值,即:1秒钟内磁盘花费在I/O操作的时间占比。",
"fill": 1,
"gridPos": {
"h": 7,
"w": 14,
"x": 0,
"y": 13
},
"id": 7,
"legend": {
"alignAsTable": true,
"avg": true,
"current": true,
"hideEmpty": true,
"hideZero": true,
"max": true,
"min": false,
"rightSide": true,
"show": true,
"sideWidth": null,
"sort": null,
"sortDesc": null,
"total": false,
"values": true
},
"lines": true,
"linewidth": 1,
"links": [],
"minSpan": 4,
"nullPointMode": "null",
"percentage": false,
"pointradius": 5,
"points": false,
"renderer": "flot",
"repeat": null,
"seriesOverrides": [],
"spaceLength": 10,
"stack": false,
"steppedLine": false,
"targets": [
{
"expr": "avg(irate(node_cpu_seconds_total{instance=~\"$node\",mode=\"system\"}[1m]))",
"format": "time_series",
"interval": "",
"intervalFactor": 2,
"legendFormat": "System",
"refId": "A",
"step": 20
},
{
"expr": "avg(irate(node_cpu_seconds_total{instance=~\"$node\",mode=\"user\"}[1m]))",
"format": "time_series",
"intervalFactor": 2,
"legendFormat": "User",
"refId": "B",
"step": 240
},
{
"expr": "avg(irate(node_cpu_seconds_total{instance=~\"$node\",mode=\"idle\"}[1m]))",
"format": "time_series",
"hide": true,
"intervalFactor": 2,
"legendFormat": "Idle",
"refId": "F",
"step": 240
},
{
"expr": "avg(irate(node_cpu_seconds_total{instance=~\"$node\",mode=\"iowait\"}[1m]))",
"format": "time_series",
"intervalFactor": 2,
"legendFormat": "Iowait",
"refId": "D",
"step": 240
},
{
"expr": "irate(node_disk_io_time_seconds_total{instance=~\"$node\"}[1m])",
"format": "time_series",
"intervalFactor": 1,
"legendFormat": "{{device}}_每秒I/O操作%",
"refId": "C"
}
],
"thresholds": [],
"timeFrom": null,
"timeRegions": [],
"timeShift": null,
"title": "CPU使用率、磁盘每秒的I/O操作耗费时间(%)",
"tooltip": {
"shared": true,
"sort": 0,
"value_type": "individual"
},
"transparent": false,
"type": "graph",
"xaxis": {
"buckets": null,
"mode": "time",
"name": null,
"show": true,
"values": []
},
"yaxes": [
{
"decimals": null,
"format": "percentunit",
"label": "",
"logBase": 1,
"max": null,
"min": null,
"show": true
},
{
"format": "short",
"label": null,
"logBase": 1,
"max": null,
"min": null,
"show": false
}
],
"yaxis": {
"align": false,
"alignLevel": null
}
},
{
"aliasColors": {
"内存_Avaliable": "#6ED0E0",
"内存_Cached": "#EF843C",
"内存_Free": "#629E51",
"内存_Total": "#6d1f62",
"内存_Used": "#eab839",
"可用": "#9ac48a",
"总内存": "#bf1b00"
},
"bars": false,
"dashLength": 10,
"dashes": false,
"datasource": "${DS_PROMETHEUS}",
"decimals": 2,
"fill": 6,
"gridPos": {
"h": 7,
"w": 10,
"x": 14,
"y": 13
},
"height": "300",
"id": 156,
"legend": {
"alignAsTable": false,
"avg": false,
"current": true,
"max": false,
"min": false,
"rightSide": false,
"show": true,
"total": false,
"values": true
},
"lines": true,
"linewidth": 3,
"links": [],
"nullPointMode": "null",
"percentage": false,
"pointradius": 5,
"points": false,
"renderer": "flot",
"seriesOverrides": [],
"spaceLength": 10,
"stack": false,
"steppedLine": false,
"targets": [
{
"expr": "node_memory_MemTotal_bytes_{instance=~\"$node\"}",
"format": "time_series",
"hide": false,
"instant": false,
"intervalFactor": 2,
"legendFormat": "总内存",
"refId": "A",
"step": 4
},
{
"expr": "node_memory_MemTotal_bytes{instance=~\"$node\"} - node_memory_MemAvailable_bytes{instance=~\"$node\"}",
"format": "time_series",
"hide": false,
"intervalFactor": 2,
"legendFormat": "已用",
"refId": "B",
"step": 4
},
{
"expr": "node_memory_MemFree_bytes{instance=~\"$node\"}",
"format": "time_series",
"hide": true,
"intervalFactor": 2,
"legendFormat": "内存_Free",
"refId": "C",
"step": 4
},
{
"expr": "node_memory_Buffers_bytes{instance=~\"$node\"}",
"format": "time_series",
"hide": true,
"intervalFactor": 2,
"legendFormat": "内存_Buffers",
"refId": "D",
"step": 4
},
{
"expr": "node_memory_Cached_bytes{instance=~\"$node\"}",
"format": "time_series",
"hide": true,
"intervalFactor": 2,
"legendFormat": "内存_Cached",
"refId": "E",
"step": 4
},
{
"expr": "node_memory_MemAvailable_bytes{instance=~\"$node\"}",
"format": "time_series",
"hide": false,
"interval": "",
"intervalFactor": 2,
"legendFormat": "可用",
"refId": "F",
"step": 4
},
{
"expr": "node_memory_MemTotal_bytes{instance=~\"$node\"} - (node_memory_Cached_bytes{instance=~\"$node\"} + node_memory_Buffers_bytes{instance=~\"$node\"} + node_memory_MemFree_bytes{instance=~\"$node\"})",
"format": "time_series",
"hide": true,
"intervalFactor": 1,
"refId": "G"
}
],
"thresholds": [],
"timeFrom": null,
"timeRegions": [],
"timeShift": null,
"title": "内存信息",
"tooltip": {
"shared": true,
"sort": 0,
"value_type": "individual"
},
"type": "graph",
"xaxis": {
"buckets": null,
"mode": "time",
"name": null,
"show": true,
"values": []
},
"yaxes": [
{
"format": "bytes",
"label": null,
"logBase": 1,
"max": null,
"min": "0",
"show": true
},
{
"format": "short",
"label": null,
"logBase": 1,
"max": null,
"min": null,
"show": true
}
],
"yaxis": {
"align": false,
"alignLevel": null
}
},
{
"aliasColors": {
"vda_write": "#6ED0E0"
},
"bars": true,
"dashLength": 10,
"dashes": false,
"datasource": "${DS_PROMETHEUS}",
"description": "Reads completed: 每个磁盘分区每秒读完成次数\n\nWrites completed: 每个磁盘分区每秒写完成次数\n\nIO now 每个磁盘分区每秒正在处理的输入/输出请求数",
"fill": 2,
"gridPos": {
"h": 8,
"w": 11,
"x": 0,
"y": 20
},
"height": "300",
"id": 161,
"legend": {
"alignAsTable": false,
"avg": false,
"current": true,
"hideEmpty": true,
"hideZero": true,
"max": true,
"min": false,
"show": true,
"total": false,
"values": true
},
"lines": false,
"linewidth": 1,
"links": [],
"nullPointMode": "null",
"percentage": false,
"pointradius": 5,
"points": false,
"renderer": "flot",
"seriesOverrides": [
{
"alias": "/.*_读取$/",
"transform": "negative-Y"
}
],
"spaceLength": 10,
"stack": false,
"steppedLine": false,
"targets": [
{
"expr": "irate(node_disk_reads_completed_total{instance=~\"$node\"}[1m])",
"format": "time_series",
"hide": false,
"interval": "",
"intervalFactor": 2,
"legendFormat": "{{device}}_读取",
"refId": "A",
"step": 10
},
{
"expr": "irate(node_disk_writes_completed_total{instance=~\"$node\"}[1m])",
"format": "time_series",
"hide": false,
"intervalFactor": 2,
"legendFormat": "{{device}}_写入",
"refId": "B",
"step": 10
},
{
"expr": "node_disk_io_now{instance=~\"$node\"}",
"format": "time_series",
"hide": true,
"interval": "",
"intervalFactor": 1,
"legendFormat": "{{device}}",
"refId": "C"
}
],
"thresholds": [],
"timeFrom": null,
"timeRegions": [],
"timeShift": null,
"title": "磁盘读写速率(IOPS)",
"tooltip": {
"shared": true,
"sort": 0,
"value_type": "individual"
},
"type": "graph",
"xaxis": {
"buckets": null,
"mode": "time",
"name": null,
"show": true,
"values": []
},
"yaxes": [
{
"decimals": null,
"format": "iops",
"label": "读取(-)/写入(+)I/O ops/sec",
"logBase": 1,
"max": null,
"min": null,
"show": true
},
{
"format": "short",
"label": null,
"logBase": 1,
"max": null,
"min": null,
"show": true
}
],
"yaxis": {
"align": false,
"alignLevel": null
}
},
{
"aliasColors": {
"TCP": "#6ED0E0"
},
"bars": false,
"dashLength": 10,
"dashes": false,
"datasource": "${DS_PROMETHEUS}",
"description": "CurrEstab - 当前状态为 ESTABLISHED 或 CLOSE-WAIT 的 TCP 连接数\n\nActiveOpens - 已从 CLOSED 状态直接转换到 SYN-SENT 状态的 TCP 平均连接数(1分钟内)\n\nPassiveOpens - 已从 LISTEN 状态直接转换到 SYN-RCVD 状态的 TCP 平均连接数(1分钟内)\n\nTCP_alloc - 已分配(已建立、已申请到sk_buff)的TCP套接字数量\n\nTCP_inuse - 正在使用(正在侦听)的TCP套接字数量\n\nTCP_tw - 等待关闭的TCP连接数",
"fill": 0,
"gridPos": {
"h": 8,
"w": 13,
"x": 11,
"y": 20
},
"height": "300",
"id": 158,
"legend": {
"alignAsTable": true,
"avg": false,
"current": true,
"max": true,
"min": false,
"rightSide": true,
"show": true,
"total": false,
"values": true
},
"lines": true,
"linewidth": 1,
"links": [],
"nullPointMode": "null",
"percentage": false,
"pointradius": 5,
"points": false,
"renderer": "flot",
"seriesOverrides": [],
"spaceLength": 10,
"stack": false,
"steppedLine": false,
"targets": [
{
"expr": "node_netstat_Tcp_CurrEstab{instance=~'$node'}",
"format": "time_series",
"hide": false,
"interval": "10s",
"intervalFactor": 1,
"legendFormat": "ESTABLISHED",
"refId": "A",
"step": 20
},
{
"expr": "node_sockstat_TCP_tw{instance=~'$node'}",
"format": "time_series",
"intervalFactor": 1,
"legendFormat": "TCP_tw",
"refId": "D"
},
{
"expr": "irate(node_netstat_Tcp_ActiveOpens{instance=~'$node'}[1m])",
"format": "time_series",
"hide": false,
"intervalFactor": 1,
"legendFormat": "ActiveOpens",
"refId": "B"
},
{
"expr": "irate(node_netstat_Tcp_PassiveOpens{instance=~'$node'}[1m])",
"format": "time_series",
"intervalFactor": 1,
"legendFormat": "PassiveOpens",
"refId": "C"
},
{
"expr": "node_sockstat_TCP_alloc{instance=~'$node'}",
"format": "time_series",
"intervalFactor": 1,
"legendFormat": "TCP_alloc",
"refId": "E"
},
{
"expr": "node_sockstat_TCP_inuse{instance=~'$node'}",
"format": "time_series",
"intervalFactor": 1,
"legendFormat": "TCP_inuse",
"refId": "F"
}
],
"thresholds": [],
"timeFrom": null,
"timeRegions": [],
"timeShift": null,
"title": "TCP 连接情况",
"tooltip": {
"shared": true,
"sort": 0,
"value_type": "individual"
},
"transparent": false,
"type": "graph",
"xaxis": {
"buckets": null,
"mode": "time",
"name": null,
"show": true,
"values": []
},
"yaxes": [
{
"format": "short",
"label": null,
"logBase": 1,
"max": null,
"min": null,
"show": true
},
{
"format": "short",
"label": null,
"logBase": 1,
"max": null,
"min": null,
"show": true
}
],
"yaxis": {
"align": false,
"alignLevel": null
}
},
{
"aliasColors": {},
"bars": false,
"dashLength": 10,
"dashes": false,
"datasource": "${DS_PROMETHEUS}",
"fill": 1,
"gridPos": {
"h": 8,
"w": 24,
"x": 0,
"y": 28
},
"height": "300",
"id": 157,
"legend": {
"alignAsTable": false,
"avg": false,
"current": true,
"hideEmpty": true,
"hideZero": true,
"max": false,
"min": false,
"show": true,
"total": false,
"values": true
},
"lines": true,
"linewidth": 2,
"links": [],
"nullPointMode": "null",
"percentage": false,
"pointradius": 5,
"points": false,
"renderer": "flot",
"seriesOverrides": [
{
"alias": "/.*_out上传$/",
"transform": "negative-Y"
}
],
"spaceLength": 10,
"stack": false,
"steppedLine": false,
"targets": [
{
"expr": "irate(node_network_receive_bytes_total{instance=~'$node',device!~'tap.*'}[5m])*8",
"format": "time_series",
"intervalFactor": 2,
"legendFormat": "{{device}}_in下载",
"refId": "A",
"step": 4
},
{
"expr": "irate(node_network_transmit_bytes_total{instance=~'$node',device!~'tap.*'}[5m])*8",
"format": "time_series",
"intervalFactor": 2,
"legendFormat": "{{device}}_out上传",
"refId": "B",
"step": 4
}
],
"thresholds": [],
"timeFrom": null,
"timeRegions": [],
"timeShift": null,
"title": "网络流量",
"tooltip": {
"shared": true,
"sort": 0,
"value_type": "individual"
},
"type": "graph",
"xaxis": {
"buckets": null,
"mode": "time",
"name": null,
"show": true,
"values": []
},
"yaxes": [
{
"format": "bps",
"label": "上传(-)/下载(+)",
"logBase": 1,
"max": null,
"min": null,
"show": true
},
{
"format": "short",
"label": null,
"logBase": 1,
"max": null,
"min": null,
"show": false
}
],
"yaxis": {
"align": false,
"alignLevel": null
}
}
],
"refresh": false,
"schemaVersion": 16,
"style": "dark",
"tags": [
"StarsL",
"Prometheus"
],
"templating": {
"list": [
{
"auto": true,
"auto_count": 30,
"auto_min": "10s",
"current": {
"text": "1m",
"value": "1m"
},
"hide": 0,
"label": "interval",
"name": "interval",
"options": [
{
"selected": false,
"text": "auto",
"value": "$__auto_interval_interval"
},
{
"selected": true,
"text": "1m",
"value": "1m"
},
{
"selected": false,
"text": "10m",
"value": "10m"
},
{
"selected": false,
"text": "30m",
"value": "30m"
},
{
"selected": false,
"text": "1h",
"value": "1h"
},
{
"selected": false,
"text": "6h",
"value": "6h"
},
{
"selected": false,
"text": "12h",
"value": "12h"
},
{
"selected": false,
"text": "1d",
"value": "1d"
},
{
"selected": false,
"text": "7d",
"value": "7d"
},
{
"selected": false,
"text": "14d",
"value": "14d"
},
{
"selected": false,
"text": "30d",
"value": "30d"
}
],
"query": "1m,10m,30m,1h,6h,12h,1d,7d,14d,30d",
"refresh": 2,
"skipUrlSync": false,
"type": "interval"
},
{
"allFormat": "glob",
"allValue": null,
"current": {},
"datasource": "${DS_PROMETHEUS}",
"definition": "",
"hide": 0,
"includeAll": false,
"label": "环境",
"multi": false,
"multiFormat": "regex values",
"name": "env",
"options": [],
"query": "label_values(node_exporter_build_info,env)",
"refresh": 1,
"regex": "",
"skipUrlSync": false,
"sort": 1,
"tagValuesQuery": "",
"tags": [],
"tagsQuery": "",
"type": "query",
"useTags": false
},
{
"allFormat": "glob",
"allValue": null,
"current": {},
"datasource": "${DS_PROMETHEUS}",
"definition": "",
"hide": 0,
"includeAll": false,
"label": "主机名",
"multi": false,
"multiFormat": "regex values",
"name": "name",
"options": [],
"query": "label_values(node_exporter_build_info{env='$env'},name)",
"refresh": 1,
"regex": "",
"skipUrlSync": false,
"sort": 1,
"tagValuesQuery": "",
"tags": [],
"tagsQuery": "",
"type": "query",
"useTags": false
},
{
"allFormat": "glob",
"allValue": null,
"current": {},
"datasource": "${DS_PROMETHEUS}",
"definition": "",
"hide": 0,
"includeAll": false,
"label": "节点",
"multi": false,
"multiFormat": "regex values",
"name": "node",
"options": [],
"query": "label_values(node_exporter_build_info{name='$name'},instance)",
"refresh": 1,
"regex": "",
"skipUrlSync": false,
"sort": 1,
"tagValuesQuery": "",
"tags": [],
"tagsQuery": "",
"type": "query",
"useTags": false
},
{
"allValue": null,
"current": {},
"datasource": "${DS_PROMETHEUS}",
"definition": "",
"hide": 2,
"includeAll": false,
"label": "",
"multi": false,
"name": "maxmount",
"options": [],
"query": "query_result(topk(1,sort_desc (max(node_filesystem_size_bytes{instance=~'$node',fstype=~\"ext4|xfs\"}) by (mountpoint))))",
"refresh": 1,
"regex": "/.*\\\"(.*)\\\".*/",
"skipUrlSync": false,
"sort": 0,
"tagValuesQuery": "",
"tags": [],
"tagsQuery": "",
"type": "query",
"useTags": false
}
]
},
"time": {
"from": "now-5m",
"to": "now"
},
"timepicker": {
"now": true,
"refresh_intervals": [
"5s",
"10s",
"30s",
"1m",
"5m",
"15m",
"30m",
"1h",
"2h",
"1d"
],
"time_options": [
"5m",
"15m",
"1h",
"6h",
"12h",
"24h",
"2d",
"7d",
"30d"
]
},
"timezone": "browser",
"title": "1 Node Exporter 0.16 0.17 for Prometheus 监控展示看板",
"uid": "9CWBz0bik",
"version": 11
}
node_exporter.json
导入docker_rev1.json监控模板,步骤和上面导入node_exporter.json步骤一样,导入之后显示如下:
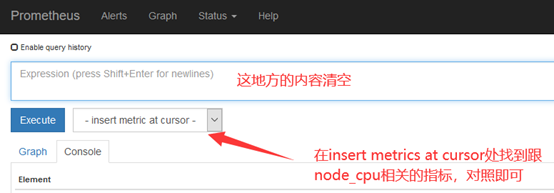
扩展:如果Grafana导入Prometheusz之后,发现仪表盘没有数据,如何排查?
1、打开grafana界面,找到仪表盘对应无数据的图标

Edit之后出现如下:
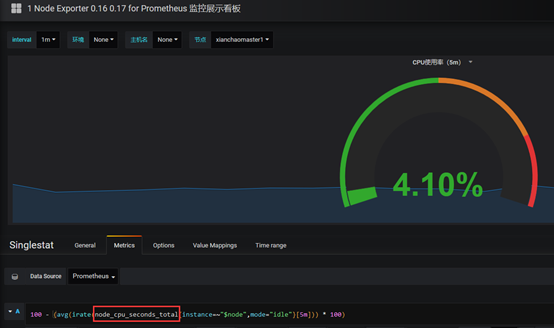
node_cpu_seconds_total 就是grafana上采集的cpu的时间,需要到prometheus ui界面看看采集的指标是否是node_cpu_seconds_total
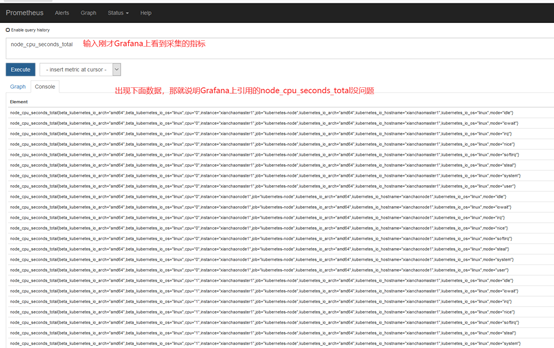
如果在prometheus ui界面输入node_cpu_seconds_total没有数据,那就看看是不是prometheus采集的数据是node_cpu_seconds_totals,怎么看呢?
###grafana展示的数据promQL调用的prometheus,可自己写。显示的名称可参照prometheus多维标签查询结果自定义。
prometheus(3)之grafan可视化展现的更多相关文章
- d3js网络拓扑关系特效可视化展现
d3js拓扑关系特效可视化展现 在上一篇d3js文档http://www.cnblogs.com/juandx/p/3959900.html中讲了简单的d3js方法和效果,现在我做一个完整的演示,使用 ...
- python读取excel数据,并可视化展现
#-*- coding: utf-8 -*- import pandas as pda import matplotlib.pyplot as pyl import matplotlib.font_m ...
- Grafana+Prometheus 搭建 JuiceFS 可视化监控系统
作为承载海量数据存储的分布式文件系统,用户通常需要直观地了解整个系统的容量.文件数量.CPU 负载.磁盘 IO.缓存等指标的变化. JuiceFS 没有重复造轮子,而是通过 Prometheus 兼容 ...
- Prometheus 架构 - 每天5分钟玩转 Docker 容器技术(83)
Prometheus 是一个非常优秀的监控工具.准确的说,应该是监控方案.Prometheus 提供了监控数据搜集.存储.处理.可视化和告警一套完整的解决方案. 让我们先来看看 Prometheus ...
- Prometheus Operator 架构 - 每天5分钟玩转 Docker 容器技术(178)
本节讨论 Prometheus Operator 的架构.因为 Prometheus Operator 是基于 Prometheus 的,我们需要先了解一下 Prometheus. Prometheu ...
- Prometheus部署监控容器
Prometheus架构描述 Prometheus 是一个非常优秀的监控工具.准确的说,应该是监控方案.Prometheus 提供了监控数据搜集.存储.处理.可视化和告警一套完整的解决方案 Prome ...
- 【转载一】Grafana –美观、强大的可视化监控指标展示工具
在之前的InfluxDB系列教程 中,我们给大家介绍了当下流行的一款时序数据库--InfluxDB. 接下来给大家带来一款强大的,与InfluxDB搭配使用的前端指标项展示项目--Grafana. G ...
- [k8s]prometheus+grafana监控node和mysql(普罗/grafana均vm安装)
https://github.com/prometheus/prometheus Architecture overview Prometheus Server Prometheus Server 负 ...
- Prometheus 监控领域最锋利的“瑞士军刀”
原文:https://mp.weixin.qq.com/s/Cujn6_4w8ZcXCOWpoAStvQ 一.Kubernetes 容器监控的标配—Prometheus 1.简介 Prometheus ...
随机推荐
- css宽度+字体+颜色+边框+文本+光标+伪类选择器
常用属性: width:宽 height:高 min-width:最小宽度 :可以设置如果宽度变小了,有个滑动效果(常常在我们布局的过程中需要去设置) min-height;最小高度 max-widt ...
- 安卓模拟器genymotion安装
上一篇已经讲了appium的搭建.那么搭建好后,我们需要测试不同机型,这个时候除了真机外,可以选择安装模拟器.市面上的模拟器有很多:夜神.逍遥.mumu.android emulator.genymo ...
- 【Vue】淘气三千问之 data为什么是函数而不是对象?这河狸吗
朋友,当你提出以上问题的时候建议你先去复习下原型链的知识 但是我好人做到底直接就讲了吧,我们先看一下下面的这段代码: function Component () { this.data = this. ...
- Dapr + .NET Core实战(九)本地调试
前几节开发Dapr应用程序时,我们使用 dapr cli 来启动dapr服务,就像这样: dapr run --dapr-http-port 3501 --app-port 5001 --app-id ...
- HttpRunner3.X - 全面讲解如何落地项目实战
一.前言 接触httprunner框架有一段时间了,也一直探索如何更好的落地到项目上,本篇主要讲述如何应用到实际的项目中,达到提升测试效率的目的. 1.项目难题 这个月开始忙起来了,接了个大项目,苦不 ...
- 11.4.1 LVS-DR
Virtual Server via Direct Routing(VS-DR): 用直接路由技术实现虚拟服务器。当参与集群的计算机和作为控制管理的计算机在同一个网段时可以用此方法,控制管理的计算机接 ...
- asp.net core使用identity+jwt保护你的webapi(二)——获取jwt token
前言 上一篇已经介绍了identity在web api中的基本配置,本篇来完成用户的注册,登录,获取jwt token. 开始 开始之前先配置一下jwt相关服务. 配置JWT 首先NuGet安装包: ...
- SphereEx 创始人张亮云咖访谈回顾:构建数据服务的新思路
2021 年 7 月 21 日,2021 亚马逊云科技中国峰会在上海盛大开幕.本次大会以"构建新格局,共赢云时代"为主题,邀请到来自技术社区.开源软件基金会.开源创业代表.女性开发 ...
- opencv中的exp32f函数
exp32f opencv的exp函数和cmath的exp函数在精度上存在一定差异,通过查找源码,发现了这么一段实现.代码如下: 点击查看代码 #define EXPTAB_SCALE 6 #defi ...
- Java(36)IO流案例与总结
作者:季沐测试笔记 原文地址:https://www.cnblogs.com/testero/p/15228455.html 博客主页:https://www.cnblogs.com/testero ...