d3js网络拓扑关系特效可视化展现
d3js拓扑关系特效可视化展现
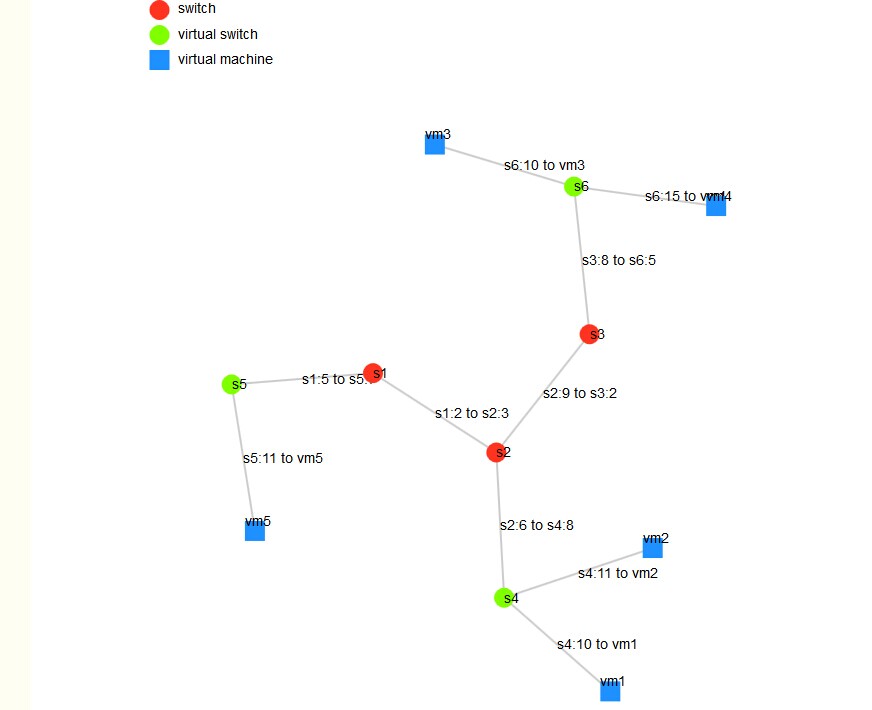
在上一篇d3js文档http://www.cnblogs.com/juandx/p/3959900.html中讲了简单的d3js方法和效果,现在我做一个完整的演示,使用d3js来展现动态可视化的网络拓扑效果图,希望对大家有所帮助。
<%= render partial: 'bar' %>
<style>
.table td{
text-align: center;
}
td .progress {
margin-bottom: 0;
width: 175px;
}
td .progress-text {
position: absolute;
width: 175px;
text-align: center;
}
.tdwidth{width:175px;}
.progress {
margin-bottom: 0;
width: 175px;
}
.progress-text {
position: absolute;
width: 175px;
text-align: center;
}
</style> <head>
<style type="text/css">
body
{
height: 100%;
}
</style>
<meta charset="utf-8">
<title>D3 Page Template</title>
<script type="text/javascript" src="d3/d3.js"></script>
</head>
<body>
<% vts_size = @vts.size %>
<% sts_size = @sts.size %>
<% stvs_size = @stvs.size %>
<% all_size = vts_size + sts_size + stvs_size %>
<% v_and_s = Array.new(all_size ) %>
<% for i in 0..sts_size-1 do %>
<% v_and_s[i] = @sts[i] %>
<% end %>
<% for i in sts_size..sts_size+vts_size-1 do %>
<% v_and_s[i] = @vts[i-sts_size] %>
<% end %>
<% for i in sts_size+vts_size..all_size do %>
<% v_and_s[i] = @vts[i-sts_size-vts_size] %>
<% end %> <svg width="200" height="100">
<circle cx="12" cy="10" r="10" fill="#FF3420"/>
<circle cx="12" cy="35" r="10" fill="#7FFF00"/>
<rect x="2" y="50" width="20" height="20" style="fill:#1E90FF" />
<text x="30" y="13" fill="black">switch</text>
<text x="30" y="39" fill="black">virtual switch</text>
<text x="30" y="64" fill="black">virtual machine</text>
</svg> <script type="text/javascript" charset="utf-8">
var w = 1200;
var h = 600;
var names = [];
var sts_size = <%= sts_size %>;
var vts_size = <%= vts_size %>;
var stvs_size = <%= stvs_size %>
var all_size = <%= all_size %>;
var i = 0;
var j = 0;
var k = 0;
var nodes = [];
var edges = [];
var sts1_array = new Array();
var sts1_used = new Array();
var all_array = new Array();
for(i = 0; i < sts_size/2; ++i)
{
all_array[i] = new Array();
}
//把sts表导成一个二维数组sts1_array
for(i = 0; i < sts_size; ++i)
{
sts1_array[i] = new Array();
sts1_used[i] = 0;
}
i = 0;
<% for i in 0..sts_size-1 do %>
sts1_array[i][0] = "<%= @sts[i].switch_name %>";
sts1_array[i][1] = "<%= @sts[i].port %>";
sts1_array[i][2] = "<%= @sts[i].next_hop_name %>";
++i;
<% end %>
var kk = sts1_array[0];
//把sts1_array搞成s的关系表放入all_array
i = 0;
j = 0;
k = 0;
for(i = 0; i < sts_size; ++i)
{
if(sts1_used[i] == 0)
{
var x1 = sts1_array[i];
var x2id = 0;
for(j = i+1; j < sts_size; ++j)
{
var x2 = sts1_array[j];
x2id = j;
if(x1[0] == x2[2] && x1[2] == x2[0])
{
sts1_used[i] = 1;
sts1_used[j] = 1;
break;
}
}
all_array[k][0] = x1[0];
all_array[k][1] = x1[0] + ":" + x1[1] + " to " + sts1_array[x2id][0] + ":" + sts1_array[x2id][1];
all_array[k][2] = x1[2];
++k;
}
}
//对all_array排序
all_array.sort(function(a,b)
{
if(a[0] > b[0])return 1;
else if(a[0] == b[0])return a[2]>b[2]?1:-1;
else return -1;
});
//把s放入hashtables里
var hashTable = new Object();
var ids = [];
var idnum = 0;
for(i = 0; i < sts_size/2; ++i)
{
var x1 = all_array[i];
if(x1[0] in hashTable){}
else
{
hashTable[x1[0]] = idnum++;
ids.push(x1[0]);
}
if(x1[2] in hashTable){continue;}
else
{
hashTable[x1[2]] = idnum++;
ids.push(x1[2]);
}
}
//把vts表导成一个二维数组放入all_array
for(i = sts_size/2; i < vts_size + sts_size/2; ++i)
{
all_array[i] = new Array();
}
<% for i in 0..vts_size-1 do %>
all_array[k][0] = "<%= @vts[i].vm_name %>";
all_array[k][2] = "<%= @vts[i].switch_name %>";
all_array[k][1] = all_array[k][2] + ":<%= @vts[i].port %> to " + all_array[k][0];
//把vm放入hashtables里
if(all_array[k][0] in hashTable){}
else
{
hashTable[all_array[k][0]] = idnum++;
ids.push(all_array[k][0]);
}
++k;
<% end %>
//把stvs表放入all_array
for(i = vts_size + sts_size/2; i < vts_size + sts_size/2 + stvs_size; ++i)
{
all_array[i] = new Array();
}
var hashTable2 = new Object();
<% for i in 0..stvs_size-1 do %>
all_array[k][0] = "<%= @stvs[i].switch %>";
all_array[k][1] = "<%= @stvs[i].type_s %>";
hashTable2[all_array[k][0]] = all_array[k][1];
++k;
<% end %>
//生成nodes
all_size = sts_size/2 + vts_size;
for(i = 0;i < idnum - vts_size; ++i)
{
var node1 =
{
"name": ids[i],
"type": "circle",
"switch_type": hashTable2[ids[i]]
};
nodes.push(node1);
}
for(i = idnum - vts_size;i < idnum; ++i)
{
var node1 =
{
"name": ids[i],
"type": "rect",
"switch_type": "rect"
};
nodes.push(node1);
}
//alert(nodes[1].name);
//生成edges 关系都在all_array中
for(i = 0 ; i < all_size; ++i)
{
var ss = hashTable[all_array[i][0]];
var tt = hashTable[all_array[i][2]];
var desc = all_array[i][1];
var edges1 =
{
"source": ss,
"target": tt,
"des": desc
};
edges.push(edges1);
}
//下面开始画图
var color = d3.scale.category20();
var svg = d3.select("body")
.append("svg")
.attr("width", w)
.attr("height", h);
var force2 = d3.layout.force()
.nodes(nodes)
.links(edges)
.size([w, h])
.linkDistance([130])
.charge([-2000])
.gravity(0.15);
force2.start();
var stroke_color = "black";
var stroke_width = "0.5";
var touch_stroke_color = "#9F5FBF";//紫色
var touch_stroke_width = "1";
var switch_color = "#FF3420"//红
var vswitch_color = "#7FFF00";//绿
var vm_color = "#1E90FF";//蓝
//edges
var edges2 = svg.selectAll("line")
.data(edges)
.enter()
.append("line")
.style("stroke", "#ccc")
.style("stroke-width", 2)
.call(force2.drag);
//link
var link2 = svg.selectAll("link");
link2 = link2.data(edges);
var linkEnter2 = link2.enter()
.append("g")
.attr("class","link")
.call(force2.drag);
linkEnter2.append("text")
.attr("dy", ".35em")
.text(function(d){ return d.des; });
//node
var node2 = svg.selectAll("node");
node2 = node2.data(nodes);
var nodeEnter2 = node2.enter()
.append("g")
.attr("class", "node")
.call(force2.drag);
nodeEnter2.append("circle")
.attr("r", function(d)
{
if(d.type == "circle") return 10;
else return 0;
})
.style("fill", function(d, i)
{
if(d.type == "circle")
{
if(d.switch_type == "1") return switch_color; else if(d.switch_type == "2") return vswitch_color;}
else if(d.type == "rect"){return vm_color;}
})
.on("mouseover", function(x,i) //鼠标移动到一个节点上时,将其及与其邻接的节点突出显示
{
node2.style("stroke",function(d) { if(d.index == x.index)return touch_stroke_color; })
.style("stroke-width", function(d) { if(d.index == x.index)return touch_stroke_width; }); link2.style("stroke", function(d) { if(d.source.index == x.index || d.target.index == x.index) return touch_stroke_color; })
.style("stroke-width", function(d) { if(d.source.index == x.index || d.target.index == x.index) return touch_stroke_width; }); svg.selectAll("text")
.style("fill",function(d) { if(d.index == x.index) return touch_stroke_color; })
.style("fill",function(d) { if(d.source.index == x.index || d.target.index == x.index) return touch_stroke_color; });
})
.on("mouseout", function() //鼠标离开时还原
{
node2.style("stroke-width","0");
node2.style("stroke", stroke_color);
link2.style("stroke", stroke_color);
link2.style("stroke-width","0");
svg.selectAll("text").style("fill","black");
}); nodeEnter2.append("rect")
.attr("width",function(d)
{
if(d.type == "rect") return 20;
else return 0;
})
.attr("height",function(d)
{
if(d.type == "rect") return 20;
else return 0;
})
.style("fill", function(d, i)
{
if(d.type == "circle")
{
if(d.switch_type == "1") return switch_color;
else if(d.switch_type == "2") return vswitch_color;
}
else if(d.type == "rect")
{
return vm_color;
}
})
.on("mouseover", function(x,i) //鼠标移动到一个节点上时,将其及与其邻接的节点突出显示
{
node2.style("stroke",function(d) { if(d.index == x.index)return touch_stroke_color; })
.style("stroke-width", function(d) { if(d.index == x.index)return touch_stroke_width; }); link2.style("stroke", function(d) { if(d.source.index == x.index || d.target.index == x.index) return touch_stroke_color; })
.style("stroke-width", function(d) { if(d.source.index == x.index || d.target.index == x.index) return touch_stroke_width; }); svg.selectAll("text")
.style("fill",function(d) { if(d.index == x.index) return touch_stroke_color; })
.style("fill",function(d) { if(d.source.index == x.index || d.target.index == x.index) return touch_stroke_color; });
})
.on("mouseout", function() //鼠标离开时还原
{
node2.style("stroke-width","0");
node2.style("stroke", stroke_color);
link2.style("stroke", stroke_color);
link2.style("stroke-width","0");
svg.selectAll("text").style("fill","black");
});
nodeEnter2.append("text")
.attr("dy", ".35em")
.text(function(d) { return d.name; })
.on("mouseover", function(x,i) //鼠标移动到一个节点上时,将其及与其邻接的节点突出显示
{
node2.style("stroke",function(d) { if(d.index == x.index)return touch_stroke_color; })
.style("stroke-width", function(d) { if(d.index == x.index)return touch_stroke_width; }); link2.style("stroke", function(d) { if(d.source.index == x.index || d.target.index == x.index) return touch_stroke_color; })
.style("stroke-width", function(d) { if(d.source.index == x.index || d.target.index == x.index) return touch_stroke_width; }); svg.selectAll("text")
.style("fill",function(d) { if(d.index == x.index) return touch_stroke_color; })
.style("fill",function(d) { if(d.source.index == x.index || d.target.index == x.index) return touch_stroke_color; });
})
.on("mouseout", function() //鼠标离开时还原
{
node2.style("stroke-width","0");
node2.style("stroke", stroke_color);
link2.style("stroke", stroke_color);
link2.style("stroke-width","0");
svg.selectAll("text").style("fill","black");
}); force2.on("tick", function()
{
edges2.attr("x1", function(d) { return d.source.x; })
.attr("y1", function(d) { return d.source.y; })
.attr("x2", function(d) { return d.target.x; })
.attr("y2", function(d) { return d.target.y; });
link2.attr("transform", function(d) { return "translate(" + (d.source.x+d.target.x)/2 + "," + (d.source.y+d.target.y)/2 + ")"; });
node2.attr("transform", function(d)
{
if(d.type == "circle") return "translate(" + d.x + "," + d.y + ")";
else
{
var dx = parseFloat(d.x) - 10;
var dy = parseFloat(d.y) - 10;
return "translate(" + dx + "," + dy + ")";
}
});
});
</script>
</body>
最后移动鼠标就会高亮选择的地方
d3js网络拓扑关系特效可视化展现的更多相关文章
- bvlc_reference_caffenet网络权值可视化
一.网络结构 models/bvlc_reference_caffenet/deploy.prototxt 二.显示conv1的网络权值 clear; clc; close all; addpath( ...
- D3js初探及数据可视化案例设计实战
摘要:本文以本人目前所做项目为基础,从设计的角度探讨数据可视化的设计的方法.过程和结果,起抛砖引玉之效.在技术方案上,我们采用通用web架构和d3js作为主要技术手段:考虑到项目需求,这里所做的可视化 ...
- caffe深度学习网络(.prototxt)在线可视化工具:Netscope Editor
http://ethereon.github.io/netscope/#/editor 网址:http://ethereon.github.io/netscope/#/editor 将.prototx ...
- prometheus(3)之grafan可视化展现
可视化UI界面Grafana的安装和配置 Grafana介绍 Grafana是一个跨平台的开源的度量分析和可视化工具,可以将采集的数据可视化的展示,并及时通知给告警接收方.它主要有以下六大特点: 1. ...
- mnist全连接层网络权值可视化
一.数据准备 网络结构:lenet_lr.prototxt 训练好的模型:lenet_lr_iter_10000.caffemodel 下载地址:链接:https://pan.baidu.com/s/ ...
- 搭建一个简单的基于web的网络流量监控可视化系统
本文转载于我的个人博客,转载请标明出处. 初衷 在腾讯云的学生认证申请提交上去n天之后,终于得到了审批,所以迫不及待的想玩玩腾讯云,作为一个搞网络的,自然有一些关于网络应用的小玩意,所以把以前部署过的 ...
- Tensorflow学习教程------tensorboard网络运行和可视化
tensorboard可以将训练过程中的一些参数可视化,比如我们最关注的loss值和accuracy值,简单来说就是把这些值的变化记录在日志里,然后将日志里的这些数据可视化. 首先运行训练代码 #co ...
- VMware vRealize Network Insight 6.2 发布 - 网络和安全可视化分析
发现.优化应用安全性和网络连接解决方案并对其进行故障排除 VMware vRealize Network Insight 可帮助您跨混合和多云环境构建经过优化且高度可用的安全网络基础架构.它提供了网络 ...
- python读取excel数据,并可视化展现
#-*- coding: utf-8 -*- import pandas as pda import matplotlib.pyplot as pyl import matplotlib.font_m ...
随机推荐
- ASP.NET中UrlEncode应该用Uri.EscapeDataString()
今天,茄子_2008反馈他博客中的“C++”标签失效.检查了一下代码,生成链接时用的是HttpUtility.UrlEncode(url),从链接地址获取标签时用的是HttpUtility.UrlDe ...
- Java Jersey2使用总结
原文 http://blog.segmentfault.com/lenbo_ma/1190000000495321 主题 Java 前言 在短信平台一期工作中,为便于移动平台的开发,使用了Java ...
- 工作总结 MVC 验证 [Required] 必填 与 string 小知识
例如 添加页面有个 title 字段 设置了 [Required] 不填的时候 设置 还是验证不通过 设置为 还是不通过 说明了 验证只与页面上传不传值有关 与在后台设不设置值 无关. ...
- Linux内核scatterlist API介绍
1. 前言 我们在那些需要和用户空间交互大量数据的子系统(例如MMC[1].Video.Audio等)中,经常看到scatterlist的影子.对我们这些“非英语母语”的人来说,初见这个词汇,脑袋瞬间 ...
- js完美的div拖拽实例代码
方案一: <!DOCTYPE html PUBLIC "-//W3C//DTD XHTML 1.0 Transitional//EN" "http://www.w3 ...
- Matlab图形调色
Matlab图形调色 Simple example var colormap = require('colormap') options = { colormap: 'jet', // pic ...
- Spring中xml文件配置也可以配置容器list、set、map
<?xml version="1.0" encoding="UTF-8"?> <beans xmlns="http://www.sp ...
- Java学习笔记----main
1.java中main方法是程序的入口方法.main还是必须的两个修饰符是public和static.举例 A:public static void main(String args[]) B:pub ...
- WIN2008中部署网站后样式及JS加载不了
今天在一台刚刚装好的WIN2008上部署一个问题,一切按流程来:① 控制面板加IIS,把.NET 3.5打勾② 装.NET 4.0框架③ 装MSSQL2012④ IIS中部署网站⑤ 修改web.con ...
- [docker]docker0网络模型探究
docker0网络模型step by step 将docker的ns软链到linux ns $ ln -s /var/run/docker/netns /var/run/netns 查看ns,无 $ ...