
D3——Axes
使用d3.svg.axis() 创建一个 axis function:
var xAxis = d3.svg.axis();
an axis function is called, it doesn’t return a value, but generates the visual elements of the axis, including lines, labels, and ticks.
xAxis.scale(xScale);
设置label相对axis的位置,默认为bottom, 对horizontal axes(横轴)来说可以设置的值为 top and bottom. For vertical axes(纵轴), use leftand right:
xAxis.orient("bottom");
链式写法:
var xAxis = d3.svg.axis()

                  .scale(xScale)

                  .orient("bottom");
将横轴添加到画布svg上(to actually generate the axis and insert all those little lines and labels into our SVG, we must call the xAxis function)
svg.append("g")

    .call(xAxis);
例子:
 <script type="text/javascript">

       //Width and height

       var w = ;

       var h = ;

       var padding = ;

       var dataset = [

            [, ], [, ], [, ], [, ], [, ],

                [, ], [, ], [, ], [, ], [, ],

                [, ]

     ];

     //Create scale functions

     var xScale = d3.scale.linear()

         .domain([, d3.max(dataset, function(d) {

                        return  d[]; })])

         .range([padding, w - padding * ]);

     var yScale = d3.scale.linear()

         .domain([, d3.max(dataset, function(d) {

                               return d[]; })])

          .range([h - padding, padding]);

     var rScale = d3.scale.linear()

         .domain([, d3.max(dataset, function(d) {

                               return  d[]; })])

          .range([, ]);

     //Define X axis

     var xAxis = d3.svg.axis()

         .scale(xScale)

         .orient("bottom");

     //Create SVG element

     var svg = d3.select("body")

         .append("svg")

         .attr("width", w)

         .attr("height", h);

     //Create circles

     svg.selectAll("circle")

         .data(dataset)

         .enter()

         .append("circle")

         .attr("cx", function(d) {

             return xScale(d[]);

         })

         .attr("cy", function(d) {

             return yScale(d[]);

         })

         .attr("r", function(d) {

             return rScale(d[]);

         });

     //Create labels

     svg.selectAll("text")

         .data(dataset)

         .enter()

         .append("text")

         .text(function(d) {

             return d[] + "," + d[];

         })

         .attr("x", function(d) {

                        return xScale(d[]);

         })

         .attr("y", function(d) {

                        return yScale(d[]);

         })

         .attr("font-family", "sans-serif")

         .attr("font-size", "11px")

         .attr("fill", "red");

     //Create X axis

     svg.append("g")

           .call(xAxis);

 </script>
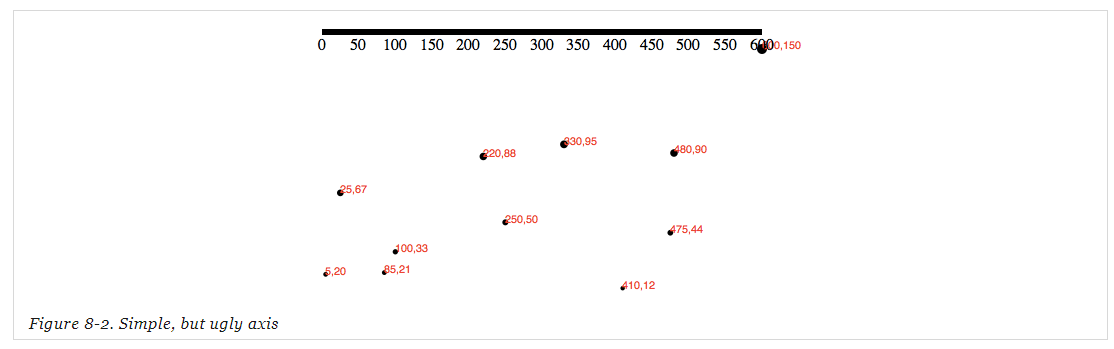
只创建了横纵轴的例子
 var w = ;

 var h = ;

 var padding = ;

 var dataset = [

         [, ], [, ], [, ], [, ], [, ],[, ], [, ], [, ], [, ], [, ],[, ]

 ];

 //create xScale,yScale

 var xScale = d3.scale.linear()

           .domain([, d3.max(dataset, function(d) { return d[]; })])

       .range([padding, w - padding * ]);

 var yScale = d3.scale.linear()

           .domain([, d3.max(dataset, function(d) { return d[]; })])

           .range([h - padding, padding]);

 //define X axis , Y axis

 var xAxis = d3.svg.axis().scale(xScale).orient("bottom");

 var yAxis = d3.svg.axis().scale(yScale).orient("right");

 //Create SVG element

 var svg = d3.select("body")

         .append("svg")

         .attr("width", w)

         .attr("height", h);

 //Create X axis , Y axis

 svg.append("g").call(xAxis);

 svg.append("g").call(yAxis);
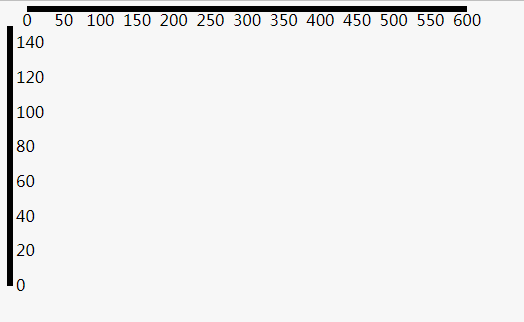
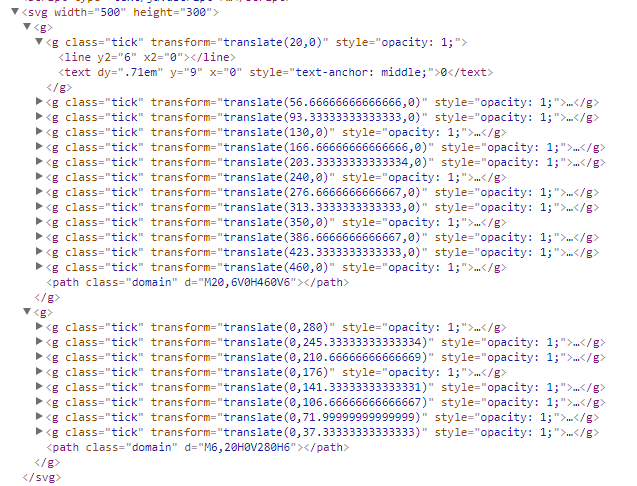
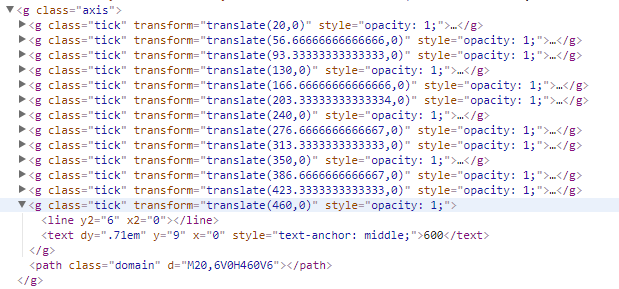
为axes设置样式
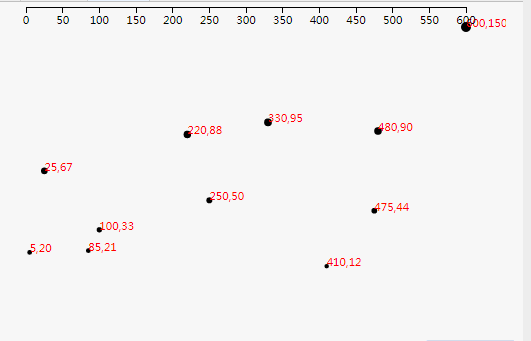
svg.append("g")

    .attr("class", "axis") //Assign "axis" class

    .call(xAxis);
// set css style

.axis path,

.axis line {

    fill: none;

    stroke: black;

    shape-rendering: crispEdges;

}

.axis text {

    font-family: sans-serif;

    font-size: 11px;

}
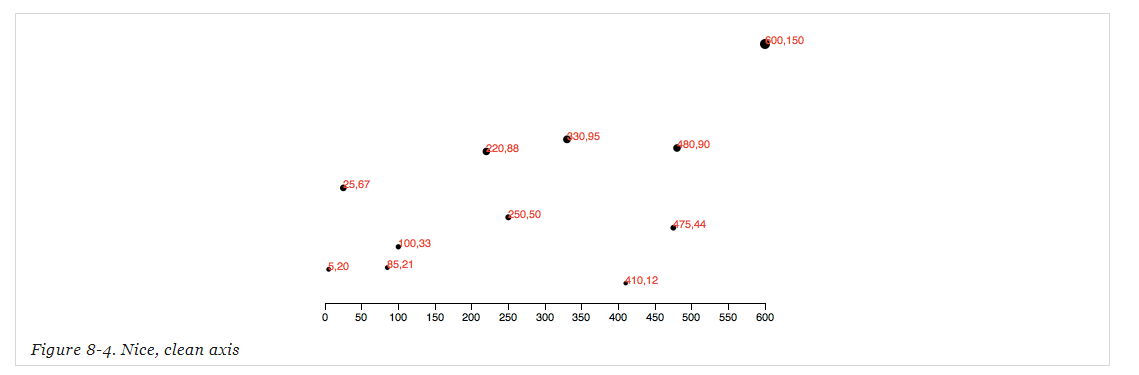
将X axis 向下平移
svg.append("g")

    .attr("class", "axis")

    .attr("transform", "translate(0," + (h - padding) + ")")

    .call(xAxis);
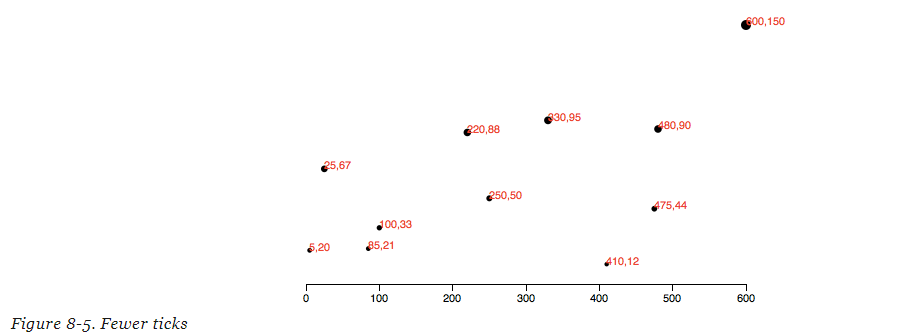
上面的例子中我们并没有指定坐标轴的ticks个数,如果没有特别指定,D3会根据我们的scale (eg: xScale)和其他信息自动为我们设置合适个数的ticks。
设置ticks个数:
var xAxis = d3.svg.axis()

                  .scale(xScale)

                  .orient("bottom")

                  .ticks();  //Set rough # of ticks
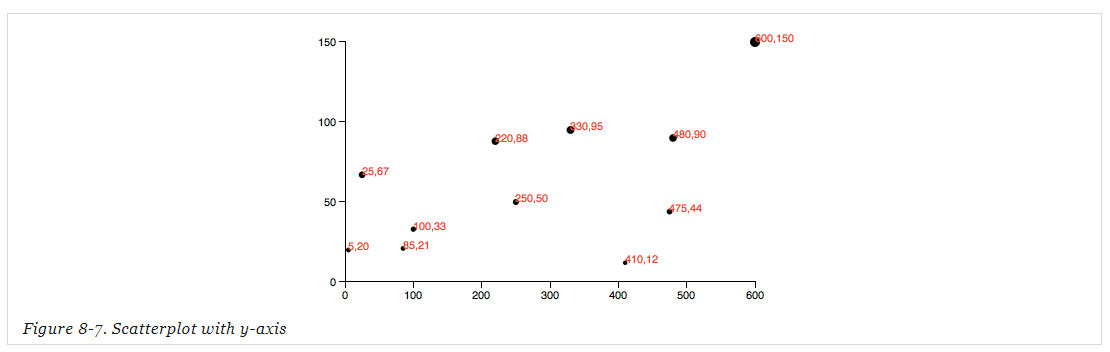
添加上Y axis:
//reset padding= 30;

var padding = ;

//Define Y axis

var yAxis = d3.svg.axis()

                  .scale(yScale)

                  .orient("left")

                  .ticks();

//Create Y axis

svg.append("g")

    .attr("class", "axis")

    .attr("transform", "translate(" + padding + ",0)")

    .call(yAxis);
Formatting Tick Labels
var formatAsPercentage = d3.format(".1%");

xAxis.tickFormat(formatAsPercentage);

formatAsPercentage(.);     //"36.5%"

formatAsPercentage(1.2);       //"120.0%"

formatAsPercentage(-.);       //"-50.0%"
D3——Axes的更多相关文章
- [D3] Create Chart Axes with D3 v4
Most charts aren’t complete without axes to provide context and labeling for the graphical elements ...
- [D3] 10. Creating Axes with D3
<!DOCTYPE html> <html> <head lang="en"> <meta charset="UTF-8&quo ...
- D3.js学习(七)
上一节中我们学会了如何旋转x轴标签以及自定义标签内容,在这一节中,我们将接触动画(transition) 首先,我们要在页面上添加一个按钮,当我们点击这个按钮时,调用我们的动画.所以,我们还需要在原来 ...
- D3 learning notes
D3 https://d3js.org/ 数据驱动文档显示, 利用 SVG HTML CSS技术. D3.js is a JavaScript library for manipulating doc ...
- D3、EChart、HighChart绘图demol
1.echarts: <!DOCTYPE html> <html> <head> <meta charset="utf-8" ...
- d3浅谈
d3是一个及其庞大的库,有20个模块,大小也达到了216kb,是JQ1.x的2倍多,JQ3.x的3倍多,JQ本来就挺笨重的一个库,d3更是如此,但是它的功能确实很强悍~ d3的定位是一个科学计算库,并 ...
- D3.js 入门学习(二) V4的改动
//d3.scan /* 新的d3.scan方法对数组进行线性扫描,并根据指定的比较函数返回至少一个元素的索引. 这个方法有点类似于d3.min和d3.max. 而d3.scan可以得到极值的索引而不 ...
- 软件项目技术点(1)——d3.interpolateZoom-在两个点之间平滑地缩放平移
AxeSlide软件项目梳理 canvas绘图系列知识点整理 软件参考d3的知识点 我们在软件中主要用到d3.js的核心函数d3.interpolateZoom - 在两个点之间平滑地缩放平移.请 ...
- 【D3 API 中文手冊】
[D3 API 中文手冊] 声明:本文仅供学习所用,未经作者同意严禁转载和演绎 <D3 API 中文手冊>是D3官方API文档的中文翻译. 始于2014-3-23日,基于VisualCre ...
随机推荐
- vmware8~12最新版本 克隆Centos6.X 系列虚拟机网卡无法启动问题 (三步即可)
1.因工作或者学习需要,都需要在VM上克隆一台服务器,此时无论是快捷克隆(相当于快照的机体)或者完整克隆,都会碰到IP问题. 如:创建后症状:启动之后使用ifconfig,发现无ip地址,只有回环地址 ...
- 【原】jQuery easyUI 快速搭建前端框架
jQueryEasyUI jQuery EasyUI是一组基于jQuery的UI插件集合体,而jQuery EasyUI的目标就是帮助web开发者更轻松的打造出功能丰富并且美观的UI界面.开发者不需要 ...
- 【转】Java面试题全集(上)
准备从C#转java,在找工作之前准备看看面试题,有幸看到大神的作品,mark一下,以后慢慢看... 2013年年底的时候,我看到了网上流传的一个叫做<Java面试题大全>的东西,认真的阅 ...
- unity assetStore 常用插件
常用插件 20180723============= 教程类 =============<Mecanim Example Scenes > 官方示例场景<Surivial Shoot ...
- 四、闭锁之CountDownLatch
一.简介 闭锁是Java的一种同步工具类.我们在程序运行过程中,某个任务需要等待其它一个到多个的任务全部完成才会执行,这个等待的期间就叫做闭锁. CountDownLatch是闭锁的一种实现,它支持一 ...
- SublimeText3 插件的使用和本身的配置
--------------------20180109----------------------- Part1:如何设置代码字体变大变小 1.点击菜单栏 Sublime Text 中prefere ...
- JAVA基础之——序列化和反序列化
1 概念 序列化,将java对象转换成字节序列的过程. 反序列化,将字节序列恢复成java对象的过程. 2 为什么要序列化? 2.1 实现数据持久化,当对象创建后,它就会一直在,但是在程序终止时,这个 ...
- oracle数据库的安装与连接关键点
一.window xp系统上安装Oracle Database 10G 解锁Scott.Hr账号并重置口令 远程连接数oracle数据库地址 二.在Mac系统上使用Navicat远程连接oracle数 ...
- 基于openlayers2军事标绘,开源
1.其实各GIS公司.网络上 都会有提供 军事标绘的功能,如arcgis 的,超图的.mapgis的:但大多数是非开源.且收费的.2.在这里要感谢超图,超图开源了标绘扩展符号库,我这里使用的就是超图的 ...
- MySQL数据库(13)----忘记root用户密码解决方案【转载】
1.首先确认服务器出于安全的状态,也就是没有人能够任意地连接MySQL数据库. 因为在重新设置MySQL的root密码的期间,MySQL数据库完全出于没有密码保护的 状态下,其他的用户也可以任意地登录 ...