istio收集Metrics和日志信息
1.切换到istio根目录
cd /data/istio/istio-0.7.1
2.安装prometheus
kubectl apply -f install/kubernetes/addons/prometheus.yaml

3.创建收集数据的模板
# Configuration for metric instances
apiVersion: "config.istio.io/v1alpha2"
kind: metric
metadata:
name: doublerequestcount
namespace: istio-system
spec:
value: "2" # count each request twice
dimensions:
source: source.service | "unknown"
destination: destination.service | "unknown"
message: '"twice the fun!"'
monitored_resource_type: '"UNSPECIFIED"'
---
# Configuration for a Prometheus handler
apiVersion: "config.istio.io/v1alpha2"
kind: prometheus
metadata:
name: doublehandler
namespace: istio-system
spec:
metrics:
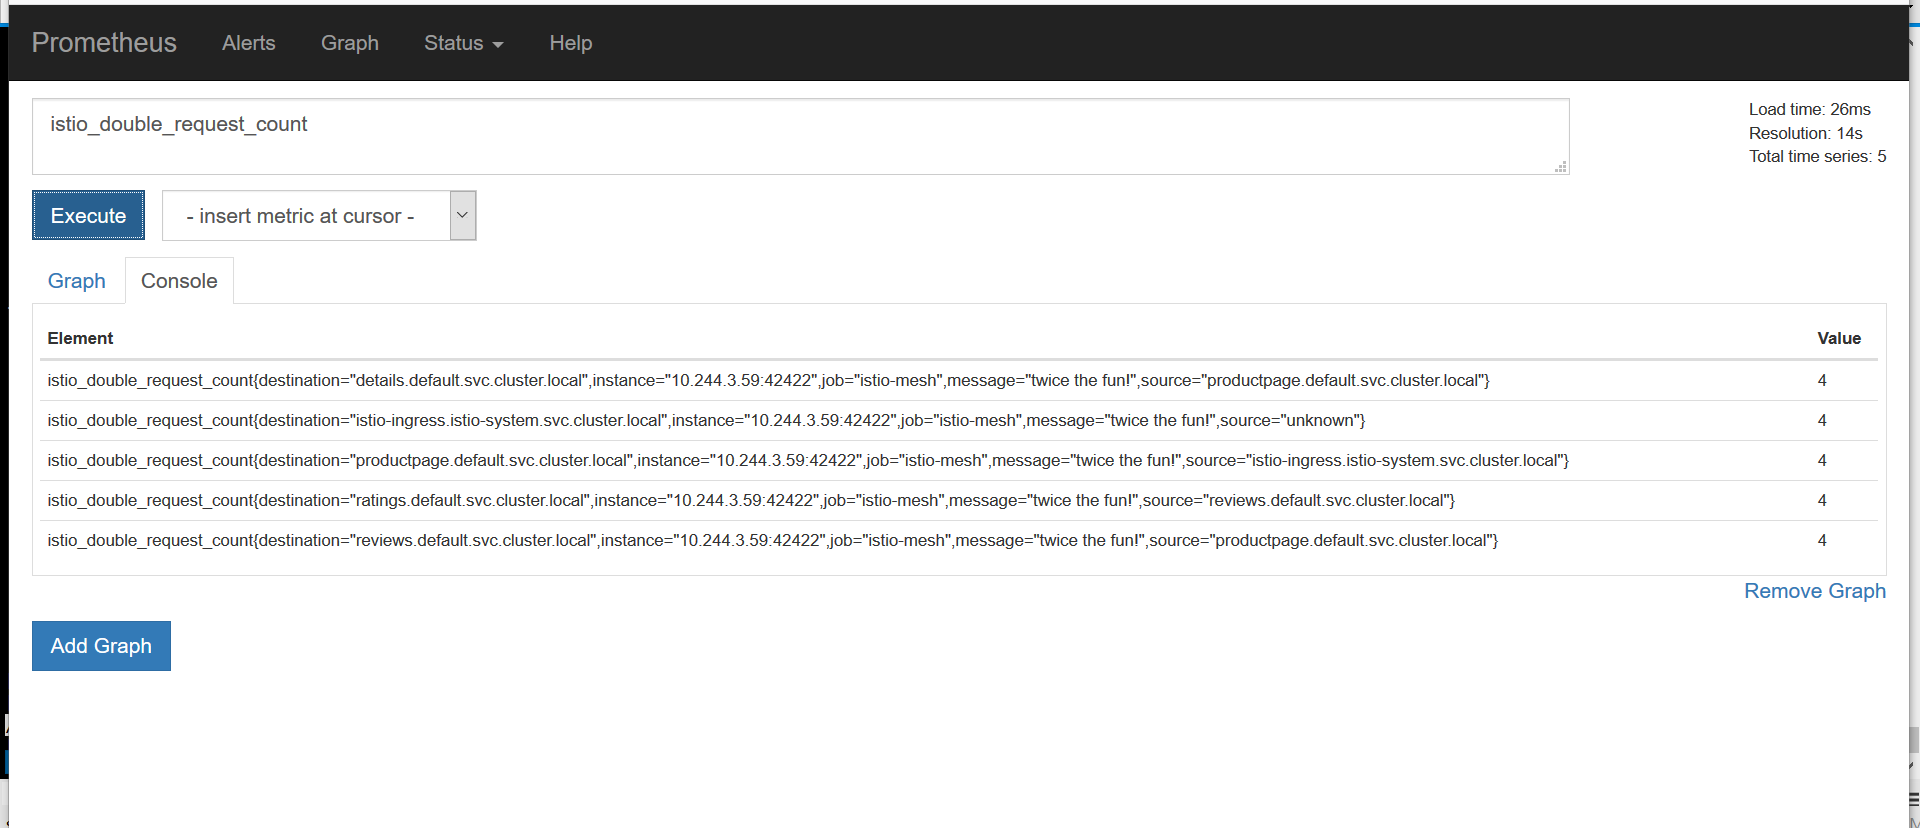
- name: double_request_count # Prometheus metric name
instance_name: doublerequestcount.metric.istio-system # Mixer instance name (fully-qualified)
kind: COUNTER
label_names:
- source
- destination
- message
---
# Rule to send metric instances to a Prometheus handler
apiVersion: "config.istio.io/v1alpha2"
kind: rule
metadata:
name: doubleprom
namespace: istio-system
spec:
actions:
- handler: doublehandler.prometheus
instances:
- doublerequestcount.metric
---
# Configuration for logentry instances
apiVersion: "config.istio.io/v1alpha2"
kind: logentry
metadata:
name: newlog
namespace: istio-system
spec:
severity: '"warning"'
timestamp: request.time
variables:
source: source.labels["app"] | source.service | "unknown"
user: source.user | "unknown"
destination: destination.labels["app"] | destination.service | "unknown"
responseCode: response.code | 0
responseSize: response.size | 0
latency: response.duration | "0ms"
monitored_resource_type: '"UNSPECIFIED"'
---
# Configuration for a stdio handler
apiVersion: "config.istio.io/v1alpha2"
kind: stdio
metadata:
name: newhandler
namespace: istio-system
spec:
severity_levels:
warning: 1 # Params.Level.WARNING
outputAsJson: true
---
# Rule to send logentry instances to a stdio handler
apiVersion: "config.istio.io/v1alpha2"
kind: rule
metadata:
name: newlogstdio
namespace: istio-system
spec:
match: "true" # match for all requests
actions:
- handler: newhandler.stdio
instances:
- newlog.logentry
---
# Configuration for a metric measuring bytes sent from a server
# to a client
apiVersion: "config.istio.io/v1alpha2"
kind: metric
metadata:
name: mongosentbytes
namespace: default
spec:
value: connection.sent.bytes | 0 # uses a TCP-specific attribute
dimensions:
source_service: source.service | "unknown"
source_version: source.labels["version"] | "unknown"
destination_version: destination.labels["version"] | "unknown"
monitoredResourceType: '"UNSPECIFIED"'
---
# Configuration for a metric measuring bytes sent from a client
# to a server
apiVersion: "config.istio.io/v1alpha2"
kind: metric
metadata:
name: mongoreceivedbytes
namespace: default
spec:
value: connection.received.bytes | 0 # uses a TCP-specific attribute
dimensions:
source_service: source.service | "unknown"
source_version: source.labels["version"] | "unknown"
destination_version: destination.labels["version"] | "unknown"
monitoredResourceType: '"UNSPECIFIED"'
---
# Configuration for a Prometheus handler
apiVersion: "config.istio.io/v1alpha2"
kind: prometheus
metadata:
name: mongohandler
namespace: default
spec:
metrics:
- name: mongo_sent_bytes # Prometheus metric name
instance_name: mongosentbytes.metric.default # Mixer instance name (fully-qualified)
kind: COUNTER
label_names:
- source_service
- source_version
- destination_version
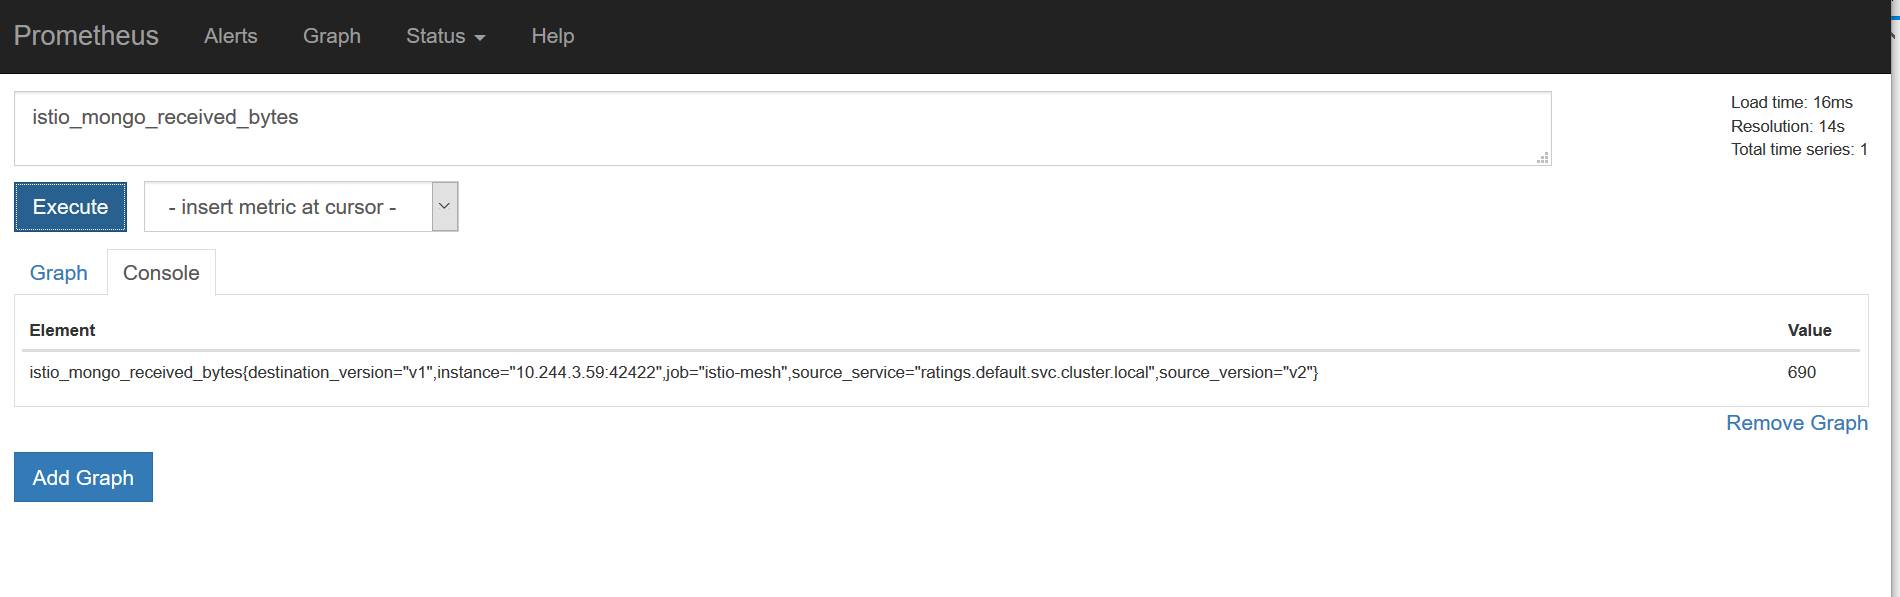
- name: mongo_received_bytes # Prometheus metric name
instance_name: mongoreceivedbytes.metric.default # Mixer instance name (fully-qualified)
kind: COUNTER
label_names:
- source_service
- source_version
- destination_version
---
# Rule to send metric instances to a Prometheus handler
apiVersion: "config.istio.io/v1alpha2"
kind: rule
metadata:
name: mongoprom
namespace: default
spec:
match: context.protocol == "tcp"
&& destination.service == "mongodb.default.svc.cluster.local"
actions:
- handler: mongohandler.prometheus
instances:
- mongoreceivedbytes.metric
- mongosentbytes.metric
执行命令:
istioctl create -f new_telemetry.yamlistioctl create -f tcp_telemetry.yaml为了测试支持收集tcp metric数据:
kubectl apply -f <(istioctl kube-inject -f samples/bookinfo/kube/bookinfo-ratings-v2.yaml)
kubectl apply -f <(istioctl kube-inject -f samples/bookinfo/kube/bookinfo-db.yaml)
istioctl create -f samples/bookinfo/kube/route-rule-ratings-db.yaml
4.测试
1)访问bookinfo事例
http://192.168.181.99:32693/productpage
2)查看prometheus ui
istio收集Metrics和日志信息的更多相关文章
- 【MySQL】关于MySQL错误日志信息的收集
为方便维护MySQL,写了个脚本用以提供收集错误信息的接口.这些错误信息来自与MySQL错误日志,而 通过grep mysql可以获取error-log的路径. #!/usr/bin/env pyth ...
- idou老师教你学Istio :如何用istio实现监控和日志采集
大家都知道istio可以帮助我们实现灰度发布.流量监控.流量治理等功能.每一个功能都帮助我们在不同场景中实现不同的业务.那Istio是如何帮助我们实现监控和日志采集的呢? 这里我们依然以Bookinf ...
- idou老师教你学Istio 25:如何用istio实现监控和日志采集
大家都知道istio可以帮助我们实现灰度发布.流量监控.流量治理等功能.每一个功能都帮助我们在不同场景中实现不同的业务.那Istio是如何帮助我们实现监控和日志采集的呢? 这里我们依然以Bookinf ...
- ASP.NET Core 实战:使用 NLog 将日志信息记录到 MongoDB
一.前言 在项目开发中,日志系统是系统的一个重要组成模块,通过在程序中记录运行日志.错误日志,可以让我们对于系统的运行情况做到很好的掌控.同时,收集日志不仅仅可以用于诊断排查错误,由于日志同样也是大量 ...
- 带你了解zabbix整合ELK收集系统异常日志触发告警~
今天来了解一下关于ELK的“L”-Logstash,没错,就是这个神奇小组件,我们都知道,它是ELK不可缺少的组件,完成了输入(input),过滤(fileter),output(输出)工作量,也是我 ...
- ELK收集Nginx自定义日志格式输出
1.ELK收集日志的有两种常用的方式: 1.1:不修改源日志格式,简单的说就是在logstash中转通过 grok方式进行过滤处理,将原始无规则的日志转换为规则日志(Logstash自定义日志格式) ...
- Flume 概述+环境配置+监听Hive日志信息并写入到hdfs
Flume介绍Flume是Apache基金会组织的一个提供的高可用的,高可靠的,分布式的海量日志采集.聚合和传输的系统,Flume支持在日志系统中定制各类数据发送方,用于收集数据:同时,Flume提供 ...
- svn log — 显示提交日志信息
http://www.cnblogs.com/eoiioe/archive/2009/01/06/1370580.html 概要svn log [PATH]svn log URL [PATH...]描 ...
- Android将日志信息自动发送到指定的邮箱中 邮件的内容以附件形式发送
今日整合了网上一些大神的例子(具体看了那些大神的?这个真不好意思我忘记了.下次再整合一定给大家补上,这次也只有默默的给那几个大神说声抱歉了.)做了一个“记录android项目中的日志信息,并将日志信息 ...
随机推荐
- hadoop集群崩溃,因为tmp下/tmp/hadoop-hadoop/dfs/name文件误删除
hadoop执行start-all后,显示正常启动. starting namenode, logging to /opt/hadoop-0.20.2-cdh3u0/logs/hadoop-hadoo ...
- Redis简介 Linux安装Redis Redis使用
其他一些操作(包括 APPEND.GETRANGE.MSET 和 STRLENGTH 也可用于字符串.请参见http://doc.redisfans.com/string/index.html ) 使 ...
- [WinForm]dataGridView自定动态设定序号列框
你可以在数据绑定或者行数有很大变化时测量一下DataGridView最大行数的行数的宽度然后在绘制代码如下 SolidBrush solidBrush; StringFormat stringForm ...
- MinerDB.java 数据库工具类
MinerDB.java 数据库工具类 package com.iteye.injavawetrust.miner; import java.sql.Connection; import java.s ...
- C++对象模型(四):class成员初始化列表(Member Initialization List)
本文是Inside C++ Object Model Chapter 2 部分的读书笔记. 编译器如何处理初始化成员列表的. 下列情况中,必须要使用member initialization list ...
- Linux环境编程导引
计算机系统硬件组成 总线 贯穿整个系统的一组电子管道称为总线, 分为: 片内总线 系统总线 数据总线DB 地址总线AB 控制总线CB 外部总线 I/O设备 I/O设备是系统与外界联系的通道 键盘鼠标是 ...
- Spring BeanFacoty doCreateBean方法分析
上一篇,我们分析到了doCreateBean,现在继续: 先看看时序图 protected Object doCreateBean(final String beanName, final RootB ...
- (十)弹出框Alert与ActionSheet
第一种方式:中间弹窗 从中间弹出的窗口称为AlertView. 可以设置多个按钮,取消按钮会放在对右端或者最下端,按钮超过两个,会竖着排列. UIAlertView *alert = [[[UIAle ...
- 【翻译】使用Sencha Touch开发Google Glass应用程序
原文:Developing for Google Glass with Sencha Touch 作者:Ross Gerbasi Ross Gerbasi is a Senior Engineer a ...
- AngularJS进阶(十七)在AngularJS应用中实现微信认证授权遇到的坑
在AngularJS应用中集成微信认证授权遇到的坑 注:请点击此处进行充电! 前言 项目开发过程中,移动端新近增加了一个功能"微信授权登录",由于自己不是负责移动端开发的,但最后他 ...