
Qt开发技术:QCharts(四)QChart面积图介绍、Demo以及代码详解
若该文为原创文章,未经允许不得转载
原博主博客地址:https://blog.csdn.net/qq21497936
原博主博客导航:https://blog.csdn.net/qq21497936/article/details/102478062
本文章博客地址:https://blog.csdn.net/qq21497936/article/details/108240696
各位读者,知识无穷而人力有穷,要么改需求,要么找专业人士,要么自己研究
红胖子(红模仿)的博文大全:开发技术集合(包含Qt实用技术、树莓派、三维、OpenCV、OpenGL、ffmpeg、OSG、单片机、软硬结合等等)持续更新中…(点击传送门)
上一篇:《Qt开发技术:QCharts(三)QCharts样条曲线图介绍、Demo以及代码详解》
下一篇: 敬请期待…
前言
红胖子,来也!
按照顺序,本章为面积图。
补充
QCharts所有的图表都依赖《Qt开发技术:QCharts(一)QCharts基本介绍以及图表框架详解》中的QChart、QChartView、QLegend、QValueAxis。
Demo


Demo下载地址
当前为v1.1.0版本
CSDN:https://download.csdn.net/download/qq21497936/12753524
QQ群:1047134658(点击“文件”搜索“qChartsTools”,群内与博文同步更新)
面积图
概述
面积图是使用QAreaSeries类或AreaSeries QML类型实现的。默认情况下,X轴被用作一个边界和QLineSeries或线列作为另一个。但是,可以使用QLineSeries或LineSeries作为两个边界。
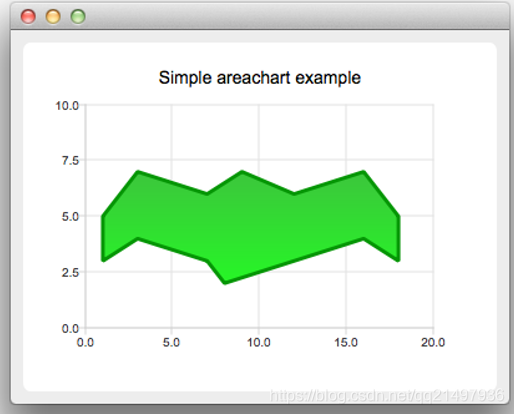
QAreaSeries(面积图类)
概述
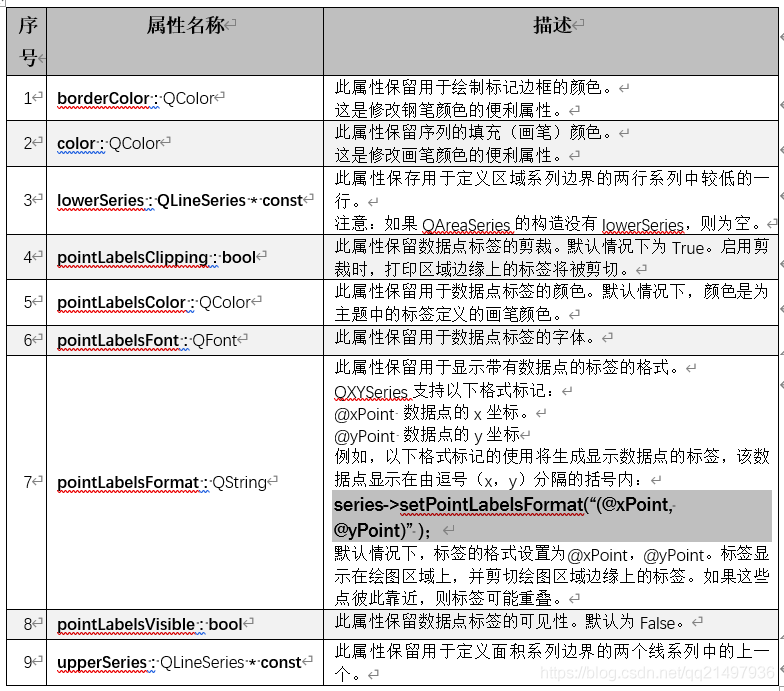
QAreaSeries类在面积图中显示数据。
面积序列用于显示定量数据。它是基于一系列线,用颜色强调边界线之间的区域。由于区域序列基于行序列,QAreaSeries构造函数需要一个QLineSeries实例,该实例定义区域的上边界。默认情况下,使用绘图区域底部作为下边界绘制面积图。下边界可以由另一条线指定,而不是绘图区域的底部。在这种情况下,QAReaSeries应该用两个QLineSeries实例初始化。
注意:当下边界值大于上边界值时,术语上下边界可能会产生误导。重点是这两条边界线之间的区域将被填充。
下面的代码片段说明了如何创建基本面积图:
_pLineSeries = new QLineSeries;

_pLineSeries2 = new QLineSeries;

_pLineSeries3 = new QLineSeries;

_pLineSeries4 = new QLineSeries;

// 方式一:逐一添加,大批量数据较慢

_pLineSeries->append(0, qrand()%11);

_pLineSeries->append(1, qrand()%11);

_pLineSeries->append(2, qrand()%11);

_pLineSeries->append(3, qrand()%11);

_pLineSeries->append(4, qrand()%11);

_pLineSeries->append(5, qrand()%11);

_pLineSeries->append(6, qrand()%11);

_pLineSeries->append(7, qrand()%11);

_pLineSeries->append(8, qrand()%11);

_pLineSeries->append(9, qrand()%11);

_pLineSeries->append(10, qrand()%11);

_pLineSeries->setName("通道1");

_pLineSeries->setPen(QPen(QColor(qrand()%256, qrand()%256, qrand()%256), 2));

// 通用:将数据插入到图表中

_pAreaSeries = new QAreaSeries();

_pAreaSeries->setName("面积1");

_pLineSeries->setPointsVisible(true);

_pLineSeries->setPointLabelsFormat("(@xPoint,@yPoint)");

_pAreaSeries->setUpperSeries(_pLineSeries);

_pChart->addSeries(_pAreaSeries);
效率更高的方式为:
// 方式二:逐一添加,大批量数据插入

QList<QLineSeries *> list;

list.append(_pLineSeries);

list.append(_pLineSeries2);

list.append(_pLineSeries3);

list.append(_pLineSeries4);

for(int index = 0; index < 4; index++)

{

    QList<QPointF> listPointF;

    for(int index = 0; index < 11; index++)

    {

        listPointF << QPointF(index, qrand()%11);

    }

    list.at(index)->append(listPointF);

    list.at(index)->setName(QString("通道%1").arg(index+1));

    list.at(index)->setPen(QPen(QColor(qrand()%256, qrand()%256, qrand()%256), 2));

}

// 通用:将数据插入到图表中

_pAreaSeries = new QAreaSeries();

_pAreaSeries->setName("面积1");

_pLineSeries->setPointsVisible(true);

_pLineSeries->setPointLabelsFormat("(@xPoint,@yPoint)");

_pAreaSeries->setUpperSeries(_pLineSeries);

_pChart->addSeries(_pAreaSeries);

_pAreaSeries2 = new QAreaSeries();

_pAreaSeries2->setName("面积2");

_pAreaSeries2->setUpperSeries(_pLineSeries2);

_pChart->addSeries(_pAreaSeries2);

_pAreaSeries3 = new QAreaSeries();

_pAreaSeries3->setName("面积3");

_pAreaSeries3->setUpperSeries(_pLineSeries3);

_pAreaSeries3->setLowerSeries(_pLineSeries2);

_pChart->addSeries(_pAreaSeries3);

_pAreaSeries4 = new QAreaSeries();

_pAreaSeries4->setName("面积4");

_pAreaSeries4->setUpperSeries(_pLineSeries4);

_pAreaSeries4->setLowerSeries(_pLineSeries3);

_pChart->addSeries(_pAreaSeries4);
Demo核心代码解析
建立QChart显示框架
AreaChartWidget::AreaChartWidget(QWidget *parent) :

    QWidget(parent),

    _pChartView(0),

    _pChart(0),

    _pXValueAxis(0),

    _pYValueAxis(0),

    _pLegend(0),

    _pLineSeries(0),

    _pLineSeries2(0),

    _pLineSeries3(0),

    _pLineSeries4(0),

    _pAreaSeries(0),

    _pAreaSeries2(0),

    _pAreaSeries3(0),

    _pAreaSeries4(0)

{

    _pChartView = new QChartView(this);

    _pChart = new QChart();

    initData();

}
初始化数据
void AreaChartWidget::initData()

{

    _pLineSeries = new QLineSeries;

    _pLineSeries2 = new QLineSeries;

    _pLineSeries3 = new QLineSeries;

    _pLineSeries4 = new QLineSeries;

    // 方式一:逐一添加,大批量数据较慢

    _pLineSeries->append(0, qrand()%11);

    _pLineSeries->append(1, qrand()%11);

    _pLineSeries->append(2, qrand()%11);

    _pLineSeries->append(3, qrand()%11);

    _pLineSeries->append(4, qrand()%11);

    _pLineSeries->append(5, qrand()%11);

    _pLineSeries->append(6, qrand()%11);

    _pLineSeries->append(7, qrand()%11);

    _pLineSeries->append(8, qrand()%11);

    _pLineSeries->append(9, qrand()%11);

    _pLineSeries->append(10, qrand()%11);

    _pLineSeries->setName("通道1");

    _pLineSeries->setPen(QPen(QColor(qrand()%256, qrand()%256, qrand()%256), 2));

    // 通用:将数据插入到图表中

    _pAreaSeries = new QAreaSeries();

    _pAreaSeries->setName("面积1");

    _pLineSeries->setPointsVisible(true);

    _pLineSeries->setPointLabelsFormat("(@xPoint,@yPoint)");

    _pAreaSeries->setUpperSeries(_pLineSeries);

    _pChart->addSeries(_pAreaSeries);

    // 方式二:逐一添加,大批量数据插入

    QList<QLineSeries *> list;

    list.append(_pLineSeries);

    list.append(_pLineSeries2);

    list.append(_pLineSeries3);

    list.append(_pLineSeries4);

    for(int index = 1; index < 4; index++)

    {

        QList<QPointF> listPointF;

        for(int index = 0; index < 11; index++)

        {

            listPointF << QPointF(index, qrand()%11);

        }

        list.at(index)->append(listPointF);

        list.at(index)->setName(QString("通道%1").arg(index+1));

        list.at(index)->setPen(QPen(QColor(qrand()%256, qrand()%256, qrand()%256), 2));

    }

    // 通用:将数据插入到图表中

    _pAreaSeries2 = new QAreaSeries();

    _pAreaSeries2->setName("面积2");

    _pAreaSeries2->setUpperSeries(_pLineSeries2);

    _pChart->addSeries(_pAreaSeries2);

    _pAreaSeries3 = new QAreaSeries();

    _pAreaSeries3->setName("面积3");

    _pAreaSeries3->setUpperSeries(_pLineSeries3);

    _pAreaSeries3->setLowerSeries(_pLineSeries2);

    _pChart->addSeries(_pAreaSeries3);

    _pAreaSeries4 = new QAreaSeries();

    _pAreaSeries4->setName("面积4");

    _pAreaSeries4->setUpperSeries(_pLineSeries4);

    _pAreaSeries4->setLowerSeries(_pLineSeries3);

    _pChart->addSeries(_pAreaSeries4);

    // 通用:X轴和Y轴的处理(先插入数据再处理轴,否则不会有轴)

    _pChart->createDefaultAxes();

    _pYValueAxis = dynamic_cast<QValueAxis *>(_pChart->axisY());

//    _pYValueAxis = new QValueAxis(_pChart);

    _pYValueAxis->setRange(0, 10);

    _pYValueAxis->setLinePen(QPen(Qt::black, 1));

    // tick

    _pYValueAxis->setTickCount(5);

    _pYValueAxis->setGridLinePen(QPen(Qt::gray, 1));

    _pYValueAxis->setGridLineVisible(true);

    // subTick

    _pYValueAxis->setMinorTickCount(4);

    _pYValueAxis->setMinorGridLineVisible(true);

    _pYValueAxis->setLabelFormat("%d");

//    _pChart->addAxis(_pYValueAxis, Qt::AlignLeft);

    _pXValueAxis = dynamic_cast<QValueAxis *>(_pChart->axisX());

//    _pXValueAxis = new QValueAxis(_pChart);

    _pXValueAxis->setRange(0, 10);

    _pXValueAxis->setLinePen(QPen(Qt::black, 1));

    // tick

    _pXValueAxis->setTickCount(5);

    _pXValueAxis->setGridLinePen(QPen(Qt::gray, 1));

    _pXValueAxis->setGridLineVisible(true);

    // subTick

    _pXValueAxis->setMinorTickCount(4); // 相反

    _pXValueAxis->setMinorGridLineVisible(true);

    _pXValueAxis->setLabelFormat("%d s");

//    _pChart->addAxis(_pXValueAxis, Qt::AlignBottom);

    // 通用:视图显示设置为图表

    _pChartView->setRubberBand(QChartView::NoRubberBand);   // 不缩放

    _pChartView->setDragMode(QChartView::NoDrag);   // 拽拖:需要自己重写QCharView

    _pChartView->setChart(_pChart);

    // 标识

    _pLegend = _pChart->legend();

    _pLegend->setAlignment(Qt::AlignRight);

    // 平滑

    _pChartView->setRenderHint(QPainter::Antialiasing, true);

    // 阴影

    _pChart->setDropShadowEnabled(true);

}
设置数据线是否显示(标签显示会同步)
void AreaChartWidget::setDataVisible(int index, bool visible)

{

    if(index < 0 || index > 3)

    {

        return;

    }

    QList<QAreaSeries *> list;

    list.append(_pAreaSeries);

    list.append(_pAreaSeries2);

    list.append(_pAreaSeries3);

    list.append(_pAreaSeries4);

    list.at(index)->setVisible(visible);

}
设置主题样式
void AreaChartWidget::setTheme(QChart::ChartTheme theme)

{

    _pChart->setTheme(theme);

}
设置动画模式
void AreaChartWidget::setAnimationOptions(QChart::AnimationOption option)

{

    _pChart->setAnimationOptions(option);

}
设置标签显示位置
void AreaChartWidget::setAlignment(Qt::Alignment align)

{

    _pLegend->setAlignment(align);

}
设置标签是否可见
void AreaChartWidget::setLegendVisible(bool visible)

{

    _pLegend->setVisible(visible);

    _pChartView->setRenderHint(QPainter::Antialiasing);

}
设置是否绘制平滑
void AreaChartWidget::setAntialiasing(bool antialiasing)

{

    _pChartView->setRenderHint(QPainter::Antialiasing, antialiasing);

}
设置是否有阴影
void AreaChartWidget::setShadow(bool shadow)

{

    _pChart->setDropShadowEnabled(shadow);

}
是否显示数据点(新增)
void AreaChartWidget::setPointVisible(bool visible)

{

    _pAreaSeries->setPointsVisible(visible);

    _pAreaSeries2->setPointsVisible(visible);

    _pAreaSeries3->setPointsVisible(visible);

    _pAreaSeries4->setPointsVisible(visible);

}
是否显示数据点坐标(新增)
void AreaChartWidget::setPointLabelVisible(bool visible)

{

    _pAreaSeries->setPointLabelsFormat("(@xPoint,@yPoint)");

    _pAreaSeries->setPointLabelsVisible(visible);

    _pAreaSeries2->setPointLabelsFormat("(@xPoint,@yPoint)");

    _pAreaSeries2->setPointLabelsVisible(visible);

    _pAreaSeries3->setPointLabelsFormat("(@xPoint,@yPoint)");

    _pAreaSeries3->setPointLabelsVisible(visible);

    _pAreaSeries4->setPointLabelsFormat("(@xPoint,@yPoint)");

    _pAreaSeries4->setPointLabelsVisible(visible);

}
重置随机数据
void AreaChartWidget::resetData()

{

    _pChart->removeAllSeries();

    _pLineSeries = new QLineSeries;

    _pLineSeries2 = new QLineSeries;

    _pLineSeries3 = new QLineSeries;

    _pLineSeries4 = new QLineSeries;

    QList<QLineSeries *> list;

    list.append(_pLineSeries);

    list.append(_pLineSeries2);

    list.append(_pLineSeries3);

    list.append(_pLineSeries4);

    for(int index = 0; index < 4; index++)

    {

        QList<QPointF> listPointF;

        for(int index = 0; index < 11; index++)

        {

            listPointF << QPointF(index, qrand()%11);

        }

        list.at(index)->append(listPointF);

        list.at(index)->setName(QString("通道%1").arg(index+1));

        list.at(index)->setPen(QPen(QColor(qrand()%256, qrand()%256, qrand()%256), 2));

    }

    _pAreaSeries = new QAreaSeries();

    _pAreaSeries->setName("面积1");

    _pAreaSeries->setUpperSeries(_pLineSeries);

    _pAreaSeries2 = new QAreaSeries();

    _pAreaSeries->setName("面积2");

    _pAreaSeries2->setUpperSeries(_pLineSeries2);

    _pChart->addSeries(_pAreaSeries2);

    _pAreaSeries3 = new QAreaSeries();

    _pAreaSeries3->setName("面积3");

    _pAreaSeries3->setUpperSeries(_pLineSeries3);

    _pAreaSeries3->setLowerSeries(_pLineSeries2);

    _pChart->addSeries(_pAreaSeries3);

    _pAreaSeries4 = new QAreaSeries();

    _pAreaSeries4->setName("面积4");

    _pAreaSeries4->setUpperSeries(_pLineSeries3);

    _pAreaSeries4->setLowerSeries(_pLineSeries4);

    _pChart->addSeries(_pAreaSeries4);

    _pChart->addSeries(_pAreaSeries);

    resetColor();

}
初始化颜色
void AreaChartWidget::resetColor()

{

    QList<QLineSeries *> list;

    list.append(_pLineSeries);

    list.append(_pLineSeries2);

    list.append(_pLineSeries3);

    list.append(_pLineSeries4);

    for(int index = 0; index < list.size(); index++)

    {

        list.at(index)->setColor(QColor(qrand()%256, qrand()%256, qrand()%256));

    }

}
工程模板:对应版本号v1.1.0
对应版本号v1.1.0
增加面积图
对折线图、曲线图和面积图增加数据点显示、数据点标签显示
上一篇:《Qt开发技术:QCharts(三)QCharts样条曲线图介绍、Demo以及代码详解》
下一篇: 敬请期待…
Qt开发技术:QCharts(四)QChart面积图介绍、Demo以及代码详解的更多相关文章
- Qt开发技术:QCharts(三)QCharts样条曲线图介绍、Demo以及代码详解
若该文为原创文章,未经允许不得转载原博主博客地址:https://blog.csdn.net/qq21497936原博主博客导航:https://blog.csdn.net/qq21497936/ar ...
- Qt开发技术:Q3D图表开发笔记(三):Q3DSurface三维曲面图介绍、Demo以及代码详解
前言 qt提供了q3d进行三维开发,虽然这个框架没有得到大量运用也不是那么成功,性能上也有很大的欠缺,但是普通的点到为止的应用展示还是可以的. 其中就包括华丽绚烂的三维图表,数据量不大的时候是可 ...
- FFmpeg开发笔记(四):ffmpeg解码的基本流程详解
若该文为原创文章,未经允许不得转载原博主博客地址:https://blog.csdn.net/qq21497936原博主博客导航:https://blog.csdn.net/qq21497936/ar ...
- Qt开发技术:Q3D图表开发笔记(一):Q3DScatter三维散点图介绍、Demo以及代码详解
前言 qt提供了q3d进行三维开发,虽然这个框架没有得到大量运用也不是那么成功,性能上也有很大的欠缺,但是普通的点到为止的应用展示还是可以的. 其中就包括华丽绚烂的三维图表,数据量不大的时候是可 ...
- Qwt开发笔记(二):Qwt基础框架介绍、折线图介绍、折线图Demo以及代码详解
前言 QWT开发笔记系列整理集合,这是目前使用最为广泛的Qt图表类(Qt的QWidget代码方向只有QtCharts,Qwt,QCustomPlot),使用多年,系统性的整理,本系列旨在系统解说并 ...
- FFmpeg开发笔记(五):ffmpeg解码的基本流程详解(ffmpeg3新解码api)
若该文为原创文章,未经允许不得转载原博主博客地址:https://blog.csdn.net/qq21497936原博主博客导航:https://blog.csdn.net/qq21497936/ar ...
- Qt开发技术:图形视图框架(二)场景QGraphicsScene、QGraphicsItem与QGraphicsView详解
前话 Qt的图形视图框架,最核心的三个类为:QGraphicsScene.QGraphicsItem与QGraphicsView. 基于图形框架的高级白板软件Demo QGraphicsSce ...
- “全栈2019”Java第一百零四章:匿名内部类与外部成员互访详解
难度 初级 学习时间 10分钟 适合人群 零基础 开发语言 Java 开发环境 JDK v11 IntelliJ IDEA v2018.3 文章原文链接 "全栈2019"Java第 ...
- ARM Cortex-M底层技术(2)—启动代码详解
杂谈 工作了一天,脑袋比较乱.一直想把底层的知识写成一个系列,希望可以坚持下去.为什么要写底层的东西呢?首先,工作用到了这部分内容,最近和内部Flash打交道比较多,自然而然会接触到一些底层的东西:第 ...
- 【转】UML类图与类的关系详解
UML类图与类的关系详解 2011-04-21 来源:网络 在画类图的时候,理清类和类之间的关系是重点.类的关系有泛化(Generalization).实现(Realization).依赖(D ...
随机推荐
- [转帖]手摸手搭建简单的jmeter+influxdb+grafana性能监控平台
我安装的机器是阿里云的centos8机器,其他的系统暂未验证 1.安装influxdb influxdb 下载地址https://portal.influxdata.com/downloads/,也可 ...
- [转帖]实战瓶颈定位-我的MySQL为什么压不上去
https://plantegg.github.io/2023/06/20/%E5%AE%9E%E6%88%98%E7%93%B6%E9%A2%88%E5%AE%9A%E4%BD%8D-%E6%88% ...
- [转帖]nginx 启动、重启、关闭命令详解
https://www.jianshu.com/p/d70006f18a6d 作者:Gakki nginx 命令详解 输入命令:nginx -h nginx -h -?,-h:查看帮助 -v:显示 ...
- [转帖]【JVM】常用虚拟机参数及实例
常用参数表 参数 描述 -XX:+PrintGC 启动java虚拟机后,只要遇到gc,就打印日志 -XX:+PrintGCDetails gc发生时,打印更详细的日志 -XX:+PrintHeapAt ...
- 什么是ChatGPT,什么是大模型prompt
什么是ChatGpt ChatGPT是一个由美国的OpenAI公司开发的聊天机器人,它使用了大型语言模型,现在有GPT-3.GPT-3.5.GPT-4.0多个版本,目前还在快速发展,通过监督学习和强化 ...
- TienChin 代码格式化-项目结构大改造
代码格式化 博主下载项目之后发现,整体的代码格式化风格,与 C 那种语言很相似,说明这个作者之前就是从事这块的导致风格有点类似,我们来格式化一下,当然这不是必要的,我是没习惯这种写法所以这里我写一下我 ...
- 【深度学习项目二】卷积神经网络LeNet实现minst数字识别
相关文章: [深度学习项目一]全连接神经网络实现mnist数字识别 [深度学习项目二]卷积神经网络LeNet实现minst数字识别 [深度学习项目三]ResNet50多分类任务[十二生肖分类] 『深度 ...
- 遥感图像处理笔记之【FastAI Multi-label image classification】
遥感图像处理学习(4) 前言 遥感系列第4篇.遥感图像处理方向的学习者可以参考或者复刻 本文初编辑于2023年12月15日 2024年1月24日搬运至本人博客园平台 文章标题:FastAI Multi ...
- 【动态内存】C语言动态内存管理及使用总结篇【初学者保姆级福利】
动态内存管理及应用总结篇 一篇博客学好动态内存的管理和使用 这篇博客干货满满,建议收藏再看哦!! 求个赞求个赞求个赞求个赞 谢谢 先赞后看好习惯 打字不容易,这都是很用心做的,希望得到支持你 大家的点 ...
- MarkDown文件插入公式(常用格式)
1.插入公式 markdown支持插入公式,书写公式需要按照特定格式来写,涉及到希腊字母.符号.角标.基本语法等内容需要熟悉, 1.1 句中插入公式 表达式前后插入$即可 ,比如$\alpha$,显示 ...