Prometheus + Spring Boot 应用监控
1. Prometheus是什么
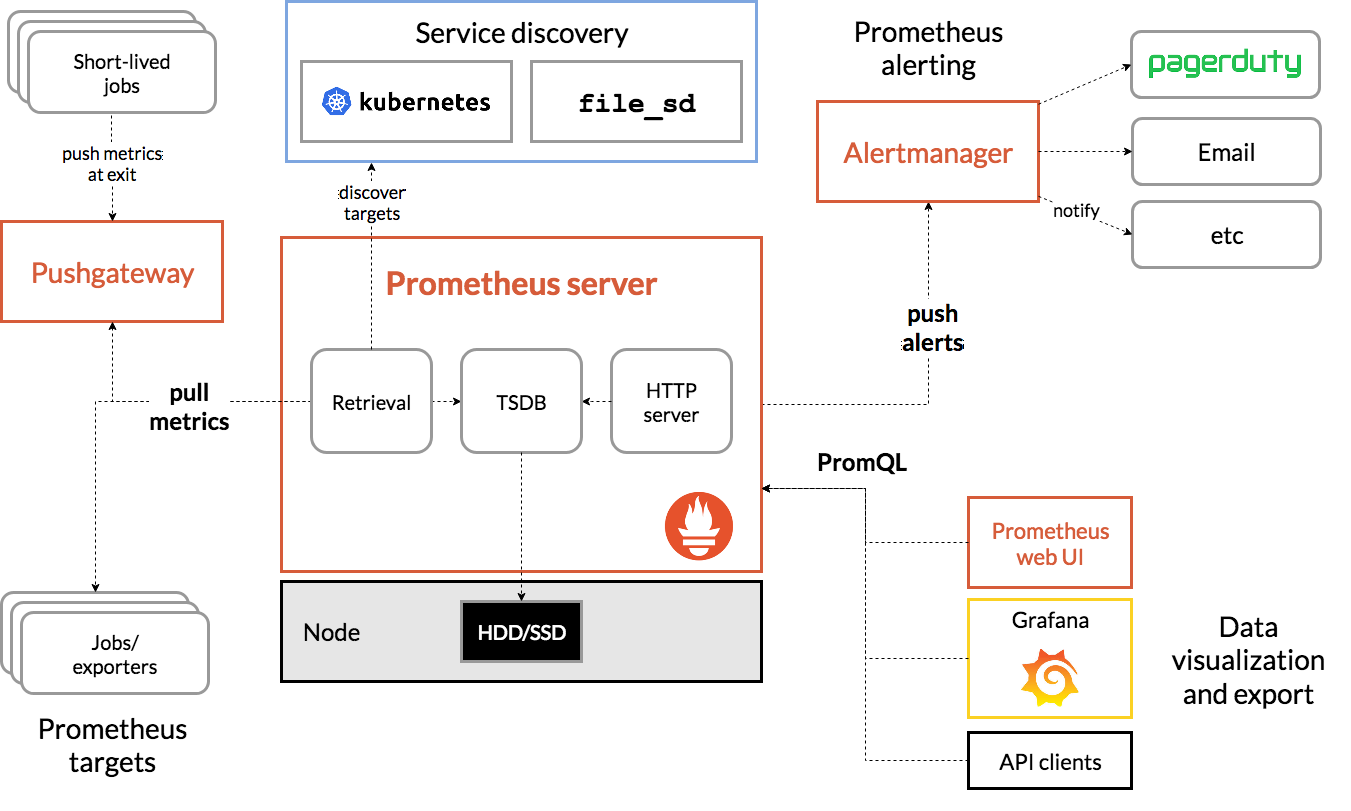
Prometheus是一个具有活跃生态系统的开源系统监控和告警工具包。一言以蔽之,它是一套开源监控解决方案。
Prometheus主要特性:
- 多维数据模型,其中包含由指标名称和键/值对标识的时间序列数据
- PromQL,一种灵活的查询语言
- 不依赖分布式存储; 单服务器节点是自治的
- 时间序列收集通过HTTP上的pull模型进行
- 通过中间网关支持推送(push)时间序列
- 通过服务发现或静态配置发现目标
- 支持多种模式的图形和仪表盘
为什么用pull(拉取)而不用push(推送)呢?
因为,pull有以下优势:
- 进行更改时,可以在笔记本电脑上运行监控
- 可以更轻松地判断目标是否下线
- 可以手动转到目标并使用Web浏览器检查其运行状况
目标暴露HTTP端点,Prometheus服务端通过HTTP主动拉取数据。既然是服务端自己主动向目标拉取数据,那么服务端运行在本地(我们自己的电脑上)也是可以的,只要能访问目标端点即可,同时就像心跳检测一样可以判断目标是否下线,还有,服务端自己主动拉取,那么想拉取谁的数据就拉取谁的数据,因而可以随意切换拉取目标。
回想一下Skywalking是怎么做的,SkyWalking有客户端和服务端,需要在目标服务上安装探针(agent),探针采集目标服务的指标数据,上报给服务端OAP服务,这个对目标有一定的侵入性,不过可以接受。Prometheus不需要探针,可以借助push gateway来实现push效果。
对了,有个名词要先说清楚,metrics (译:度量,指标),个人更倾向于把它翻译成指标,后面说指标就是metrics
2. 基本概念
2.1. 数据模型
Prometheus基本上将所有数据存储为时间序列:具有时间戳的值流,它们属于同一个指标和同一组标记的维度。除了存储的时间序列外,Prometheus还可以生成临时派生的时间序列作为查询的结果。
Metric names and labels
Every time series is uniquely identified by its metric name and optional key-value pairs called labels.
每个时间序列都由它的指标名称和称为标签的可选键/值对唯一标识。
样本构成实际的时间序列数据。 每个样本包括:
- 一个64位的浮点值
- 一个毫秒时间戳
给定指标名称和一组标签,时间序列通常使用这种符号来标识:
<metric name>{<label name>=<label value>, ...}
例如,有一个时间序列,指标名称是api_http_requests_total,标签有method="POST"和handler="/messages",那么它可能被表示成这样:
api_http_requests_total{method="POST", handler="/messages"}
2.2. 指标类型
Counter
counter是一个累积量度,代表一个单调递增的计数器,其值只能增加或在重新启动时重置为零。例如,可以使用计数器来表示已服务请求数,已完成任务或错误的数量。
不要使用计数器来显示可以减小的值。例如,请勿对当前正在运行的进程数使用计数器,代替的应该使用量规。
Gauge
量规是一种指标,代表可以任意上下波动的单个数值。
量规通常用于测量值,例如温度或当前内存使用量,还用于可能上升和下降的“计数”,例如并发请求数。
Histogram
直方图对观察结果(通常是请求持续时间或响应大小)进行抽样,并在可配置的桶中对它们进行计数。它还提供了所有观测值的总和。
一个基础指标名称为<basename>的直方图在抓取期间会暴露多个时间序列:
- 观察桶的累积计数器,表示为 <basename>_bucket{le="<upper inclusive bound>"}
- 所有观测值的总和,表示为 <basename>_sum
- 观察到的事件数量,表示为 <basename>_count
Summary
与直方图类似,摘要对观察结果(通常是请求持续时间和响应大小等内容)进行抽样分析。虽然它还提供了观测值的总数和所有观测值的总和,但它可以计算滑动时间窗口内的可配置分位数。
一个基础指标名称为<basename>的摘要在抓取期间暴露多个时间序列:
- 观测事件的φ分位数(0≤φ≤1)流,表示为<basename>{quantile="<φ>"}
- 所有观测值的总和,表示为 <basename>_sum
- 观察到的事件数,表示为 <basename>_count
2.3. 作业和实例
在Prometheus的术语中,可以抓取的端点称为实例,通常对应于单个进程。具有相同目的的实例集合,称为作业。
例如,一个作业有四个实例:
- job: api-server
- instance 1: 1.2.3.4:5670
- instance 2: 1.2.3.4:5671
- instance 3: 5.6.7.8:5670
- instance 4: 5.6.7.8:5671
当Prometheus抓取目标时,它会自动在抓取的时间序列上附加一些标签,以识别被抓取的目标:
- job:目标所属的已配置的作业名称
- instance:被抓取的目标URL的<host>:<port>部分
3. 安装与配置

Prometheus通过抓取指标HTTP端点从目标收集指标。由于Prometheus以相同的方式暴露自己的数据,因此它也可以抓取并监视其自身的健康状况。
默认情况下,不用更改配置,直接运行就可以抓取prometheus自身的健康状况数据
# Start Prometheus.

# By default, Prometheus stores its database in ./data (flag --storage.tsdb.path)


./prometheus --config.file=prometheus.yml
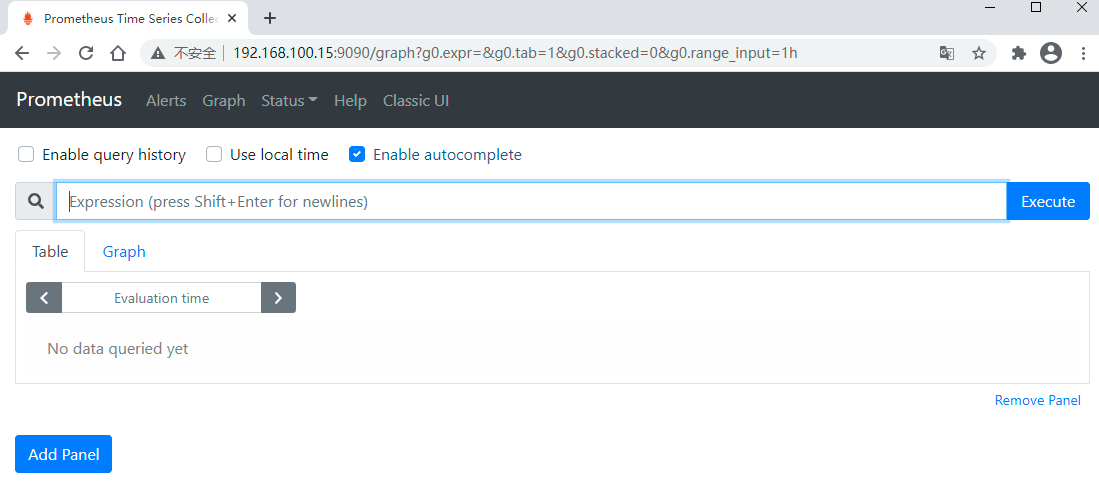
直接访问 localhost:9090
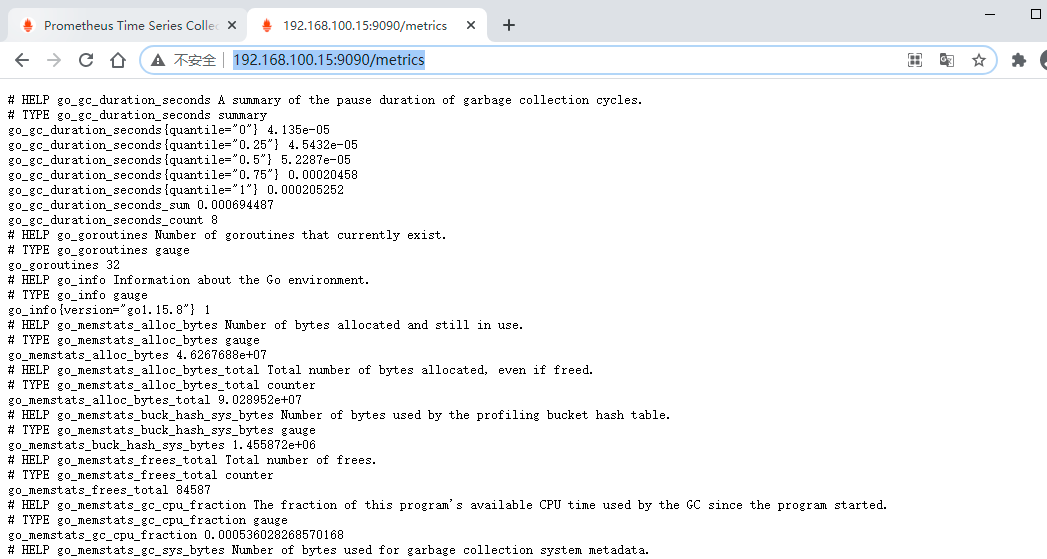
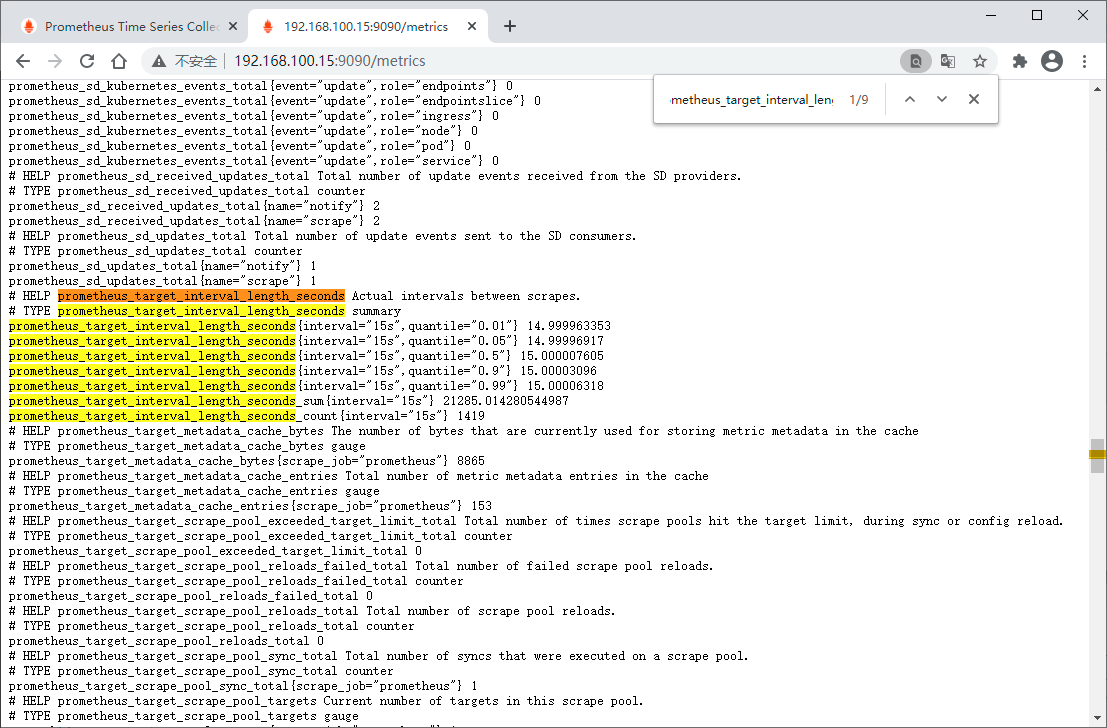
访问 localhost:9090/metrics 可以查看各项指标
举个例子
输入以下表达式,点“Execute”,可以看到以下效果
prometheus_target_interval_length_seconds
这应该返回多个不同的时间序列(以及每个序列的最新值),每个序列的指标名称均为prometheus_target_interval_length_seconds,但具有不同的标签。
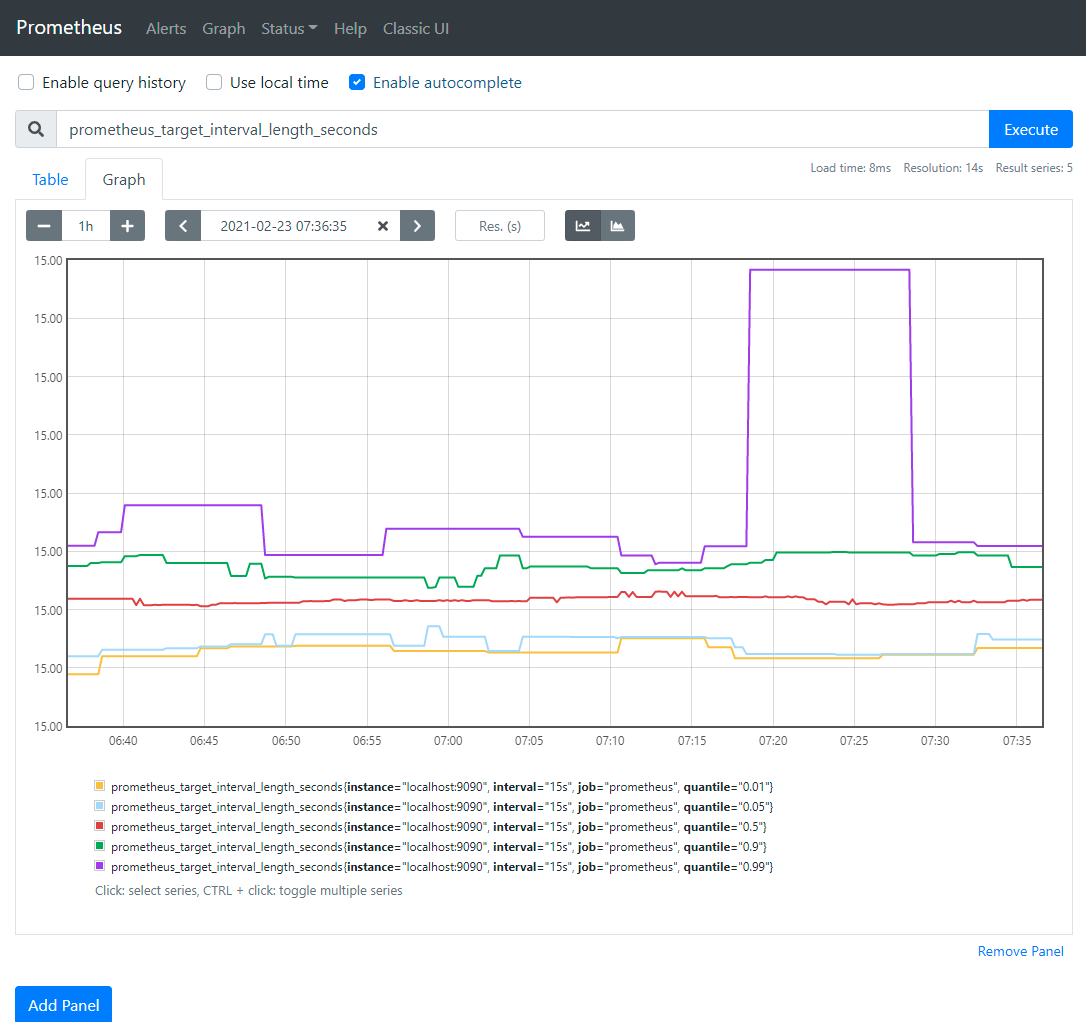
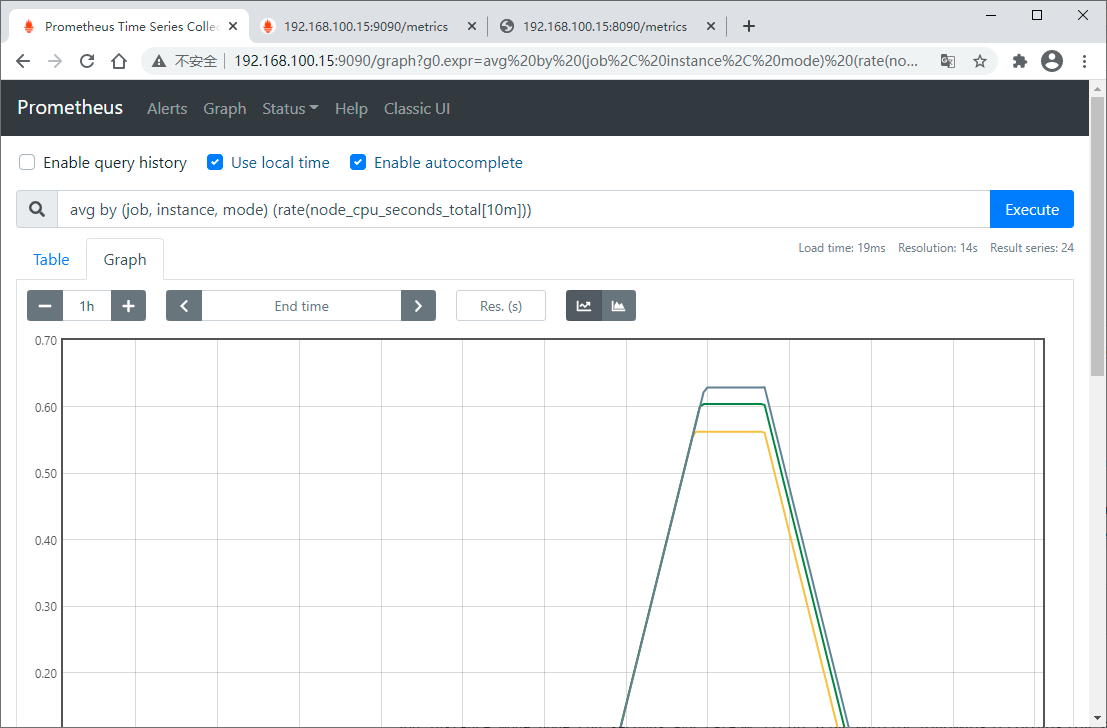
这个是以图形化的方式展示指标,通过localhost:9090/metrics查看也是一样的
如果我们只对99%的延迟感兴趣,我们可以使用以下查询:
prometheus_target_interval_length_seconds{quantile="0.99"}
为了计算返回的时间序列数,查询应该这样写:
count(prometheus_target_interval_length_seconds)
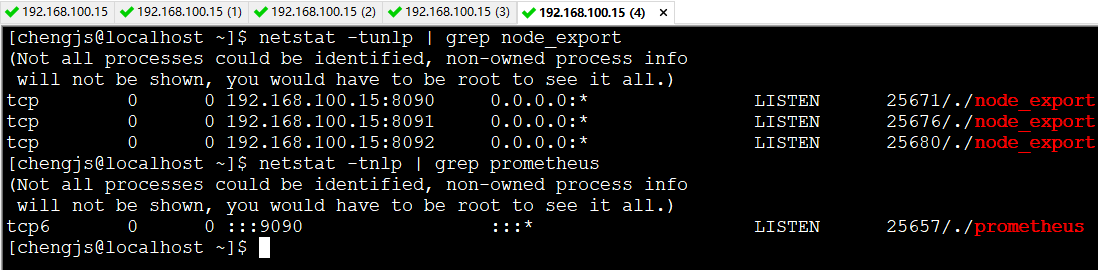
接下来,让我们利用Node Exporter来多添加几个目标:
tar -xzvf node_exporter-*.*.tar.gz

cd node_exporter-*.*

# Start 3 example targets in separate terminals:

./node_exporter --web.listen-address 127.0.0.1:8080

./node_exporter --web.listen-address 127.0.0.1:8081

./node_exporter --web.listen-address 127.0.0.1:8082
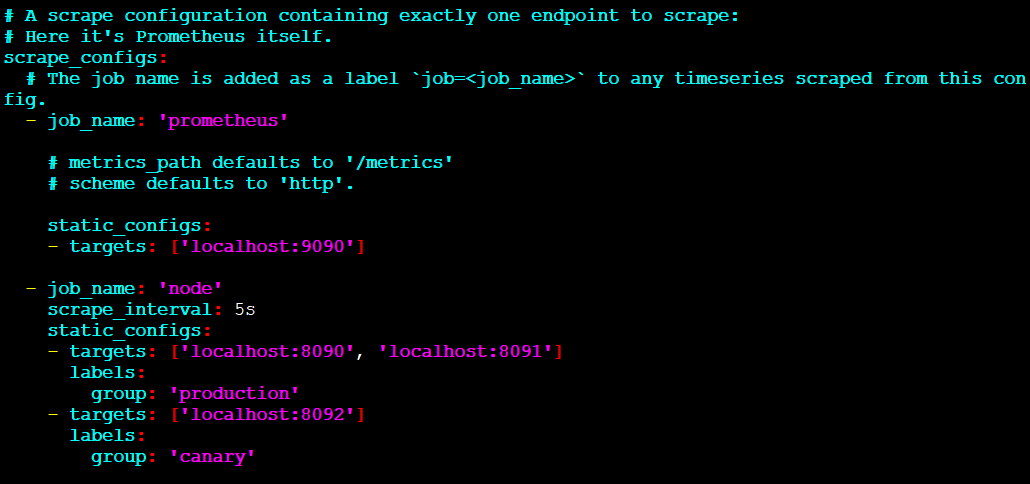
接下来,配置Prometheus来抓取这三个新目标
首先,定义一个名为'node'的作业,这个作业负责从这三个目标端点抓取数据。假设,想象前两个端点是生产环境的,另一个是非生产环境的,为了以示区别,我们将其打上两个不同的标签。在本示例中,我们将group="production"标签添加到第一个目标组,同时将group="canary"添加到第二个目标。
scrape_configs:

  - job_name:       'node'

    # Override the global default and scrape targets from this job every 5 seconds.

    scrape_interval: 5s

    static_configs:

      - targets: ['localhost:8080', 'localhost:8081']

        labels:

          group: 'production'

      - targets: ['localhost:8082']

        labels:

          group: 'canary'
3.1. 配置
为了查看所有的命令行参数,运行如下命令
./prometheus -h
配置文件是YAML格式的,可以使用 --config.file参数指定
配置文件的主要结构如下:
global:

  # How frequently to scrape targets by default.

  [ scrape_interval: <duration> | default = 1m ]

  # How long until a scrape request times out.

  [ scrape_timeout: <duration> | default = 10s ]

  # How frequently to evaluate rules.

  [ evaluation_interval: <duration> | default = 1m ]

  # The labels to add to any time series or alerts when communicating with

  # external systems (federation, remote storage, Alertmanager).

  external_labels:

    [ <labelname>: <labelvalue> ... ]

  # File to which PromQL queries are logged.

  # Reloading the configuration will reopen the file.

  [ query_log_file: <string> ]

# Rule files specifies a list of globs. Rules and alerts are read from

# all matching files.

rule_files:

  [ - <filepath_glob> ... ]

# A list of scrape configurations.

scrape_configs:

  [ - <scrape_config> ... ]

# Alerting specifies settings related to the Alertmanager.

alerting:

  alert_relabel_configs:

    [ - <relabel_config> ... ]

  alertmanagers:

    [ - <alertmanager_config> ... ]

# Settings related to the remote write feature.

remote_write:

  [ - <remote_write> ... ]

# Settings related to the remote read feature.

remote_read:

  [ - <remote_read> ... ]
4. 抓取 Spring Boot 应用
Prometheus希望抓取或轮询单个应用程序实例以获取指标。 Spring Boot在 /actuator/prometheus 提供了一个actuator端点,以适当的格式提供Prometheus抓取。
为了以Prometheus服务器可以抓取的格式公开指标,需要依赖 micrometer-registry-prometheus
<dependency>

    <groupId>io.micrometer</groupId>

    <artifactId>micrometer-registry-prometheus</artifactId>

    <version>1.6.4</version>

</dependency>
下面是一个示例 prometheus.yml
scrape_configs:

  - job_name: 'spring'

    metrics_path: '/actuator/prometheus'

    static_configs:

      - targets: ['HOST:PORT']
接下来,创建一个项目,名为prometheus-example
pom.xml
<?xml version="1.0" encoding="UTF-8"?>

<project xmlns="http://maven.apache.org/POM/4.0.0" xmlns:xsi="http://www.w3.org/2001/XMLSchema-instance"

         xsi:schemaLocation="http://maven.apache.org/POM/4.0.0 https://maven.apache.org/xsd/maven-4.0.0.xsd">

    <modelVersion>4.0.0</modelVersion>

    <parent>

        <groupId>org.springframework.boot</groupId>

        <artifactId>spring-boot-starter-parent</artifactId>

        <version>2.4.3</version>

        <relativePath/> <!-- lookup parent from repository -->

    </parent>

    <groupId>com.cjs.example</groupId>

    <artifactId>prometheus-example</artifactId>

    <version>0.0.1-SNAPSHOT</version>

    <name>prometheus-example</name>

    <description>Demo project for Spring Boot</description>

    <properties>

        <java.version>1.8</java.version>

    </properties>

    <dependencies>

        <dependency>

            <groupId>org.springframework.boot</groupId>

            <artifactId>spring-boot-starter-actuator</artifactId>

        </dependency>

        <dependency>

            <groupId>org.springframework.boot</groupId>

            <artifactId>spring-boot-starter-web</artifactId>

        </dependency>

        <dependency>

            <groupId>io.micrometer</groupId>

            <artifactId>micrometer-registry-prometheus</artifactId>

            <scope>runtime</scope>

        </dependency>

    </dependencies>

    <build>

        <plugins>

            <plugin>

                <groupId>org.springframework.boot</groupId>

                <artifactId>spring-boot-maven-plugin</artifactId>

            </plugin>

        </plugins>

    </build>

</project>
application.yml
spring:

  application:

    name: prometheus-example

management:

  endpoints:

    web:

      exposure:

        include: "*"

  metrics:

    tags:

      application: ${spring.application.name}
这句别忘了: management.metrics.tags.application=${spring.application.name}
Spring Boot Actuator 默认的端点很多,详见
启动项目,浏览器访问 /actuator/prometheus 端点
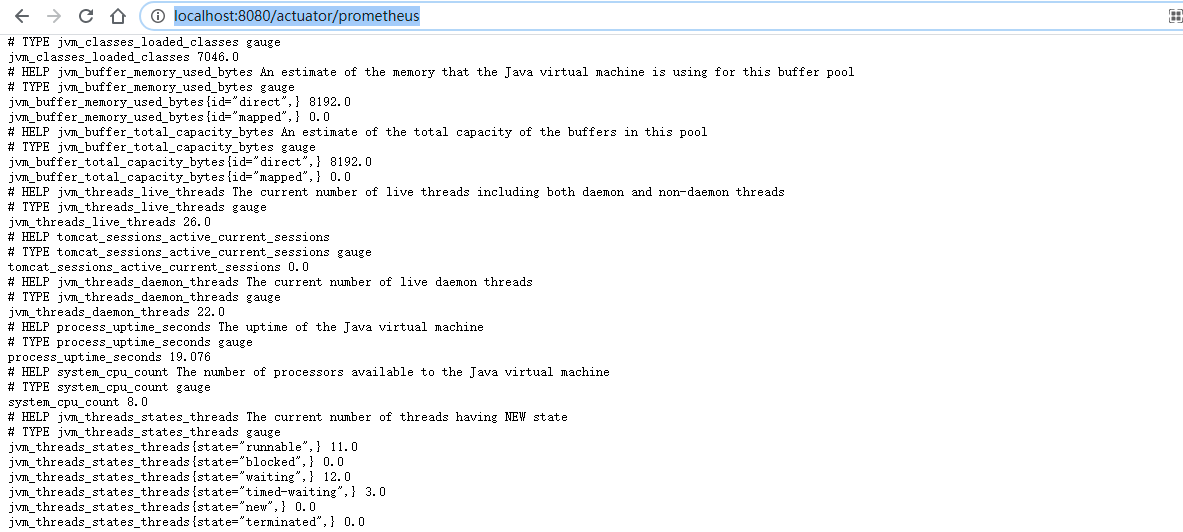
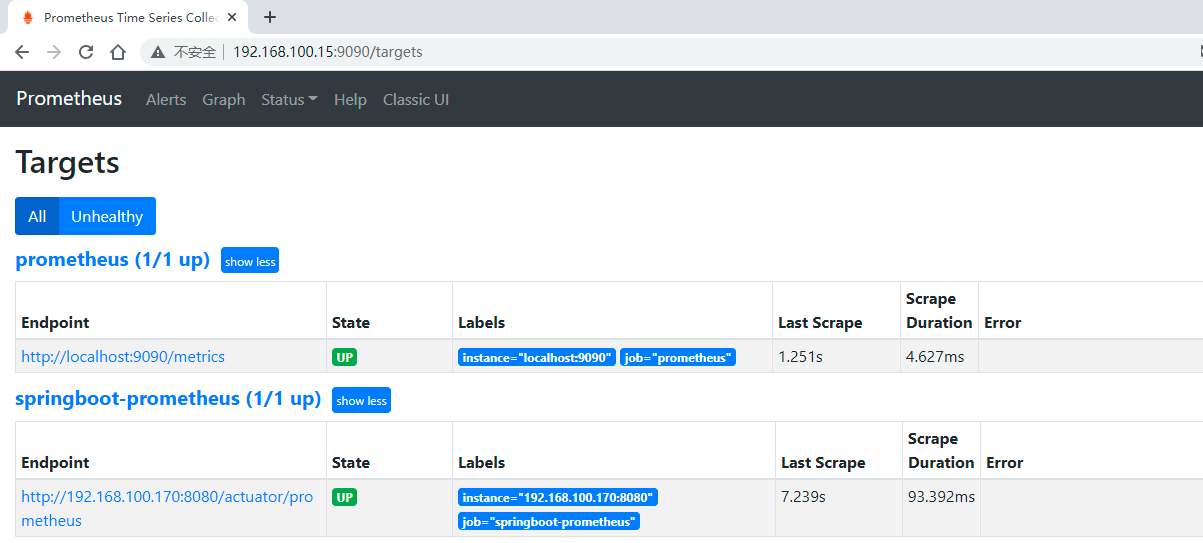
配置Prometheus抓取该应用
scrape_configs:

  # The job name is added as a label `job=<job_name>` to any timeseries scraped from this config.

  - job_name: 'prometheus'

    # metrics_path defaults to '/metrics'

    # scheme defaults to 'http'.

    static_configs:

    - targets: ['localhost:9090']

  - job_name: 'springboot-prometheus'

    metrics_path: '/actuator/prometheus'

    static_configs:

      - targets: ['192.168.100.93:8080']
重启服务
./prometheus --config.file=prometheus.yml
4.1. Grafana
https://grafana.com/tutorials/
下载&解压
wget https://dl.grafana.com/oss/release/grafana-7.4.3.linux-amd64.tar.gz

tar -zxvf grafana-7.4.3.linux-amd64.tar.gz
启动
./bin/grafana-server web
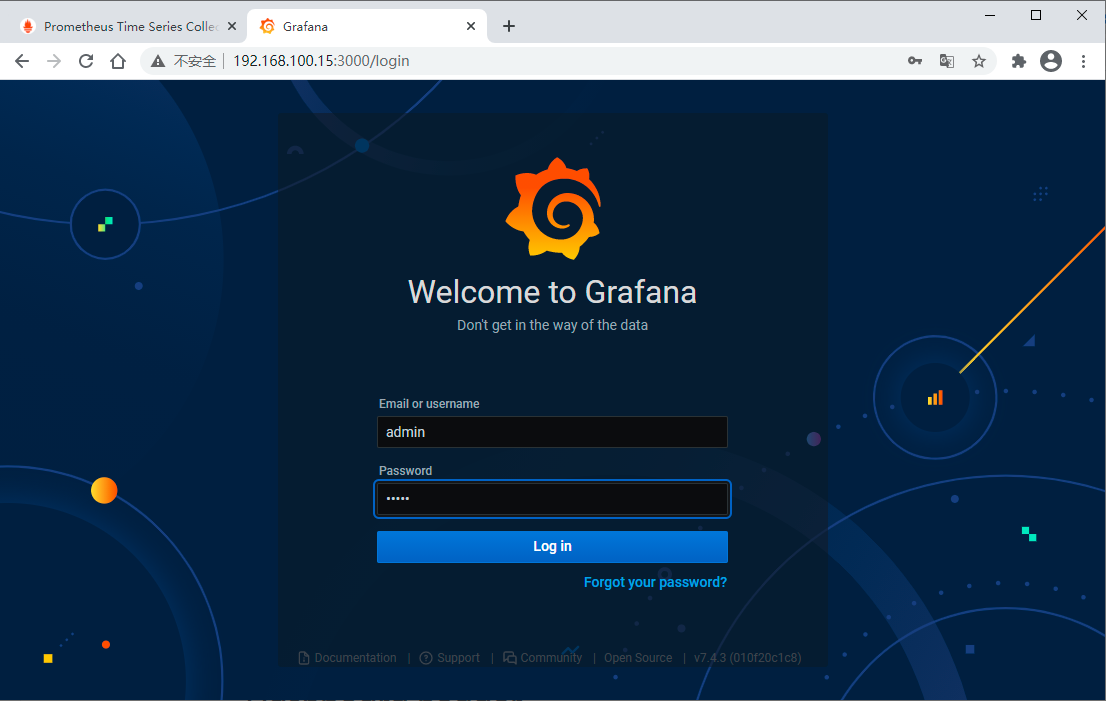
浏览器访问 http://localhost:3000
默认账号是 admin/admin
首次登陆后我们将密码改成admin1234
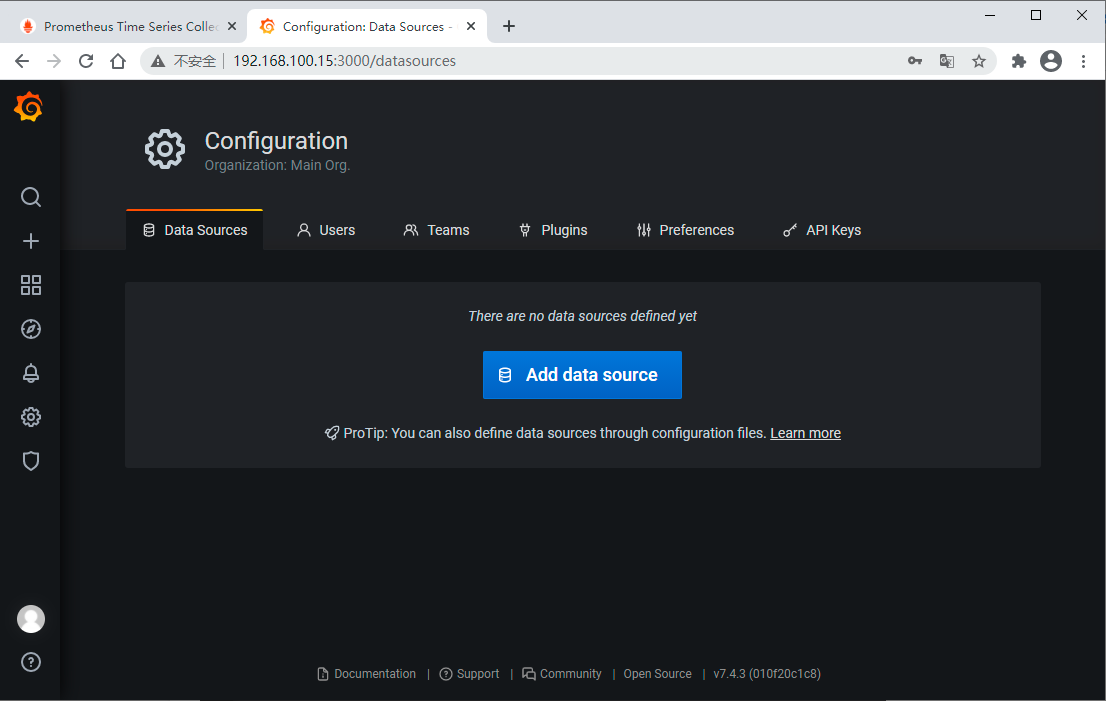
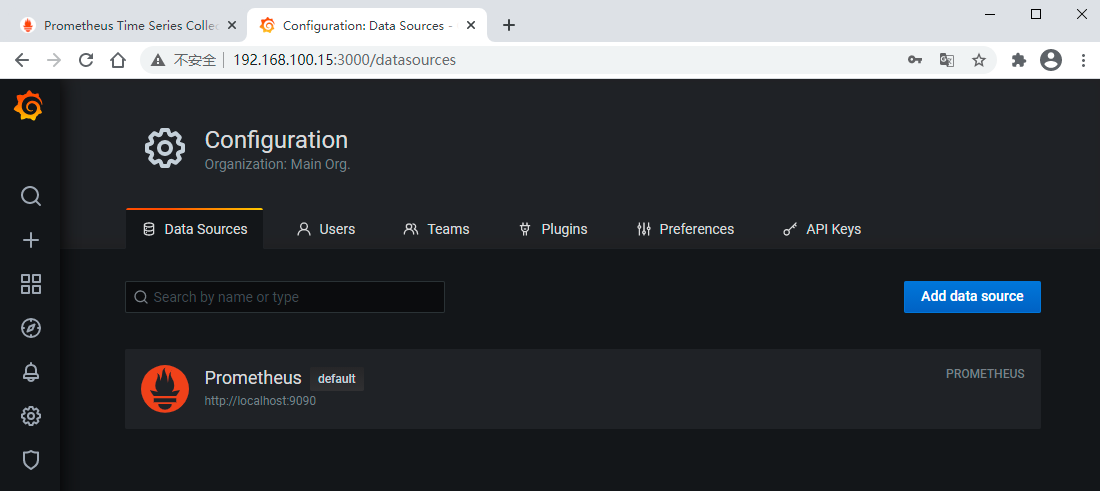
先配置一个数据源,一会儿添加仪表盘的时候要选择数据源的
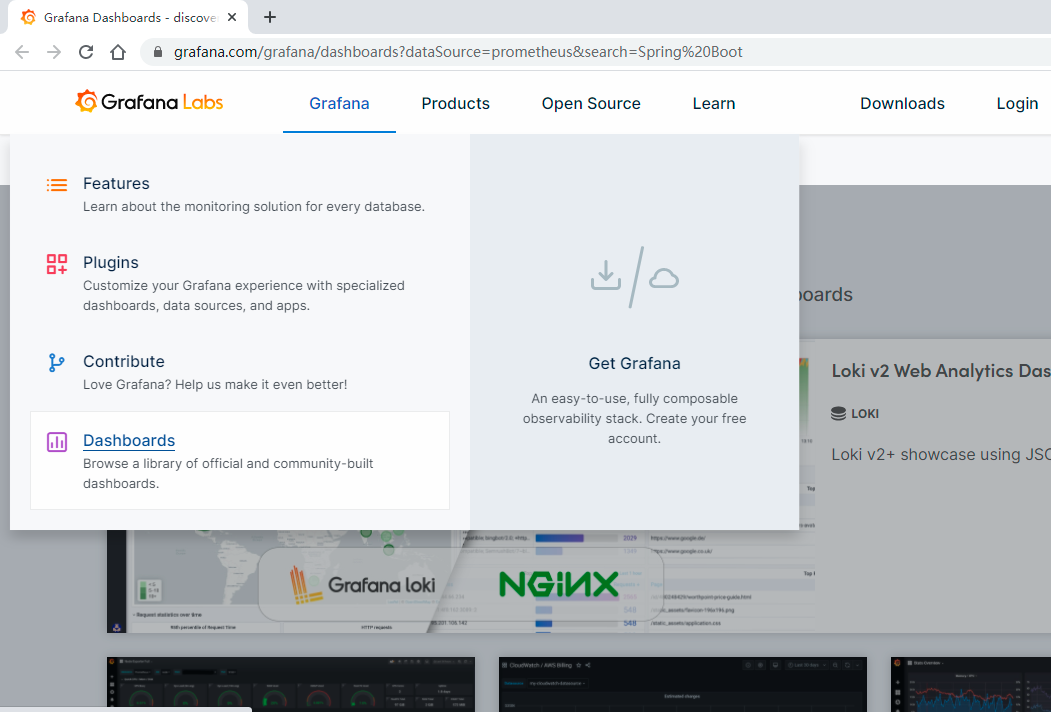
Grafana官方提供了很多模板,我们可以直接使用
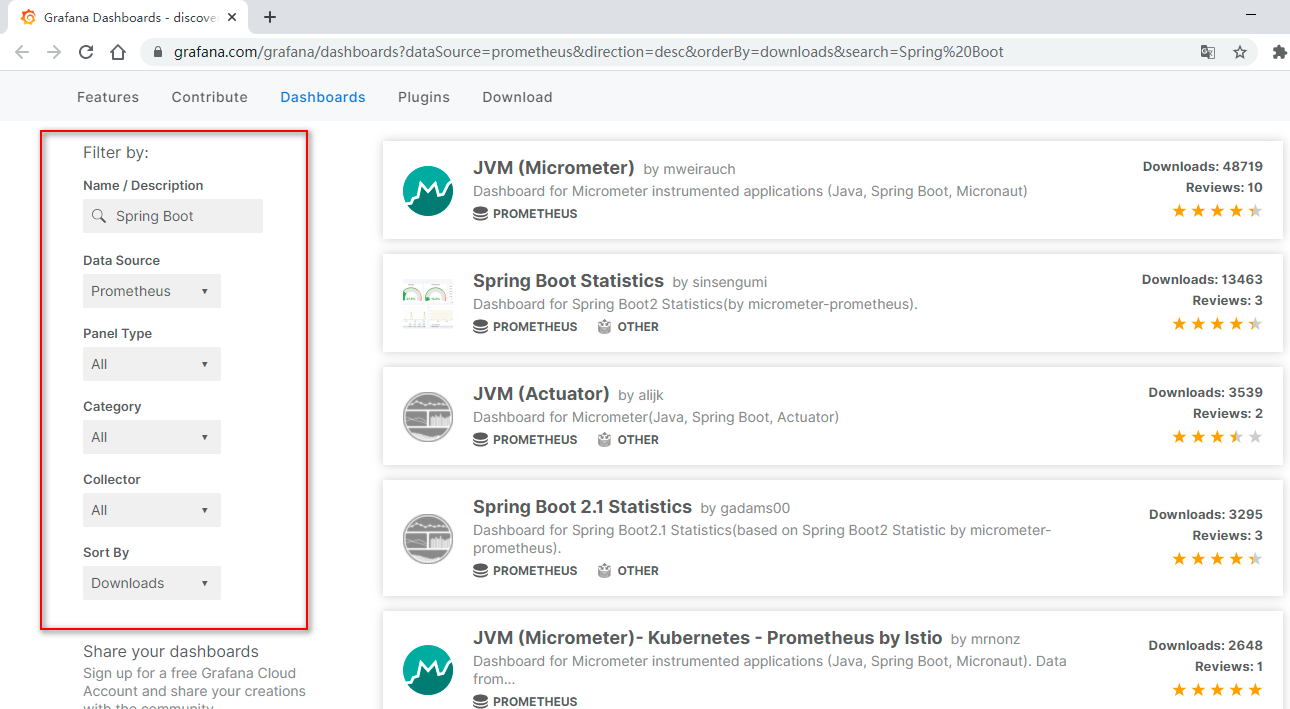
首先要找到我们想要的模板
比如,我们这里随便选了一个模板
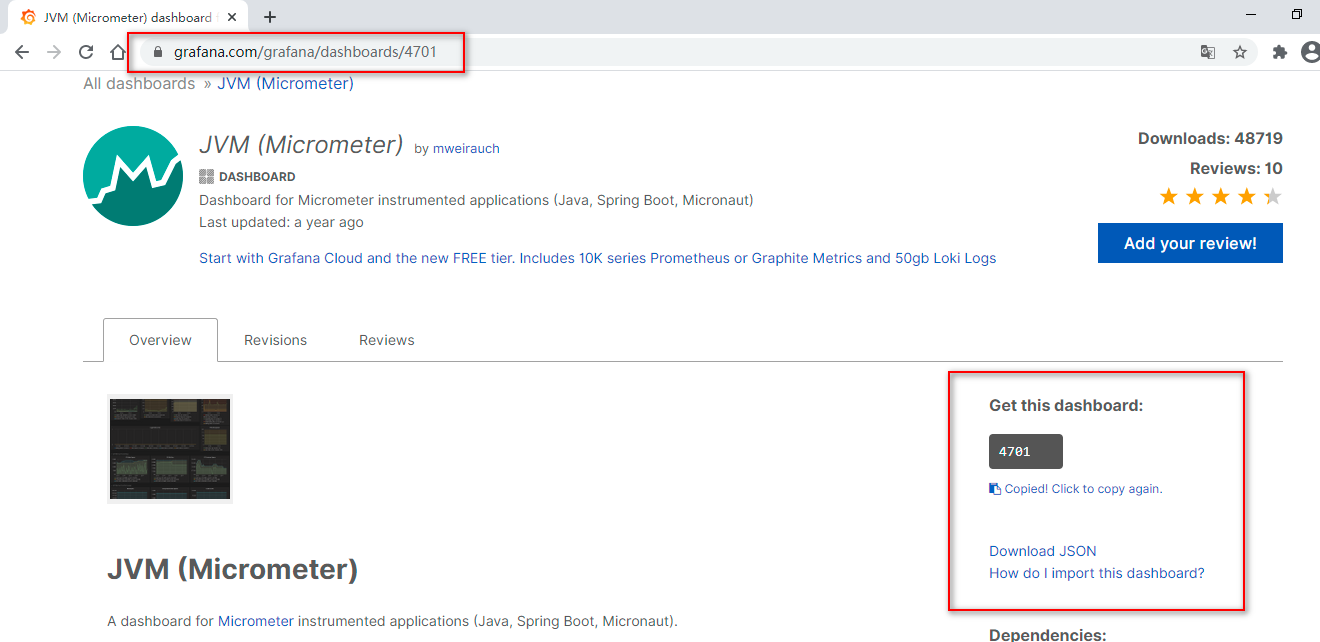
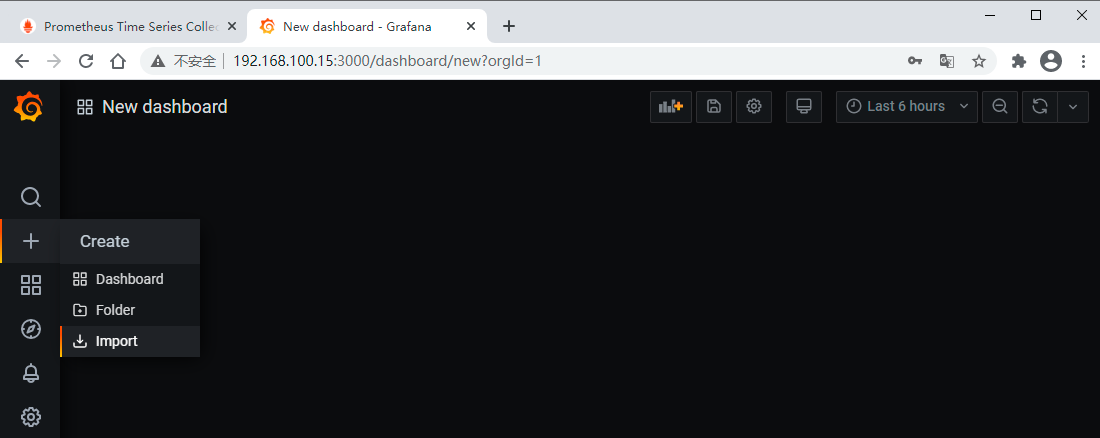
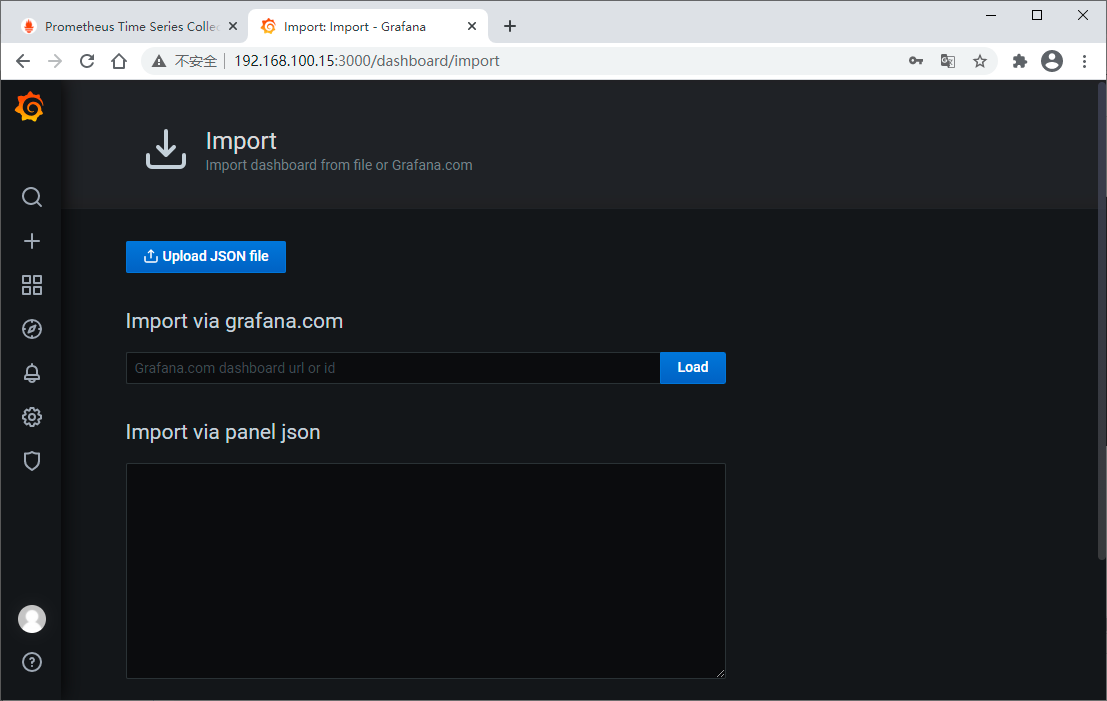
可以直接将模板JSON文件下载下来导入,也可以直接输入模板ID加载,这里我们直接输入模板ID
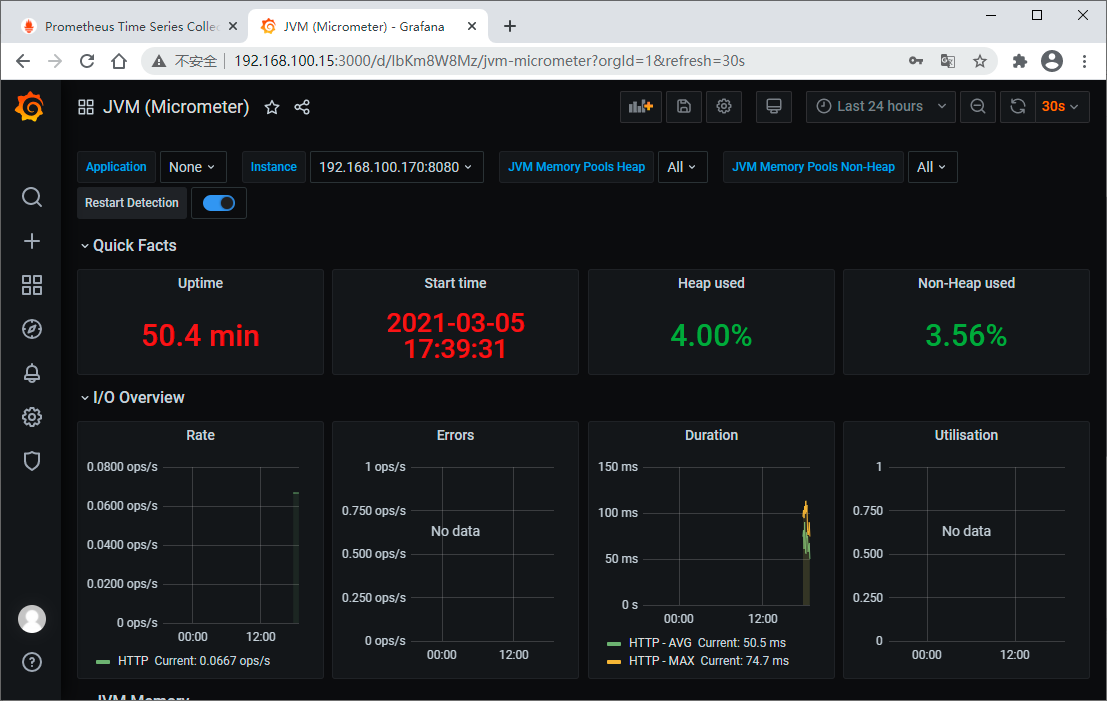
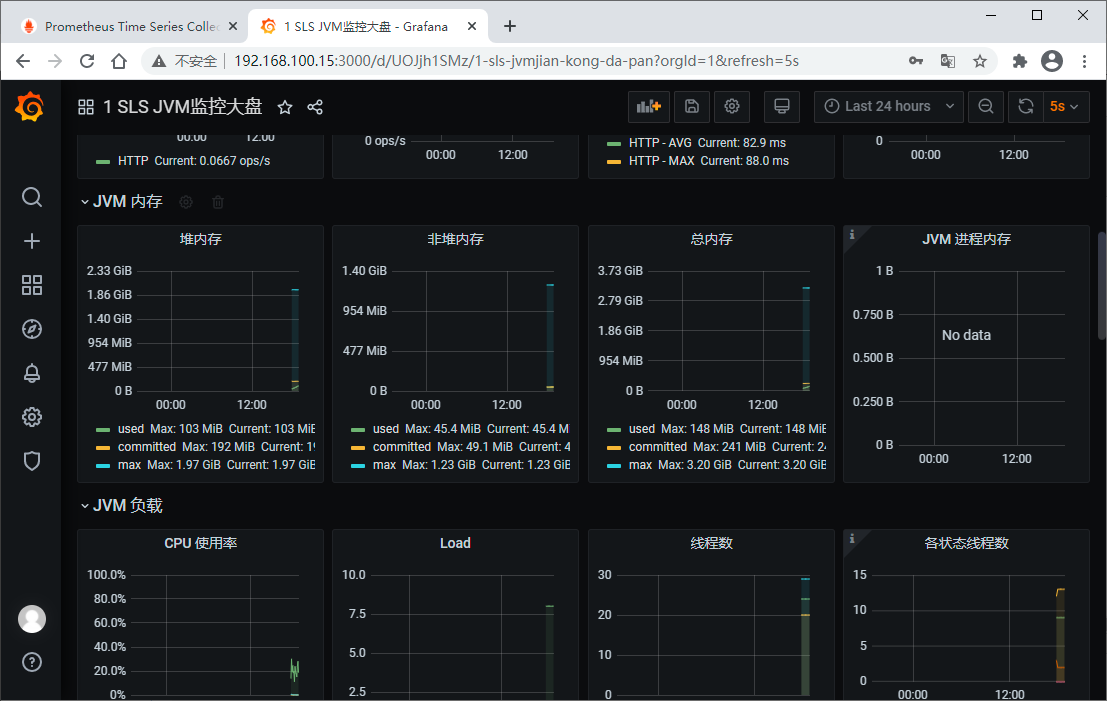
立竿见影,马上就看到漂亮的展示界面了
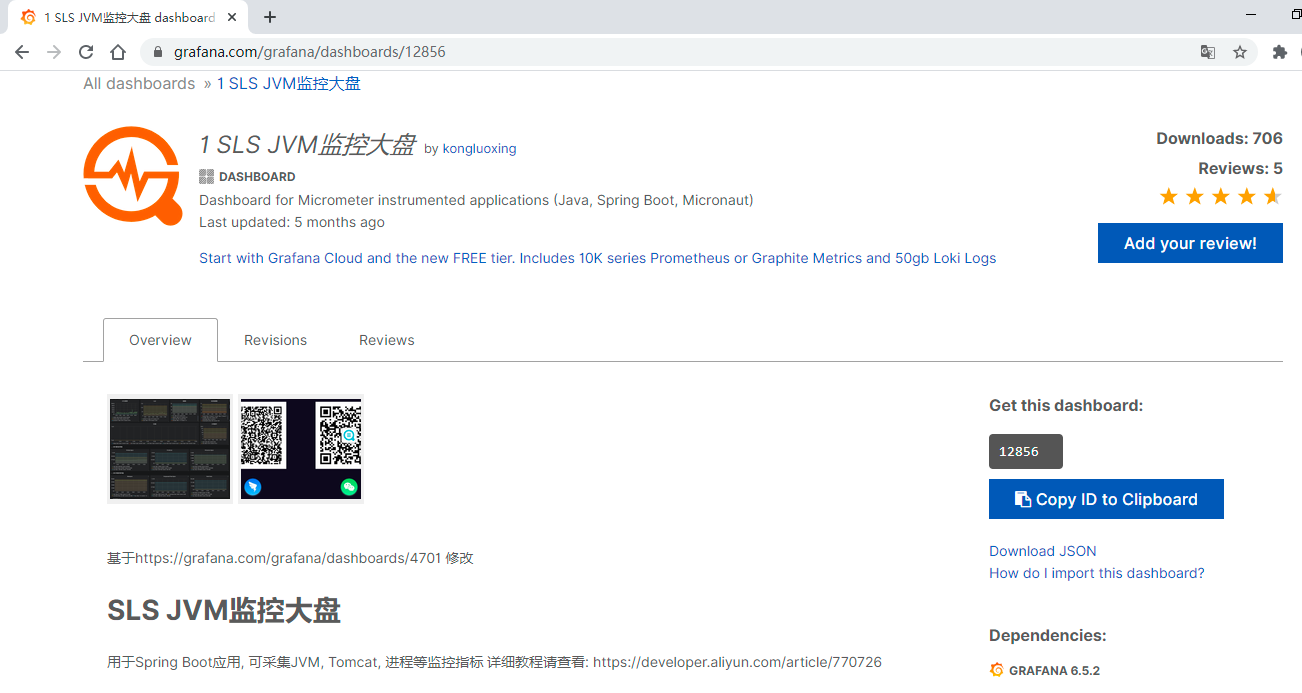
我们再添加一个DashBoard (ID:12856)
Prometheus + Spring Boot 应用监控的更多相关文章
- Spring Boot Actuator监控使用详解
在企业级应用中,学习了如何进行SpringBoot应用的功能开发,以及如何写单元测试.集成测试等还是不够的.在实际的软件开发中还需要:应用程序的监控和管理.SpringBoot的Actuator模块实 ...
- 使用 Spring Boot Admin 监控应用状态
程序员优雅哥 SpringBoot 2.7 实战基础 - 11 - 使用 Spring Boot Admin 监控应用状态 1 Spring Boot Actuator Spring Boot Act ...
- spring Boot(十九):使用Spring Boot Actuator监控应用
spring Boot(十九):使用Spring Boot Actuator监控应用 微服务的特点决定了功能模块的部署是分布式的,大部分功能模块都是运行在不同的机器上,彼此通过服务调用进行交互,前后台 ...
- java spring boot 开启监控信息
效果: 配置 // pom <dependency> <groupId>org.springframework.boot</groupId> <artifac ...
- 转载-Spring Boot应用监控实战
概述 之前讲过Docker容器的可视化监控,即监控容器的运行情况,包括 CPU使用率.内存占用.网络状况以及磁盘空间等等一系列信息.同样利用SpringBoot作为微服务单元的实例化技术选型时,我们不 ...
- Spring Boot (十): Spring Boot Admin 监控 Spring Boot 应用
Spring Boot (十): Spring Boot Admin 监控 Spring Boot 应用 1. 引言 在上一篇文章<Spring Boot (九): 微服务应用监控 Spring ...
- Spring Boot Metrics监控之Prometheus&Grafana(转)
欢迎来到Spring Boot Actuator教程系列的第二部分.在第一部分中,你学习到了spring-boot-actuator模块做了什么,如何配置spring boot应用以及如何与各样的ac ...
- spring boot actuator监控需要注意的点
1. /metrics接口提供的信息进行简单分类如下表: 分类 前缀 报告内容 垃圾收集器 gc.* 已经发生过的垃圾收集次数,以及垃圾收集所耗费的时间,适用于标记-清理垃圾收集器和并行垃圾收集器(数 ...
- springboot(十九):使用Spring Boot Actuator监控应用
微服务的特点决定了功能模块的部署是分布式的,大部分功能模块都是运行在不同的机器上,彼此通过服务调用进行交互,前后台的业务流会经过很多个微服务的处理和传递,出现了异常如何快速定位是哪个环节出现了问题? ...
随机推荐
- Atcoder ABC155_C中有关c++ STL map的用法
题目:https://atcoder.jp/contests/abc155/tasks/abc155_c 这道题的题意是给我们n个string,让我们统计每个string出现的次数,并输出次数最多的一 ...
- 哈尔滨理工大学软件与微电子学院程序设计竞赛(同步赛) C.Coronavirus (BFS)
题意:有一个图,要求从\(S\)走到\(E\),\(.\)表示可以走的路径,\(*\)周围的八个方向均不能走,要求判断是否能走到\(E\),若能,输出最小路径长度,否则输出\(Impossible\) ...
- 牛客算法周周练20 F.紫魔法师 (二分图染色)
题意:给你一张图,对其染色,使得相连的点的颜色两两不同求,最少使用多少种颜色. 题解:首先,若\(n=1\),只需要一种.然后我们再去判断是否是二分图,对于二分图,两种颜色就够了,若不是二分图,也就是 ...
- k8s二进制部署 - master节点安装
下载kubernetes服务端 [root@hdss7-21 ~]# cd /opt/src [root@hdss7-21 src]# wget https://dl.k8s.io/v1.15.2/k ...
- Zabbix 部署配置
监控基本概述 主要的监控工具 1.CACTI:网络监控,Cacti是一套基于PHP,MySQL,SNMP 及 RRDTool 开发的网络流量监测图形分析工具 2.NAGIOS:系统监控,很久之前使用的 ...
- 设计模式(二十二)——状态模式(APP抽奖活动+借贷平台源码剖析)
24.1 APP 抽奖活动问题 请编写程序完成 APP 抽奖活动 具体要求如下: 1) 假如每参加一次这个活动要扣除用户 50 积分,中奖概率是 10% 2) 奖品数量固定,抽完就不能抽奖 3) 活动 ...
- Java中new一个对象是一个怎样的过程?JVM中发生了什么?
Java中new一个对象的步骤: 1. 当虚拟机遇到一条new指令时候,首先去检查这个指令的参数是否能 在常量池中能否定位到一个类的符号引用 (即类的带路径全名),并且检查这个符号引用代表的类是否已被 ...
- spring-cloud-sleuth/zipkin
Spring Cloud Sleuth 一般的,一个分布式服务跟踪系统,主要有三部分:数据收集.数据存储和数据展示.根据系统大小不同,每一部分的结构又有一定变化.譬如,对于大规模分布式系统,数据存储可 ...
- 洛谷p1637 三元上升子序列(树状数组
题目描述 Erwin最近对一种叫"thair"的东西巨感兴趣... 在含有n个整数的序列a1,a2......an中, 三个数被称作"thair"当且仅当i&l ...
- matplotlib 单figure多图
method 1 import numpy as np import matplotlib.pyplot as plt fg, axes = plt.subplots(1, 2, figsize=(1 ...