matplotlib的一些代码
Matplotlib Python 画图教程 (莫烦Python)_演讲•公开课_科技_bilibili_哔哩哔哩 https://www.bilibili.com/video/av16378354/?from=search&seid=16336534570780842214
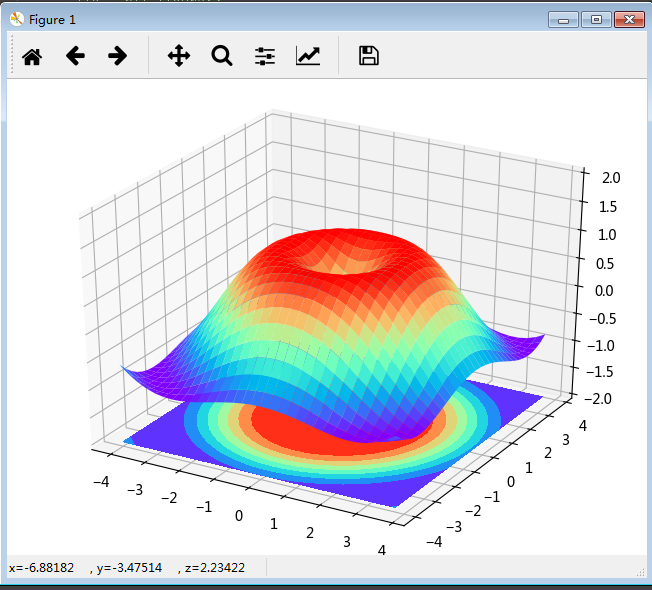
"""画3D图"""
import numpy as np
import matplotlib.pyplot as plt
from mpl_toolkits.mplot3d import Axes3D fig = plt.figure()
ax = Axes3D(fig)
# X,Y value
X = np.arange(-4, 4, 0.25)
Y = np.arange(-4, 4, 0.25)
X, Y = np.meshgrid(X, Y)
R = np.sqrt(X**2 + Y**2)
# Z value
Z = np.sin(R)
# 画3D,restride为3D图上每个行宽,cstride为列宽
ax.plot_surface(X, Y, Z, rstride=1, cstride=1, cmap=plt.get_cmap('rainbow'))
ax.contourf(X, Y, Z, zdir='z', offset=-2, cmap='rainbow') # zdir为等高线图与Z轴垂直
ax.set_zlim(-2, 2)
plt.show()
"""subplot另外三种分格方法"""

import matplotlib.pyplot as plt

import matplotlib.gridspec as gridspec

##### Method 1:subplot2grid

plt.figure()

ax1 = plt.subplot2grid((3, 3), (0, 0), rowspan=1, colspan=3)  # 起点0行0列,跨度1行3列

ax1.plot([1, 2], [1, 2])

ax1.set_title('ax1 title')  # 有ax用set

ax2 = plt.subplot2grid((3, 3), (1, 0), rowspan=1, colspan=2)

ax3 = plt.subplot2grid((3, 3), (1, 2), rowspan=2, colspan=1)

ax4 = plt.subplot2grid((3, 3), (2, 0))

ax5 = plt.subplot2grid((3, 3), (2, 1))

# ##### Method 2:gridspec

plt.figure()

gs = gridspec.GridSpec(3, 3)  # 返回一个对象3行3列的对象

ax1 = plt.subplot(gs[0, :])  # 行列

ax2 = plt.subplot(gs[1, :2])

ax3 = plt.subplot(gs[1:, 2])

ax4 = plt.subplot(gs[2, 0])

ax5 = plt.subplot(gs[2, 1])

##### Method3:easy to define structure

# 返回值是figure和所有的axes.((ax11, ax12), (ax21, ax22))为格式

f, ((ax11, ax12), (ax21, ax22)) = plt.subplots(2, 2, sharex=True, sharey=True)

ax11.scatter([1, 2], [1, 2])

plt.tight_layout()  # 紧凑显示图片,居中显示

plt.show()
这是非常实用的,因为可以轻松地对axes数组进行索引,就好像是一个二维数组一样,例如,axes[0, 1]。你还可以通过sharex和sharey指定subplot应该具有相同的X轴或Y轴。在比较相同范围的数据时,这也是非常实用的,否则,matplotlib会自动缩放各图表的界限。

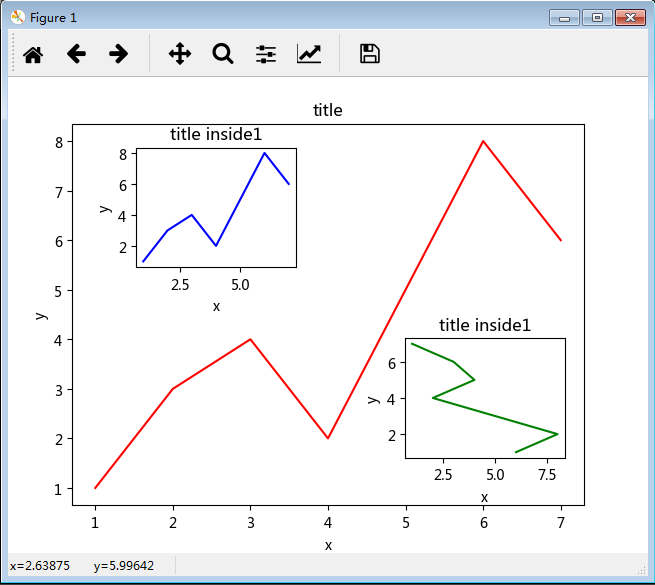
"""图中图"""

import matplotlib.pyplot as plt

fig = plt.figure()

x = [1, 2, 3, 4, 5, 6, 7]

y = [1, 3, 4, 2, 5, 8, 6]

left, bottom, widht, height = 0.1, 0.1, 0.8, 0.8  # 按在figure上的比例

ax1 = fig.add_axes([left, bottom, widht, height])

ax1.plot(x, y, 'r')

ax1.set_xlabel('x')

ax1.set_ylabel('y')

ax1.set_title('title')

# inside axes1

left, bottom, widht, height = 0.2, 0.6, 0.25, 0.25

ax1 = fig.add_axes([left, bottom, widht, height])

ax1.plot(x, y, 'b')

ax1.set_xlabel('x')

ax1.set_ylabel('y')

ax1.set_title('title inside1')

# inside axes2

plt.axes([0.62, 0.2, 0.25, 0.25])

plt.plot(y[::-1], x, 'g')  # 默认跟着plt.axes

plt.xlabel('x')

plt.ylabel('y')

plt.title('title inside1')

plt.show()
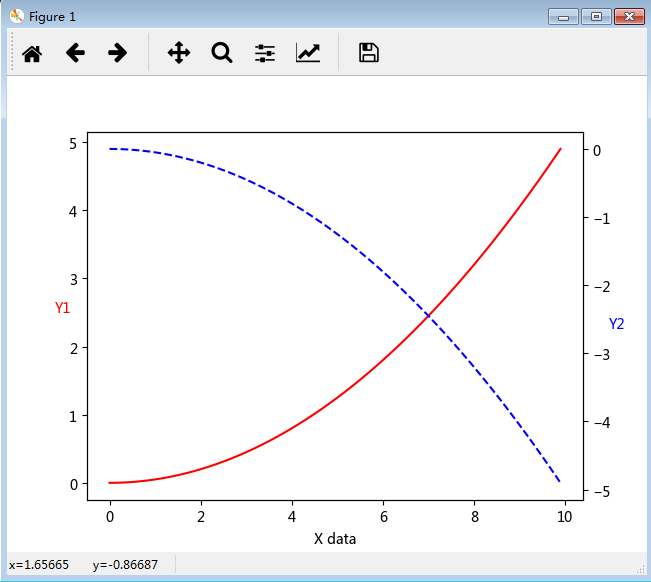
"""次坐标轴"""

import numpy as np

import matplotlib.pyplot as plt

x = np.arange(0, 10, 0.1)

y1 = 0.05*x**2

y2 = -1*y1

fig, ax1 = plt.subplots()

ax2 = ax1.twinx()  # Create a twin Axes sharing the xaxis 共用x轴

ax1.plot(x, y1, 'r-')

ax2.plot(x, y2, 'b--')

ax1.set_xlabel('X data')

ax1.set_ylabel('Y1', color='r', rotation='horizontal')

ax2.set_ylabel('Y2', color='b', rotation='horizontal')

plt.show()
"""动画"""

import numpy as np

import matplotlib.pyplot as plt

from matplotlib import animation

fig, ax = plt.subplots()

x = np.arange(0, 2*np.pi, 0.01)

line, = ax.plot(x, np.sin(x))

def animate(i):

    line.set_ydata(np.sin(x+i/10))

    return line,

def init():

    line.set_ydata(np.sin(x))

    return line,

ani = animation.FuncAnimation(fig=fig, func=animate, frames=100, init_func=init, interval=20, blit=True)

plt.show()
科学网—[转载]利用Python进行数据分析——绘图和可视化(八)(1) - 郭大龙的博文 http://blog.sciencenet.cn/blog-251664-800766.html
调整subplot周围的间距
默认情况下,matplotlib会在subplot外围留下一定的边距,并在subplot之间留下一定的间距。间距跟图像的高度和宽度有关,因此,如果你调整了图像的大小(不管是编程还是手工),间距也会自动调整。利用Figure的subplots_adjust方法可以轻而易举地修改间距,此外,它也是个顶级函数:
In [15]: subplots_adjust(left=None, bottom=None, right=None, top=None, wspace=None, hspace=None)
wspace和hspace用于控制宽度和高度的百分比,可以用作subplot之间的间距。下面是一个简单的例子,我们将间距收缩到了0:

不难看出,其中的轴标签重叠了。matplotlib不会检查标签是否重叠,所以对于这种情况,你只能自己设定刻度位置和刻度标签。
在线型图中,非实际数据点默认是按线性方式插值的。可以通过drawstyle选项修改:
In [18]: plt.plot(randn(30).cumsum(), 'ko--')
Out[18]: [<matplotlib.lines.Line2D at 0xb86924c>]
In [19]: data = randn(30).cumsum()
In [20]: plt.plot(data, 'k--', label='Default')
Out[20]: [<matplotlib.lines.Line2D at 0xba62c8c>]
In [21]: plt.plot(data, 'k--', drawstyle='steps-post', label='steps-post')
Out[21]: [<matplotlib.lines.Line2D at 0xba758ac>]
In [22]: plt.legend(loc='best')
Out[22]: <matplotlib.legend.Legend at 0xba75bcc>

matplotlib的一些代码的更多相关文章
- matplotlib 安装与使用
1.在ubuntu下输入 sudo apt-get install python-matplotlib 安装matplotlib 2.简单代码使用
- python中利用matplotlib绘图可视化知识归纳
python中利用matplotlib绘图可视化知识归纳: (1)matplotlib图标正常显示中文 import matplotlib.pyplot as plt plt.rcParams['fo ...
- matplotlib&numpy画图
import numpy as np import matplotlib.pyplot as plt x=np.linspace(0,6,100) y=np.cos(2*np.pi*x)*np.exp ...
- 使用python内置库matplotlib,实现折线图的绘制
环境准备: 需要安装matplotlib,安装方式: pip install matplotlib 直接贴代码喽: #引入模块 from matplotlib import pyplot,font_m ...
- Matplotlib 知识点整理
本文作为学习过程中对matplotlib一些常用知识点的整理,方便查找. 强烈推荐ipython 无论你工作在什么项目上,IPython都是值得推荐的.利用ipython --pylab,可以进入Py ...
- Python中的Numpy、SciPy、MatPlotLib安装与配置
Python安装完Numpy,SciPy和MatplotLib后,可以成为非常犀利的科研利器.网上关于这三个库的安装都写得非常不错,但是大部分人遇到的问题并不是如何安装,而是安装好后因为配置不当,在使 ...
- jupyter lab matplotlib 画图
解决jupyter lab plt.plot() 不画图的问题 import matplotlib.pyplot as plt %matplotlib inline #insert this c ...
- Python 绘图库Matplotlib入门教程
0 简单介绍 Matplotlib是一个Python语言的2D绘图库,它支持各种平台,并且功能强大,能够轻易绘制出各种专业的图像. 1 安装 pip install matplotlib 2 入门代码 ...
- matplotlib画图教程,设置坐标轴标签和间距
大家好,欢迎来到周四数据处理专题,我们今天继续matplotlib作图教程. 在上周的文章当中我们介绍了如何通过xlabel和ylabel设置坐标轴的名称,以及这两个函数的花式设置方法,可以设置出各种 ...
随机推荐
- java----内部类与匿名内部类的各种注意事项与知识点
Java 内部类分四种:成员内部类.局部内部类.静态内部类和匿名内部类.1.成员内部类: 即作为外部类的一个成员存在,与外部类的属性.方法并列.注意:成员内部类中不能定义静态变量,但可以访问外部类的所 ...
- 【BZOJ】1034: [ZJOI2008]泡泡堂BNB(贪心)
http://www.lydsy.com/JudgeOnline/problem.php?id=1034 弱的比弱的强就用,强的比强的强就用: 否则弱的和强的比. 输的情况就是2n-ans(b,a), ...
- FormData异步上传
1.代码片段一: ajaxUpload: function () { var url = this.$avatarForm.attr('action'), data = new FormData(th ...
- Spring RestTemplate post
MultiValueMap<String, Object> map = new LinkedMultiValueMap<>(); map.add("auditPara ...
- Hadoop1.2.1 的 “Hello world!”
下图是大概步骤: 下面是详细步骤,但我的代码跟上面有点不一样,但都是一个道理: 第一个程序测试 wordcount 先创建目录 hadoop fs -mkdir /wc hadoop fs -mkdi ...
- 在Eclipse中显示.project和.classpath和.setting目录
在Eclipse中显示.project, .classpath, .gitignore文件和.setting文件夹 在Eclipse中使用git,并显示.gitigonre文件,进行项目管理 在Ecl ...
- phpcms v9表单实现问答咨询功能
本文转自别人 phpcms v9的留言板插件可以安装留言板,做问答咨询,那样的话有很多东西需要修改,也有人发现phpcms v9有个表单向导功能,只能留言,不能回复,今天仿站网:新源网络工作室告诉大家 ...
- IOS 十位数0补齐
NSCalendar *calendar = [NSCalendar currentCalendar]; unsigned unitFlags = NSYearCalendarUnit | NSMon ...
- Excel单元格格式设置
工作中遇到一些小问题: 例如办公自动化里的如何设置单元格格式 此格式分为两种:一种是样式上的格式 比如边框 行距字体等 第二种为数据格式: 比如每次我输入1000的话自动变红或者加粗字体 office ...
- PAT 甲级 1025 PAT Ranking
1025. PAT Ranking (25) 时间限制 200 ms 内存限制 65536 kB 代码长度限制 16000 B 判题程序 Standard 作者 CHEN, Yue Programmi ...