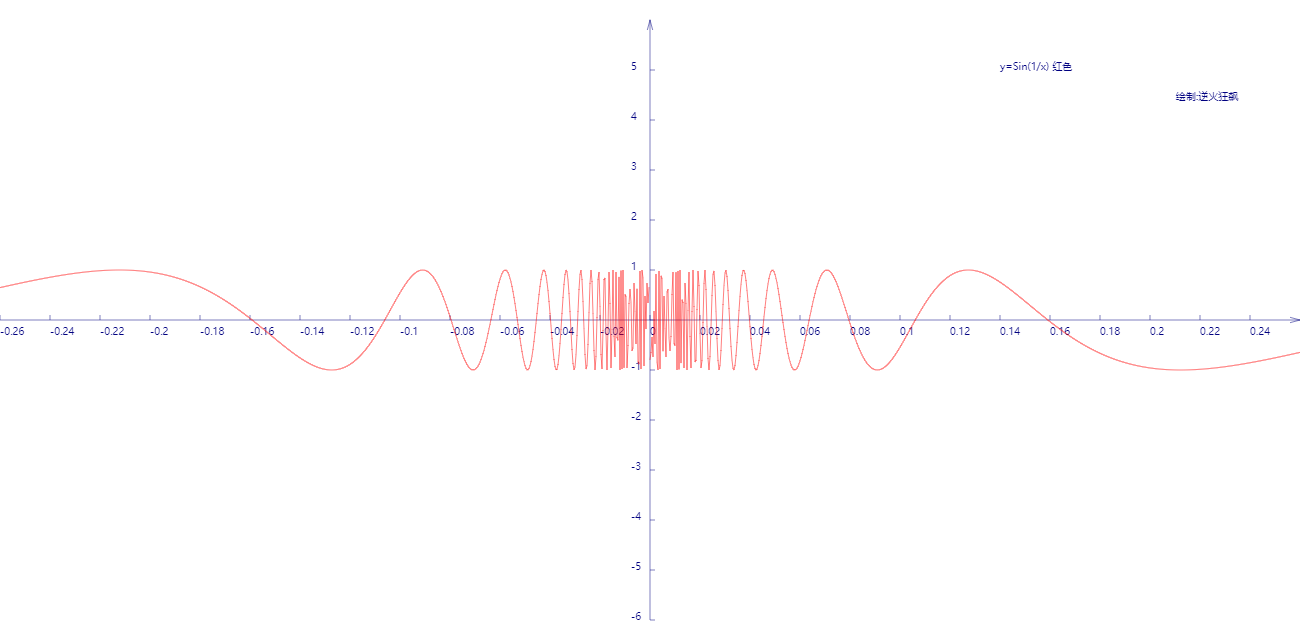
函数y=sin(1/x)曲线
该曲线在x趋近于零时振荡很剧烈,在远离零点时振荡越来越平缓。
图线:
代码:
<!DOCTYPE html>
<html lang="utf-8">
<meta http-equiv="Content-Type" content="text/html; charset=utf-8"/>
<head>
     <title>绘制曲线y=Sin(1/x)</title>
    </head>

     <body onload="draw()">
        <canvas id="myCanvus" width="1300px" height="640px" style="border:1px dashed black;">
            出现文字表示你的浏览器不支持HTML5
        </canvas>
     </body>
</html>
<script type="text/javascript">
<!--
    function draw(){
        var canvas=document.getElementById("myCanvus");
        var canvasWidth=1300;
        var canvasHeight=640;

        var context=canvas.getContext("2d");

        context.fillStyle = "white";
        context.fillRect(0, 0, canvasWidth, canvasHeight);

        context.strokeStyle = "black";
        context.fillStyle = "black";

        // 进行坐标变换:把原点放在左下角,东方为X轴正向,北方为Y轴正向
        var offsetY=320;// Y向偏移值,正值向上偏,用来画坐标轴
        var offsetX=650;// X向偏移值,正值向右偏,用来画坐标轴

        context.save();
        context.translate(0+offsetX,canvasHeight-offsetY);

        drawAxisXText(context);// 文字和线分开画比较好处理
        drawAxisYText(context);
        drawTitleText(context);

        context.rotate(getRad(180));
        context.scale(-1,1);

        drawAxisX(context);
        drawAxisY(context);
        drawCurve(context);

        context.restore();
    }

    function drawTitleText(ctx){
        ctx.lineWidth=0.5;
        ctx.strokeStyle='navy';
        ctx.fillStyle='navy';

        var x=350;
        var y=-250;

        // 写文字
        ctx.fillText("y=Sin(1/x) 红色",x,y);
        //ctx.fillText("y=(x-4)^4-1 绿色",x,y+20);
        //ctx.fillText("y=(x+4)^4+5(x+4)^2-1 黄色",x,y+40);
        //ctx.fillText("y=(x-7)^5 青柠色",x,y+60);
        //ctx.fillText("y=(x+3)^0.5 紫色",x,y+80);
        //ctx.fillText("y=(x+5)^0.33 栗色",x,y+100);

        ctx.fillText("  绘制:逆火狂飙",x+170,y+30);
    }

    function drawCurve(ctx){
        var cds=[{}];
        var cds1=[{}];
        var cds2=[{}];
        var cds3=[{}];
        var cds4=[{}];
        var cds5=[{}];
        var cds6=[{}];

        var x,y,arr;
        for(x=-13;x<=13;x+=0.0004){
            if(x<0){
                y=Math.sin(1/x);// x<0
                arr={"x":x,"y":y};
                cds.push(arr);
            }

            if(x>0){
                y=Math.sin(1/x);// x<0
                arr={"x":x,"y":y};
                cds1.push(arr);
            }

        }

        paintCurve(ctx,"red",cds);
        paintCurve(ctx,"red",cds1);
    }

    function paintCurve(ctx,color,cds){
        var SU=50;// Scale Unit

        ctx.strokeStyle = color;
        ctx.beginPath();
        for(var i=0; i<cds.length; i++){
            ctx.lineTo(cds[i].x*SU*SU,cds[i].y*SU);// 注意y轴比例
        }
        ctx.stroke();
        ctx.closePath();
    }

    function drawAxisX(ctx){
        ctx.save();

        ctx.lineWidth=0.5;
        ctx.strokeStyle='navy';
        ctx.fillStyle='navy';

        var start=-650;
        var end=650;

        // 画轴
        ctx.beginPath();
        ctx.moveTo(start, 0);
        ctx.lineTo(end, 0);
        ctx.stroke();
        ctx.closePath();

        // 画箭头
        ctx.beginPath();
        ctx.moveTo(end-Math.cos(getRad(15))*10, Math.sin(getRad(15))*10);
        ctx.lineTo(end, 0);
        ctx.lineTo(end-Math.cos(getRad(15))*10, -Math.sin(getRad(15))*10);
        ctx.stroke();
        ctx.closePath();

        // 画刻度
        var x,y;
        y=5;
        for(x=start;x<end;x+=50){
            ctx.beginPath();
            ctx.moveTo(x, 0);
            ctx.lineTo(x, y);

            ctx.stroke();
            ctx.closePath();
        }

        ctx.restore();
    }

    function drawAxisXText(ctx){
        ctx.lineWidth=0.5;
        ctx.strokeStyle='navy';
        ctx.fillStyle='navy';

        var start=-650;
        var end=650;

        // 写文字
        var x,y=5;
        for(x=start;x<end;x+=50){
            ctx.fillText(x/50/50,x,y+10);
        }
    }

    function drawAxisY(ctx){
        ctx.save();

        ctx.lineWidth=0.5;
        ctx.strokeStyle='navy';
        ctx.fillStyle='navy';

        var start=-300;
        var end=300;

        // 画轴
        ctx.beginPath();
        ctx.moveTo(0, start);
        ctx.lineTo(0, end);
        ctx.stroke();
        ctx.closePath();

        // 画箭头
        ctx.beginPath();
        ctx.moveTo(Math.sin(getRad(15))*10, end-Math.cos(getRad(15))*10);
        ctx.lineTo(0, end);
        ctx.lineTo(-Math.sin(getRad(15))*10, end-Math.cos(getRad(15))*10);
        ctx.stroke();
        ctx.closePath();

        // 画刻度
        var x,y;
        x=5;
        for(y=start;y<end;y+=50){// 注意y轴比例
            ctx.beginPath();
            ctx.moveTo(x, y);
            ctx.lineTo(0, y);

            ctx.stroke();
            ctx.closePath();
        }
    }

    function drawAxisYText(ctx){
        ctx.lineWidth=0.5;
        ctx.strokeStyle='navy';
        ctx.fillStyle='navy';

        var start=-250;
        var end=350;

        // 写文字
        var x=-19,y=5;
        for(y=start;y<end;y+=50){

            if(y!=0){
                ctx.fillText(-y/50,x,y);// 注意y轴比例
            }
        }
    }

    function getRad(degree){
        return degree/180*Math.PI;
    }

    function cutShort(str,length){
        if(str.length>length){
            str=str.substr(0,length)+"...";
        }

        return str;
    }
//-->
</script>
函数y=sin(1/x)曲线的更多相关文章
- 由函数$y=\sin x$的图像伸缩变换为函数$y=\sin(\omega x)$的图像(交互式)
可以拖动滑动条\(\omega\)显示动态效果
- 绘制函数 y=x^2-2x-3/2x^2+2x+1 的曲线
代码: <!DOCTYPE html> <html lang="utf-8"> <meta http-equiv="Content-Type ...
- 在笛卡尔坐标系上描绘函数 y=4x^2-2/4x-3
代码: <!DOCTYPE html> <html lang="utf-8"> <meta http-equiv="Content-Type ...
- [再寄小读者之数学篇](2014-11-19 $\sin(x+y)=\sin x\cos y+\cos x\sin y$)
$$\bex \sin(x+y)=\sin x\cos y+\cos x\sin y. \eex$$ Ref. [Proof Without Words: Sine Sum Identity, The ...
- 使用神经网络来拟合函数y = x^3 +b
我们使用一个三层的小网络来,模拟函数y = x^3+b函数 import tensorflow as tf import numpy as np import matplotlib.pyplot as ...
- PSO:利用PSO+ω参数实现对一元函数y = sin(10*pi*x) ./ x进行求解优化,找到最优个体适应度—Jason niu
x = 1:0.01:2; y = sin(10*pi*x) ./ x; figure plot(x, y) title('绘制目标函数曲线图—Jason niu'); hold on c1 = 1. ...
- PSO:利用PSO实现对一元函数y = sin(10*pi*x) ./ x进行求解优化,找到最优个体适应度—Jason niu
x = 1:0.01:2; y = sin(10*pi*x) ./ x; figure plot(x, y) title('绘制目标函数曲线图—Jason niu'); hold on c1 = 1. ...
- 函数 y=x^x的分析
关于函数 y=xx的分析: 由图像得,y在负无穷大到0图像处处不连续,故y的定义域为(0,正无穷大): 故该函数不就是y=e^(lnxx)吗? 1.定义域:我们变形一下,y=e^(xlnx),显然是0 ...
- 2、函数y=f(x)
/* Note:Your choice is C IDE */ #include "stdio.h" /* 3.函数y=f(x)可表示为: */ void main() { int ...
随机推荐
- 【记录】mysql 无法启动 : NET HELPMSG 3523
mysql 无法启动 : NET HELPMSG 3523后来注意到mysql 配置文件的格式是 utf-8 还是有bom的utf-8 bom格式前面会多出一些看不见的字符,所以mysql读取配置文件 ...
- Java导出数据生成Excel表格
事先准备: 工具类: package com.wazn.learn.util.export; import java.sql.Connection; import java.sql.DriverMan ...
- serializable parcelable
韩梦飞沙 韩亚飞 313134555@qq.com yue31313 han_meng_fei_sha 在使用 内存的 时候,parcelable 比 serializable 性能高. pa ...
- BZOJ3238 [Ahoi2013]差异 SA+单调栈
题面 戳这里 题解 考虑把要求的那个东西拆开算,前面一个东西像想怎么算怎么算,后面那个东西在建出\(height\)数组后相当于是求所有区间\(min\)的和*2,单调栈维护一波即可. #includ ...
- 如何解决The underlying provider failed on Open问题
转自codeproject,找了半天解决办法,这个最靠谱. 我数据库用的EF做ORM,在vs里面测试的时候不会出现这个错误,用IIS就出错了.解决方法如下 Solution for "The ...
- 设计模式 -- 桥接模式(Bridge)
写在前面的话:读书破万卷,编码如有神--------------------------------------------------------------------主要内容包括: 初始桥接模式 ...
- CentOS6永久修改主机名称
1.修改network vi /etc/sysconfig/network 修改HOSTNAME值 2.修改hosts vi /etc/hosts 修改中间的那个localhost 3.使用hostn ...
- 树莓派(Debian)系统开启iptables的raw表实现日志输出
说明:可能Debian默认不开启iptables的raw表,所以无法通过其实现日志跟踪. 日志跟踪:http://www.cnblogs.com/EasonJim/p/8413563.html 解决方 ...
- ALAssetsLibrary使用
在iOS中,我们调用摄像头和选择相册中的资源,我们可以使用:UIImagePickerController类来完成. 当然,我们也可以不使用UI的形式来访问iOS设备的相册资源. 那就是使用:AL ...
- cherokee +php fastcgi 出现 No input file specified 故障一例
在arch上编译cherokee 时用的--with-wwwroot=/srv/http.在建立虚拟服务器时,只要虚拟服务器的根目录位于/srv/http下,php页面都能正确运行.但只要将拟服务器的 ...