numpy.meshgrid()理解
本文的目的是记录meshgrid()的理解过程:
step1. 通过一个示例引入创建网格点矩阵;
step2. 基于步骤1,说明meshgrid()的作用;
step3. 详细解读meshgrid()的官网定义;
说明:step1和2 的数据都是基于笛卡尔坐标系的矩阵,目的是为了方便讨论。
step1. 通过一个示例引入创建网格点矩阵;
示例1,创建一个2行3列的网格点矩阵。
 #!/usr/bin/env python3

 #-*- coding:utf-8 -*-

 ############################

 #File Name: meshgrid1.py

 #Brief:

 #Author: frank

 #Mail: frank0903@aliyun.com

 #Created Time:2018-06-14 21:33:14

 ############################

 import numpy as np

 import matplotlib.pyplot as plt

 X = np.array([[0, 0.5, 1],[0, 0.5, 1]])

 print("X的维度:{},shape:{}".format(X.ndim, X.shape))

 Y = np.array([[0, 0, 0],[1, 1, 1]])

 print("Y的维度:{},shape:{}".format(Y.ndim, Y.shape))

 plt.plot(X, Y, 'o--')

 plt.grid(True)

 plt.show()
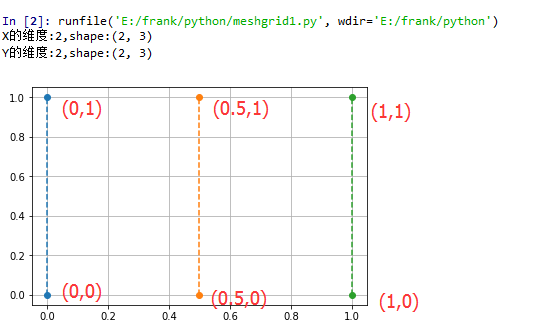
X矩阵是:[[0. 0.5 1. ], [0. 0.5 1. ]]
Y矩阵是:[[0 0 0],[1 1 1]]
step2. meshgrid()的作用;
当要描绘的 矩阵网格点的数据量小的时候,可以用上述方法构造网格点坐标数据;
但是如果是一个(256, 100)的整数矩阵网格,要怎样构造数据呢?
方法1:将x轴上的100个整数点组成的行向量,重复256次,构成shape(256,100)的X矩阵;将y轴上的256个整数点组成列向量,重复100次构成shape(256,100)的Y矩阵
显然方法1的数据构造过程很繁琐,也不方便调用,那么有没有更好的办法呢?of course!!!
那么meshgrid()就显示出它的作用了
使用meshgrid方法,你只需要构造一个表示x轴上的坐标的向量和一个表示y轴上的坐标的向量;然后作为参数给到meshgrid(),该函数就会返回相应维度的两个矩阵;
例如,你想构造一个2行3列的矩阵网格点,那么x生成一个shape(3,)的向量,y生成一个shape(2,)的向量,将x,y传入meshgrid(),最后返回的X,Y矩阵的shape(2,3)
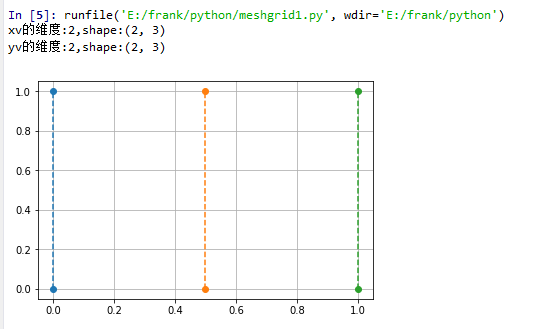
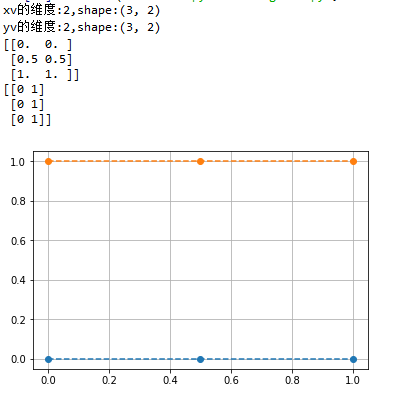
示例2,使用meshgrid()生成step1中的网格点矩阵
 x = np.array([0, 0.5, 1])

 y = np.array([0,1])

 xv,yv = np.meshgrid(x, y)

 print("xv的维度:{},shape:{}".format(xv.ndim, xv.shape))

 print("yv的维度:{},shape:{}".format(yv.ndim, yv.shape))

 plt.plot(xv, yv, 'o--')

 plt.grid(True)

 plt.show()
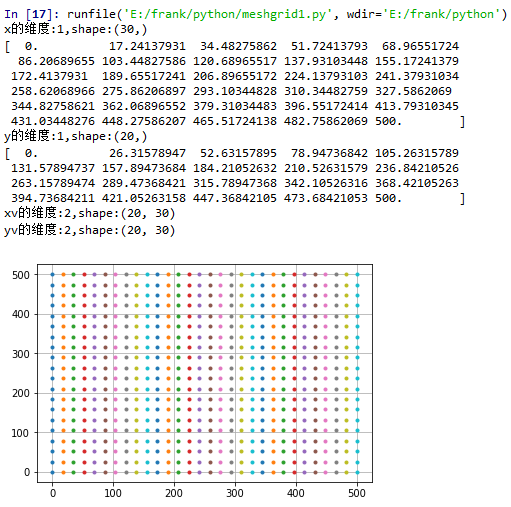
示例3,生成一个20行30列的网格点矩阵
 x = np.linspace(0,500,30)

 print("x的维度:{},shape:{}".format(x.ndim, x.shape))

 print(x)

 y = np.linspace(0,500,20)

 print("y的维度:{},shape:{}".format(y.ndim, y.shape))

 print(y)

 xv,yv = np.meshgrid(x, y)

 print("xv的维度:{},shape:{}".format(xv.ndim, xv.shape))

 print("yv的维度:{},shape:{}".format(yv.ndim, yv.shape))

 plt.plot(xv, yv, '.')

 plt.grid(True)

 plt.show()
step3. 详细解读meshgrid()的官网定义;
numpy.meshgrid(*xi, **kwargs)
Return coordinate matrices from coordinate vectors.
根据输入的坐标向量生成对应的坐标矩阵
Parameters:
x1, x2,…, xn : array_like
1-D arrays representing the coordinates of a grid.
indexing : {‘xy’, ‘ij’}, optional
Cartesian (‘xy’, default) or matrix (‘ij’) indexing of output. See Notes for more details.
sparse : bool, optional
If True a sparse grid is returned in order to conserve memory. Default is False.
copy : bool, optional
If False, a view into the original arrays are returned in order to conserve memory.
Default is True. Please note that sparse=False, copy=False will likely return non-contiguous arrays.
Furthermore, more than one element of a broadcast array may refer to a single memory location.
If you need to write to the arrays, make copies first.
Returns:
X1, X2,…, XN : ndarray
For vectors x1, x2,…, ‘xn’ with lengths Ni=len(xi) ,
return (N1, N2, N3,...Nn) shaped arrays if indexing=’ij’
or (N2, N1, N3,...Nn) shaped arrays if indexing=’xy’
with the elements of xi repeated to fill the matrix along the first dimension for x1, the second for x2 and so on.
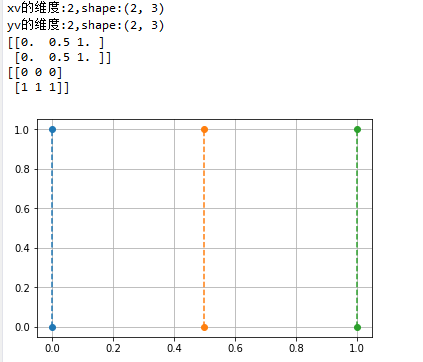
针对indexing参数的说明:
indexing只是影响meshgrid()函数返回的矩阵的表示形式,但并不影响坐标点
 x = np.array([0, 0.5, 1])

 y = np.array([0,1])

 xv,yv = np.meshgrid(x, y)

 print("xv的维度:{},shape:{}".format(xv.ndim, xv.shape))

 print("yv的维度:{},shape:{}".format(yv.ndim, yv.shape))

 print(xv)

 print(yv)

 plt.plot(xv, yv, 'o--')

 plt.grid(True)

 plt.show()
 x = np.array([0, 0.5, 1])

 y = np.array([0,1])

 xv,yv = np.meshgrid(x, y,indexing='ij')

 print("xv的维度:{},shape:{}".format(xv.ndim, xv.shape))

 print("yv的维度:{},shape:{}".format(yv.ndim, yv.shape))

 print(xv)

 print(yv)

 plt.plot(xv, yv, 'o--')

 plt.grid(True)

 plt.show()
numpy.meshgrid()理解的更多相关文章
- 对numpy.meshgrid()理解
一句话解释numpy.meshgrid()——生成网格点坐标矩阵.关键词:网格点,坐标矩阵 网格点是什么?坐标矩阵又是什么鬼?看个图就明白了: 图中,每个交叉点都是网格点,描述这些网格点的坐标的矩阵, ...
- numpy.meshgrid()
numpy提供的numpy.meshgrid()函数可以让我们快速生成坐标矩阵X,Y 语法:X,Y = numpy.meshgrid(x, y)输入:x,y,就是网格点的横纵坐标列向量(非矩阵)输出: ...
- numpy meshgrid 和 mgrid 的两个简单实例和解析
numpy.meshgrid 和 numpy.mgrid 用于返回包含坐标向量的坐标矩阵. 当坐标矩阵为二维时, 可用于在图像变形时构建网格. 实例一 from __future__ import p ...
- numpy.meshgrid的理解以及3D曲面图绘制(梯度下降法实现过程)
相关概念: 1.x向量和y向量 import numpy as np import matplotlib.pyplot as plt x = np.array([[0,1,2,3], [0,0,0,0 ...
- numpy meshgrid函数
1.meshgrid函数用两个坐标轴上的点在平面上画格. 用法: [X,Y]=meshgrid(x,y) [X,Y]=meshgrid(x)与[X,Y]=meshgrid(x,x)是等同的 [X, ...
- NumPy之:理解广播
目录 简介 基础广播 广播规则 简介 广播描述的是NumPy如何计算不同形状的数组之间的运算.如果是较大的矩阵和较小的矩阵进行运算的话,较小的矩阵就会被广播,从而保证运算的正确进行. 本文将会以具体的 ...
- numpy深入理解剖析
http://www.scipy-lectures.org/advanced/advanced_numpy/index.html
- 《利用Python进行数据分析·第2版》第四章 Numpy基础:数组和矢量计算
<利用Python进行数据分析·第2版>第四章 Numpy基础:数组和矢量计算 numpy高效处理大数组的数据原因: numpy是在一个连续的内存块中存储数据,独立于其他python内置对 ...
- Numpy应用100问
对于从事机器学习的人,python+numpy+scipy+matplotlib是重要的基础:它们基本与matlab相同,而其中最重要的当属numpy:因此,这里列出100个关于numpy函数的问题, ...
随机推荐
- jquery避免跟其他库冲突
方法一: var $j=JQuery.noConflict(); $j('#msg').hide();//此处$j就代表JQuery 方法二: JQuery.noConflict(); JQuery( ...
- jquery的一次点击实现
1.项目中需要实现一个需求,第一个点击的时候允许弹出dialog对象框,第二次不允许,除非重新刷新页面 2.在js的click事件中定义一个标签属性:相当于设置一个全局变量 var auclot= ' ...
- Openshift部署Zookeeper和Kafka
部署Zookeeper github网址 https://github.com/ericnie2015/zookeeper-k8s-openshift 1.在openshift目录中,首先构建imag ...
- iOS: 设置App的国际化和本地化
原文链接:http://www.cocoachina.com/appstore/20160310/15632.html 前言 App的名字设置方式有很多种,如果在App打包上线时不做修改,最终App的 ...
- Delphi 对象模型学习笔记(转)
摘要 Borland Object Pascal 对象模型(现在已经正是命名为 Delphi 语言)与其他 OOP 语言一样,都提供了一些基础服务: 如对象创建服务.对象释放服务.对象识别服务 ...
- 【转载】Java NIO学习 & NIO BIO AIO 比较
可以参考这个页面: http://www.iteye.com/magazines/132-Java-NIO (下面这个页面也有) http://ifeve.com/overview/ 另,在这篇文章里 ...
- vue组件属性中字符串如何拼接变量?
不得不说,对于水平只有jquery的vue初学者来说,vue的图片加载实现确实挺坑的,在文档中也没有看到说明.经过百度之后终于知道了什么情况. 首先: 这样是没问题的: <img src=&qu ...
- Linux下好用的命令
split -l 10000 articles.json 将文件按行分成多个文件
- Hadoop系统通信协议介绍(转)
转载自 ---- http://weilaiyxj.iteye.com/blog/913166 本文约定: DN: DataNode TT: TaskTracker NN: NameNode SNN: ...
- vpngate 的使用
第一次为小日本打广告.. .我仅仅想仰天大喊..玛的戈壁. .. 竟然活到这个份上了...想出去看看的往下看.. vpngate 下载: http://pan.baidu.com/s/1hq5x3Ly ...