linux平均负载的理解及原因排查
当系统响应缓慢时,一般会用top或uptime命令查看系统负载是否过高。 例如输入uptime命令显示如下图,其中23:47:19表示现在的时间,up 260 days,14:39表示系统运行了多久,1 user表示当前登录用户数,最重要的是 load average,有三个数值,分别表示过去1分钟、5分钟、15分钟系统的负载。系统负载的英文解释为:
System load averages is the average number of processes that are either in a runnable or uninterruptable state. A process in a runnable state is either using the CPU or waiting to use the CPU. A
process in uninterruptable state is waiting for some I/O access, eg waiting for disk. The averages are taken over the three time intervals. Load averages are not normalized for the number of
CPUs in a system, so a load average of 1 means a single CPU system is loaded all the time while on a 4 CPU system it means it was idle 75% of the time.
系统负载表示每分钟处于可运行状态(运行态和就绪态)以及不可中断状态(等待io)的进程数目,且没有做归一化处理。

图1 uptime命令显示图
当平均负载等于CPU核数时是比较合理的状态,不会存在进程等待且也不会有CPU空闲浪费,查看CPU核数的命令如下:
grep 'model name' /proc/cpuinfo | wc -l
uptime命令过去1分钟,5分钟,15分钟的负载隐含了系统负载的变化趋势,假如这三个指标的值差不多,说明系统比较稳定,假如过去1分钟的负载比过去15分钟大很多,说明系统负载在增加,反之,则说明负载在减小。
平均负载和CPU使用率不是一个概念,平均负载高不能说明CPU使用率高,因为平均负载除了包括正在使用CPU的进程,还包括在等待CPU的进程和等待io的进程。
CPU使用率表示单位时间CPU的利用情况,CPU使用率和平均负载的关系有三个场景:
- CPU密集型进程,大量使用CPU会使CPU利用率和平均负载都增高。
- IO密集型进程,会使平均负载增高但CPU使用率不一定会增高。
- 大量等待CPU的进程调度会使平均负载增高,CPU使用率也会增高
可使用stress模拟这三种情况,stress为linux下的压测工具,并用mpstat和pidstat查看根源,mpstat显示CPU的使用情况,pidstat监视linux任务的统计信息,安装如下:
yum install stress sysstat
stress命令常用参数如下:
-c, --cpu N
spawn N workers spinning on sqrt()
-i, --io N
spawn N workers spinning on sync()
-t, --timeout N
timeout after N seconds
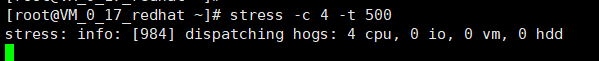
1.用stress模拟CPU密集型进程

用uptime查看负载

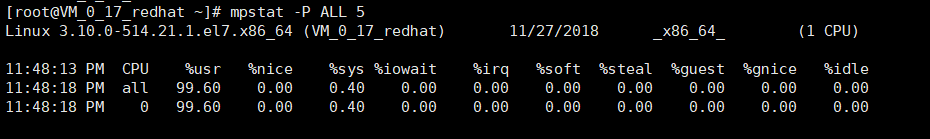
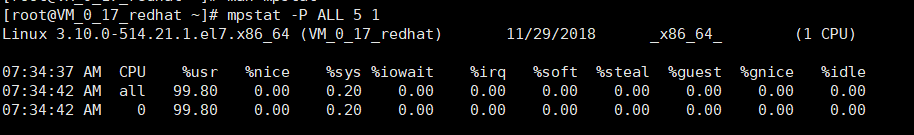
用mpstat查看CPU使用情况,如下,其中-P的含义为
-P { cpu [,...] | ON | ALL }
Indicate the processor number for which statistics are to be reported. cpu is the processor number. Note that processor 0 is the first processor. The ON keyword indicates that statistics
are to be reported for every online processor, whereas the ALL keyword indicates that statistics are to be reported for all processors.表示显示哪个处理器的使用情况. 5表示统计间隔为5s
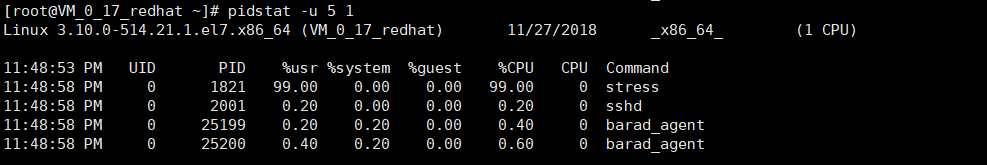
可以看到CPU使用率很高,pidstat查看具体占用CPU的进程,进程stress占的CPU达到99%,-u的含义为Report CPU utilization,5表示间隔5秒,1表示输出一组数据就停止,假如不加1,则会一直输出。
2.stress模拟io密集型进程

uptime查看负载,可以看到负载已经很高(单核CPU)

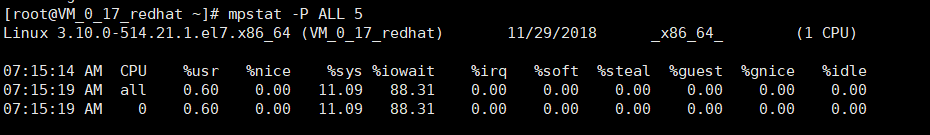
mpstat查看负载升高原因,可以看到CPU0的iowait高达88.31%,说明CPU有大量的时间在等待磁盘io,负载是由io进程导致,iowait含义:%iowait
Show the percentage of time that the CPU or CPUs were idle during which the system had an outstanding disk I/O request.
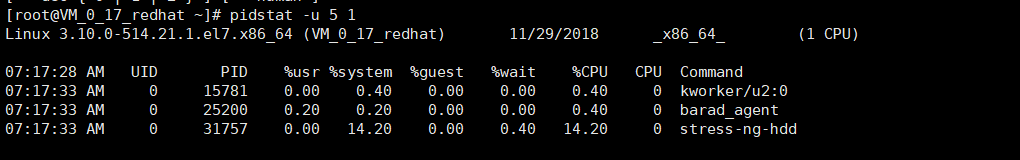
定位具体的进程,可以看到是stress-ng-hdd,wait含义
Percentage of CPU spent by the task while waiting to run.
3.stress模拟大量进程场景
uptime查看负载

mpstat可以看到CPU利用率已经很高
pidstat查看每个进程的CPU使用情况,四个stress进程均在有较高的百分比在等待CPU(%wait)

当uptime负载较高时,可能是CPU使用率较高,也可能是io进程较多,可以用mpstat查看CPU使用情况,并用pidstat查看定位具体进程
linux平均负载的理解及原因排查的更多相关文章
- linux 平均负载 load average 的含义【转】
文章来源: linux 平均负载 load average 的含义 load average 的含义 平均负载(load average)是指系统的运行队列的平均利用率,也可以认为是可运行进程的平均数 ...
- Linux性能调优 | 01 平均负载的理解和分析
01 uptime命令 通常我们发现系统变慢时,我们都会执行top或者uptime命令,来查看当前系统的负载情况,比如像下面,我执行了uptime,系统返回的了结果. [root@lincoding ...
- linux 平均负载 load average 的含义
load average 的含义 平均负载(load average)是指系统的运行队列的平均利用率,也可以认为是可运行进程的平均数. 以路况为例, 单核CPU.单车道 情况如下: 0.00-1. ...
- Linux系统中到底应该怎么理解系统的平均负载
02 | 基础篇:到底应该怎么理解“平均负载”? 每次发现系统变慢时,我们通常做的第一件事,就是执行 top 或者 uptime 命令,来了解系统的负载情况.比如像下面这样,我在命令行里输入了 upt ...
- 1 理解Linux系统的“平均负载”
什么是平均负载 我们知道使用top或uptime可以用来了解系统的负载情况. uptime 2 02:34:03 up 2 days, 20:14, 1 user, load average: 0.6 ...
- Linux性能优化实战:到底应该怎样理解平均负载(02)
一.平均负载与CPU使用率并没有直接关系 1.平均负载 单位时间内,系统处于可运行状态和不可终端状态的平均进程数也就是平均活跃进程数,它和cpu使用率并没有直接关系, 可运行状态: 正在使用的cpu或 ...
- 理解 Linux 的平均负载和性能监控
在本文中,我们将解释 Linux 系统中最关键的管理任务之一——关于系统 / CPU 的负载load和平均负载Load average的性能监控. 首先来看所有的类 UNIX 系统中两个重要的表述 ...
- linux之平均负载(学习笔记非原创)
什么是平均负载 [root@111 ~]# uptime 11:03:33 up 149 days, 17:34, 1 user, load average: 0.08, 0.05, 0.01 最后三 ...
- 理解 uptime 的:“平均负载”? 如何模拟测试
每次发现系统变慢时,我们通常做的第一件事,就是执行 top 或者 uptime 命令,来了解系统的负载情况.比如像下面这样,我在命令行里输入了 uptime 命令,系统也随即给出了结果. [root@ ...
随机推荐
- Kinfu配置指南
Kinfu配置指南 欢迎加入Kinfu讨论群:563741937 写给准备配置pcl-kinfu的同学,这个是我的配置方法,已经能用的请无视. 我的配置:Windows7,VS2010(用这个的是不是 ...
- Java Web服务器的联机交易
我们知道服务器可以对外部的请求进行应答 ,在BS架构中,通过浏览器可以向Apache Tomcat或者WebSphere服务器发送请求.但是可能存在请求的渠道不是浏览器的情况,他有可能是另外一个jav ...
- Exp3 免杀原理与实践 20154320 李超
基础知识 如何检测出恶意代码 基于特征码的检测:分析指令的统计特性.代码的结构特性等.如果一个可执行文件(或其他运行的库.脚本等)拥有一般恶意代码所通有的特征(开启后门等)则被认为是恶意代码 启发式恶 ...
- JS 控制输入框输入表情emoji 显示在页面上
问题描述: 最近做一个评论回复的功能遇到了用户输入框输入表情,存入数据库的时候转变成了问号??? 起初为了避免这个问题,做了一个过滤表情的控制 var inputText = $('#pinglun' ...
- TCP的客户端搭建
一.设计目标 之前已经写过了TCP服务器原理及通过visual studio 验证 SOCKET编程:搭建一个TCP服务器,这里我们搭建一个TCP客户端界面并对各功能进行实现.设计效果如下: 二.实验 ...
- SecureCRT使用帮助
文件上传下载 1. 安装 yum -y install lrzsz (参数-y中"y"的意思是:当安装过程提示选择全部为"yes") 2.上传 第一种方式:rz ...
- Python序列结构--字典
字典:反映对应关系的映射类型 字典(dict)是包含若干“键:值”元素的无序可变序列 字典中元素的“键”可以是python中任意不可变数据,例如整数.实数.复数.字符串.元组等类型可哈希数据,“键”不 ...
- FPGA中带优先级的if else if与不带优先级的case的探讨
我们知道在书本上都说让我们尽量使用不带优先级的的数据选择器,今天我们就来探讨一下二者的区别. 例子1:带优先级的的数据选择器,综合成功,且没有任何警告. module detection_prio # ...
- HAProxy详细中文用法详解
一.HAProxy简介 (1)HAProxy 是一款提供高可用性.负载均衡以及基于TCP(第四层)和HTTP(第七层)应用的代理软件,支持虚拟主机,它是免费.快速并且可靠的一种解决方案. HAProx ...
- Gson centos日期转换失败
https://4aiur.github.io/2018/03/26/gson-dateformat-pattern/ 问题描述: 线上的日志里报了一个JsonSyntaxException的异常: ...