转自: http://aredko.blogspot.com/2014/02/knowing-how-all-your-components-work.html
In today's post we will try to cover very interesting and important topic: distributed system tracing. What it practically means is that we will try to trace the request from the point it was issued by the client to the point the response to this request was received. At first, it looks quite straightforward but in reality it may involve many calls to several other systems, databases, NoSQL stores, caches, you name it ...
In 2010 Google published a paper about Dapper, a large-scale distributed systems tracing infrastructure (very interesting reading by the way). Later on, Twitter built its own implementation based on Dapper paper, called Zipkin and that's the one we are going to look at.
We will build a simple JAX-RS 2.0 server using great Apache CXF library. For the client side, we will use JAX-RS 2.0 client API and by utilizing Zipkin we will trace all the interactions between the client and the server (as well as everything happening on server side). To make an example a bit more illustrative, we will pretend that server uses some kind of database to retrieve the data. Our code will be a mix of pure Java and a bit of Scala (the choice of Scala will be cleared up soon).
One additional dependency in order for Zipkin to work is Apache Zookeeper. It is required for coordination and should be started in advance. Luckily, it is very easy to do:
Now back to Zipkin. Zipkin is written in Scala. It is still in active development and the best way to start off with it is just by cloning its GitHub repository and build it from sources:
git clone https://github.com/twitter/zipkin.git
From architectural prospective, Zipkin consists of three main components:
- collector: collects traces across the system
- query: queries collected traces
- web: provides web-based UI to show the traces
To run them, Zipkin guys provide useful scripts in the bin folder with the only requirement that JDK 1.7 should be installed:
- bin/collector
- bin/query
- bin/web
Let's execute these scripts and ensure that every component has been started successfully, with no stack traces on the console (for curious readers, I was not able to make Zipkin work on Windows so I assume we are running it on Linux box). By default,Zipkin web UI is available on port 8080. The storage for traces is embedded SQLite engine. Though it works, the better storages (like awesome Redis) are available.
The preparation is over, let's do some code. We will start with JAX-RS 2.0 client part as it's very straightforward (ClientStarter.java):
01 |
package com.example.client; |
03 |
import javax.ws.rs.client.Client; |
04 |
import javax.ws.rs.client.ClientBuilder; |
05 |
import javax.ws.rs.core.MediaType; |
06 |
import javax.ws.rs.core.Response; |
08 |
import com.example.zipkin.Zipkin; |
09 |
import com.example.zipkin.client.ZipkinRequestFilter; |
10 |
import com.example.zipkin.client.ZipkinResponseFilter; |
12 |
public class ClientStarter { |
13 |
public static void main( final String[] args ) throws Exception { |
14 |
final Client client = ClientBuilder |
16 |
.register( new ZipkinRequestFilter( "People", Zipkin.tracer() ), 1 ) |
17 |
.register( new ZipkinResponseFilter( "People", Zipkin.tracer() ), 1 ); |
19 |
final Response response = client |
21 |
.request( MediaType.APPLICATION_JSON ) |
24 |
if( response.getStatus() == 200 ) { |
25 |
System.out.println( response.readEntity( String.class ) ); |
31 |
// Small delay to allow tracer to send the trace over the wire |
Except a couple of imports and classes with Zipkin in it, everything should look simple. So what those ZipkinRequestFilter andZipkinResponseFilter are for? Zipkin is awesome but it's not a magical tool. In order to trace any request in distributed system, there should be some context passed along with it. In REST/HTTP world, it's usually request/response headers. Let's take a look on ZipkinRequestFilter first (ZipkinRequestFilter.scala):
01 |
package com.example.zipkin.client |
03 |
import javax.ws.rs.client.ClientRequestFilter |
04 |
import javax.ws.rs.ext.Provider |
05 |
import javax.ws.rs.client.ClientRequestContext |
06 |
import com.twitter.finagle.http.HttpTracing |
07 |
import com.twitter.finagle.tracing.Trace |
08 |
import com.twitter.finagle.tracing.Annotation |
09 |
import com.twitter.finagle.tracing.TraceId |
10 |
import com.twitter.finagle.tracing.Tracer |
13 |
class ZipkinRequestFilter( val name: String, val tracer: Tracer ) extendsClientRequestFilter { |
14 |
def filter( requestContext: ClientRequestContext ): Unit = { |
15 |
Trace.pushTracerAndSetNextId( tracer, true ) |
17 |
requestContext.getHeaders().add( HttpTracing.Header.TraceId, Trace.id.traceId.toString ) |
18 |
requestContext.getHeaders().add( HttpTracing.Header.SpanId, Trace.id.spanId.toString ) |
20 |
Trace.id._parentId foreach { id => |
21 |
requestContext.getHeaders().add( HttpTracing.Header.ParentSpanId, id.toString ) |
24 |
Trace.id.sampled foreach { sampled => |
25 |
requestContext.getHeaders().add( HttpTracing.Header.Sampled, sampled.toString ) |
28 |
requestContext.getHeaders().add( HttpTracing.Header.Flags, Trace.id.flags.toLong.toString ) |
30 |
if( Trace.isActivelyTracing ) { |
31 |
Trace.recordRpcname( name, requestContext.getMethod() ) |
32 |
Trace.recordBinary( "http.uri", requestContext.getUri().toString() ) |
33 |
Trace.record( Annotation.ClientSend() ) |
A bit of Zipkin internals will make this code superclear. The central part of Zipkin API is Trace class. Every time we would like to initiate tracing, we should have a Trace Id and the tracer to actually trace it. This single line generates new Trace Id and register the tracer (internally this data is held in thread local state).
1 |
Trace.pushTracerAndSetNextId( tracer, true ) |
Traces are hierarchical by nature, so do Trace Ids: every Trace Id could be a root or part of another trace. In our example, we know for sure that we are the first and as such the root of the trace. Later on the Trace Id is wrapped into HTTP headers and will be passed along the request (we will see on server side how it is being used). The last three lines associate the useful information with the trace: name of our API (People), HTTP method, URI and most importantly, that it's the client sending the request to the server.
1 |
Trace.recordRpcname( name, requestContext.getMethod() ) |
2 |
Trace.recordBinary( "http.uri", requestContext.getUri().toString() ) |
3 |
Trace.record( Annotation.ClientSend() ) |
The ZipkinResponseFilter does the reverse to ZipkinRequestFilter and extract the Trace Id from the request headers (ZipkinResponseFilter.scala):
01 |
package com.example.zipkin.client |
03 |
import javax.ws.rs.client.ClientResponseFilter |
04 |
import javax.ws.rs.client.ClientRequestContext |
05 |
import javax.ws.rs.client.ClientResponseContext |
06 |
import javax.ws.rs.ext.Provider |
07 |
import com.twitter.finagle.tracing.Trace |
08 |
import com.twitter.finagle.tracing.Annotation |
09 |
import com.twitter.finagle.tracing.SpanId |
10 |
import com.twitter.finagle.http.HttpTracing |
11 |
import com.twitter.finagle.tracing.TraceId |
12 |
import com.twitter.finagle.tracing.Flags |
13 |
import com.twitter.finagle.tracing.Tracer |
16 |
class ZipkinResponseFilter( val name: String, val tracer: Tracer ) extendsClientResponseFilter { |
17 |
def filter( requestContext: ClientRequestContext, responseContext: ClientResponseContext ): Unit = { |
18 |
val spanId = SpanId.fromString( requestContext.getHeaders().getFirst( HttpTracing.Header.SpanId ).toString() ) |
20 |
spanId foreach { sid => |
21 |
val traceId = SpanId.fromString( requestContext.getHeaders().getFirst( HttpTracing.Header.TraceId ).toString() ) |
23 |
val parentSpanId = requestContext.getHeaders().getFirst( HttpTracing.Header.ParentSpanId ) match { |
24 |
case s: String => SpanId.fromString( s.toString() ) |
28 |
val sampled = requestContext.getHeaders().getFirst( HttpTracing.Header.Sampled ) match { |
29 |
case s: String => s.toString.toBoolean |
33 |
val flags = Flags( requestContext.getHeaders().getFirst( HttpTracing.Header.Flags ).toString.toLong ) |
34 |
Trace.setId( TraceId( traceId, parentSpanId, sid, Option( sampled ), flags ) ) |
37 |
if( Trace.isActivelyTracing ) { |
38 |
Trace.record( Annotation.ClientRecv() ) |
Strictly speaking, in our example it's not necessary to extract the Trace Id from the request because both filters should be executed by the single thread. But the last line is very important: it marks the end of our trace by saying that client has received the response.
1 |
Trace.record( Annotation.ClientRecv() ) |
What's left is actually the tracer itself (Zipkin.scala):
01 |
package com.example.zipkin |
03 |
import com.twitter.finagle.stats.DefaultStatsReceiver |
04 |
import com.twitter.finagle.zipkin.thrift.ZipkinTracer |
05 |
import com.twitter.finagle.tracing.Trace |
06 |
import javax.ws.rs.ext.Provider |
09 |
lazy val tracer = ZipkinTracer.mk( host = "localhost", port = 9410, DefaultStatsReceiver, 1 ) |
If at this point you are confused what all those traces and spans mean please look through this documentation page, you will get the basic understanding of those concepts.
At this point, there is nothing left on the client side and we are good to move to the server side. Our JAX-RS 2.0 server will expose the single endpoint (PeopleRestService.java):
01 |
package com.example.server.rs; |
03 |
import java.util.Arrays; |
04 |
import java.util.Collection; |
05 |
import java.util.concurrent.Callable; |
07 |
import javax.ws.rs.GET; |
08 |
import javax.ws.rs.Path; |
09 |
import javax.ws.rs.Produces; |
11 |
import com.example.model.Person; |
12 |
import com.example.zipkin.Zipkin; |
15 |
public class PeopleRestService { |
16 |
@Produces( { "application/json" } ) |
18 |
public Collection< Person > getPeople() { |
19 |
return Zipkin.invoke( "DB", "FIND ALL", new Callable< Collection< Person > >() { |
21 |
public Collection<person> call() throws Exception { |
22 |
return Arrays.asList( new Person( "Tom", "Bombdil" ) ); |
As we mentioned before, we will simulate the access to database and generate a child trace by using Zipkin.invoke wrapper (which looks very simple, Zipkin.scala):
01 |
package com.example.zipkin |
03 |
import java.util.concurrent.Callable |
04 |
import com.twitter.finagle.stats.DefaultStatsReceiver |
05 |
import com.twitter.finagle.tracing.Trace |
06 |
import com.twitter.finagle.zipkin.thrift.ZipkinTracer |
07 |
import com.twitter.finagle.tracing.Annotation |
10 |
lazy val tracer = ZipkinTracer.mk( host = "localhost", port = 9410, DefaultStatsReceiver, 1 ) |
12 |
def invoke[ R ]( service: String, method: String, callable: Callable[ R ] ): R = Trace.unwind { |
13 |
Trace.pushTracerAndSetNextId( tracer, false ) |
15 |
Trace.recordRpcname( service, method ); |
16 |
Trace.record( new Annotation.ClientSend() ); |
21 |
Trace.record( new Annotation.ClientRecv() ); |
As we can see, in this case the server itself becomes a client for some other service (database).
The last and most important part of the server is to intercept all HTTP requests, extract the Trace Id from them so it will be possible to associate more data with the trace (annotate the trace). In Apache CXF it's very easy to do by providing own invoker (ZipkinTracingInvoker.scala):
01 |
package com.example.zipkin.server |
03 |
import org.apache.cxf.jaxrs.JAXRSInvoker |
04 |
import com.twitter.finagle.tracing.TraceId |
05 |
import org.apache.cxf.message.Exchange |
06 |
import com.twitter.finagle.tracing.Trace |
07 |
import com.twitter.finagle.tracing.Annotation |
08 |
import org.apache.cxf.jaxrs.model.OperationResourceInfo |
09 |
import org.apache.cxf.jaxrs.ext.MessageContextImpl |
10 |
import com.twitter.finagle.tracing.SpanId |
11 |
import com.twitter.finagle.http.HttpTracing |
12 |
import com.twitter.finagle.tracing.Flags |
13 |
import scala.collection.JavaConversions._ |
14 |
import com.twitter.finagle.tracing.Tracer |
15 |
import javax.inject.Inject |
17 |
class ZipkinTracingInvoker extends JAXRSInvoker { |
18 |
@Inject val tracer: Tracer = null |
20 |
def trace[ R ]( exchange: Exchange )( block: => R ): R = { |
21 |
val context = new MessageContextImpl( exchange.getInMessage() ) |
22 |
Trace.pushTracer( tracer ) |
24 |
val id = Option( exchange.get( classOf[ OperationResourceInfo ] ) ) map { ori => |
25 |
context.getHttpHeaders().getRequestHeader( HttpTracing.Header.SpanId ).toList match { |
26 |
case x :: xs => SpanId.fromString( x ) map { sid => |
27 |
val traceId = context.getHttpHeaders().getRequestHeader( HttpTracing.Header.TraceId ).toList match { |
28 |
case x :: xs => SpanId.fromString( x ) |
32 |
val parentSpanId = context.getHttpHeaders().getRequestHeader( HttpTracing.Header.ParentSpanId ).toList match { |
33 |
case x :: xs => SpanId.fromString( x ) |
37 |
val sampled = context.getHttpHeaders().getRequestHeader( HttpTracing.Header.Sampled ).toList match { |
38 |
case x :: xs => x.toBoolean |
42 |
val flags = context.getHttpHeaders().getRequestHeader( HttpTracing.Header.Flags ).toList match { |
43 |
case x :: xs => Flags( x.toLong ) |
47 |
val id = TraceId( traceId, parentSpanId, sid, Option( sampled ), flags ) |
50 |
if( Trace.isActivelyTracing ) { |
51 |
Trace.recordRpcname( context.getHttpServletRequest().getProtocol(), ori.getHttpMethod() ) |
52 |
Trace.record( Annotation.ServerRecv() ) |
64 |
if( Trace.isActivelyTracing ) { |
65 |
id map { id => Trace.record( new Annotation.ServerSend() ) } |
72 |
override def invoke( exchange: Exchange, parametersList: AnyRef ): AnyRef = { |
73 |
trace( exchange )( super.invoke( exchange, parametersList ) ) |
Basically, the only thing this code does is extracting Trace Id from request and associating it with the current thread. Also please notice that we associate additional data with the trace marking the server participation.
1 |
Trace.recordRpcname( context.getHttpServletRequest().getProtocol(), ori.getHttpMethod() ) |
2 |
Trace.record( Annotation.ServerRecv() ) |
To see the tracing in live, let's start our server (please notice that sbt should be installed), assuming all Zipkin components andApache Zookeeper are already up and running:
sbt 'project server' 'run-main com.example.server.ServerStarter'
then the client:
sbt 'project client' 'run-main com.example.client.ClientStarter'
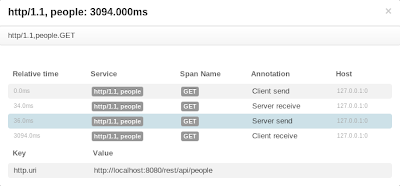
and finally open Zipkin web UI at http://localhost:8080. We should see something like that (depending how many times you have run the client):
Alternatively, we can build and run fat JARs using sbt-assembly plugin:
sbt assembly

java -jar server/target/zipkin-jaxrs-2.0-server-assembly-0.0.1-SNAPSHOT.jar

java -jar client/target/zipkin-jaxrs-2.0-client-assembly-0.0.1-SNAPSHOT.jar
If we click on any particular trace, the more detailed information will be shown, much resembling client <-> server <-> databasechain.
Even more details are shown when we click on particular element in the tree.
Lastly, the bonus part is components / services dependency graph.
As we can see, all the data associated with the trace is here and follows hierarchical structure. The root and child traces are detected and shown, as well as timelines for client send/receive and server receive/send chains. Our example is quite naive and simple, but even like that it demonstrates how powerful and useful distributed system tracing is. Thanks to Zipkin guys.
The complete source code is available on GitHub.
- Sentry 监控 - Distributed Tracing 分布式跟踪
系列 1 分钟快速使用 Docker 上手最新版 Sentry-CLI - 创建版本 快速使用 Docker 上手 Sentry-CLI - 30 秒上手 Source Maps Sentry For ...
- Steeltoe之Distributed Tracing篇
Steeltoe里的分布式追踪功能与Spring Cloud Sleuth一样,支持在日志中记录追踪数据,或者上传到远端的服务,比如Zipkin. Logging 在Steeltoe中使用日志时需要引 ...
- spring-cloud/spring-cloud-sleuth github 项目 mark
97 Star639 Fork335 spring-cloud/spring-cloud-sleuth CodeIssues 5Pull requests 1Projects 0WikiInsigh ...
- Awesome Flask
Awesome Flask A curated list of awesome Flask resources and plugins Awesome Flask Framework Admin i ...
- Awesome Flask Awesome
A curated list of awesome Flask resources and plugins Awesome Flask Framework Admin interface Authen ...
- Build Telemetry for Distributed Services之Open Telemetry简介
官网链接:https://opentelemetry.io/about/ OpenTelemetry is the next major version of the OpenTracing and ...
- Build Telemetry for Distributed Services之OpenTracing实践
官网:https://opentracing.io/docs/best-practices/ Best Practices This page aims to illustrate common us ...
- Build Telemetry for Distributed Services之Open Telemetry来历
官网:https://opentelemetry.io/ github:https://github.com/open-telemetry/ Effective observability requi ...
- Build Telemetry for Distributed Services之OpenTracing简介
官网地址:https://opentracing.io/ What is Distributed Tracing? Who Uses Distributed Tracing? What is Open ...
随机推荐
- bzoj 3730 震波——动态点分治+树状数组
题目:https://www.lydsy.com/JudgeOnline/problem.php?id=3730 查询一个点可以转化为查询点分树上自己到根的路径上每个点对应范围答案.可用树状数组 f ...
- WindowsServer2012显示计算机的方法
WindowsServer2012显示计算机的方法 (转) 消失的"计算机"?[这周九叔工作比较忙,还有其他琐事缠身,因此SystemCenter2012SP1系列的发布稍慢,抱歉 ...
- Asp.net MVC 出现“Failed to map the path '/'.”错误
Server Error in '/' Application. Parser Error Description: An error occurred during the parsing of a ...
- 配置spring的log4j日志记录
1.导入依赖包pom.xml <project xmlns="http://maven.apache.org/POM/4.0.0" xmlns:xsi="http: ...
- Waiting for device dev/disk/by-id/ata-...-part2 to appear
问题: 平台:Oralce VM Virtualbox的虚拟机Opensuse11.4 导出该机器的OVA文件后,把该OVA文件导入虚拟机,开机启动时报如下错误: Trying manual resu ...
- SqlServer快速获得表总记录数(大数据量)
--第1种 执行全表扫描才能获得行数 SELECT count(*) FROM BUS_tb_UserGradePrice --第2种 执行扫描全表id不为空的,获得行数 select count(u ...
- 分布式锁实践(二)-ZooKeeper实现总结
写在最前面 前几周写了篇 利用Redis实现分布式锁 ,今天简单总结下ZooKeeper实现分布式锁的过程.其实生产上我只用过Redis或者数据库的方式,之前还真没了解过ZooKeeper怎么实现分布 ...
- HTTP代理器Fiddler(三)
HTTP代理神器Fiddler Fiddler是一款强大Web调试工具,它能记录所有客户端和服务器的HTTP请求. Fiddler启动的时候,默认IE的代理设为了127.0.0.1:8888,而其他浏 ...
- ELK Stack 5.2.2 安装文档
简介: ELK Stack 安装文档,这次都使用最新版本(5.2.2).RPM 包的方式搭建 ELK Stack. 下载地址: https://artifacts.elastic.co/downloa ...
- PLSQL result set exceeds the maximum size(100M)if necessary,you can explicitly confinue this query
在PL SQL 里执行一条语句,当反正信息达到2w条时,弹出如下内容:result set exceeds the maximum size(100M)if necessary,you can exp ...