
OpenLayers入门练习
一、实验内容
- 练习OpenLayers的引用形式;
- 简单地图加载;
- 控件加载。
二、实验步骤
2.1 ol引用
<!doctype html>

<html lang="zh">

<head>

    <link rel="stylesheet"

        href="https://cdn.jsdelivr.net/gh/openlayers/openlayers.github.io@master/en/v6.5.0/css/ol.css" type="text/css">

    <script src="https://cdn.jsdelivr.net/gh/openlayers/openlayers.github.io@master/en/v6.5.0/build/ol.js"></script>

    <title>OpenLayers example</title>

</head>

<body>

</body>

</html>
2.2 单个地图显示
<!DOCTYPE html>

<html lang="zh">

<head>

    <meta content="text/html;charset=UTF-8">

    <title>OpenLayers example</title>

    <link rel="stylesheet" href="./v6.5.0-dist/ol.css">

    <script src="./v6.5.0-dist/ol.js"></script>

    <style>

        html,

        body,

        div {

            height: 100%;

            width: 100%;

            margin: 0%;

        }

    </style>

</head>

<body>

    <div id="map" class="map"></div>

    <script type="text/javascript">

        var map = new ol.Map({

          target: 'map',

          layers: [

            new ol.layer.Tile({

              source: new ol.source.OSM()

            })

          ],

          view: new ol.View({

            center: ol.proj.fromLonLat([37.41, 8.82]),

            zoom: 10

          })

        });

      </script>

</body>

</html>
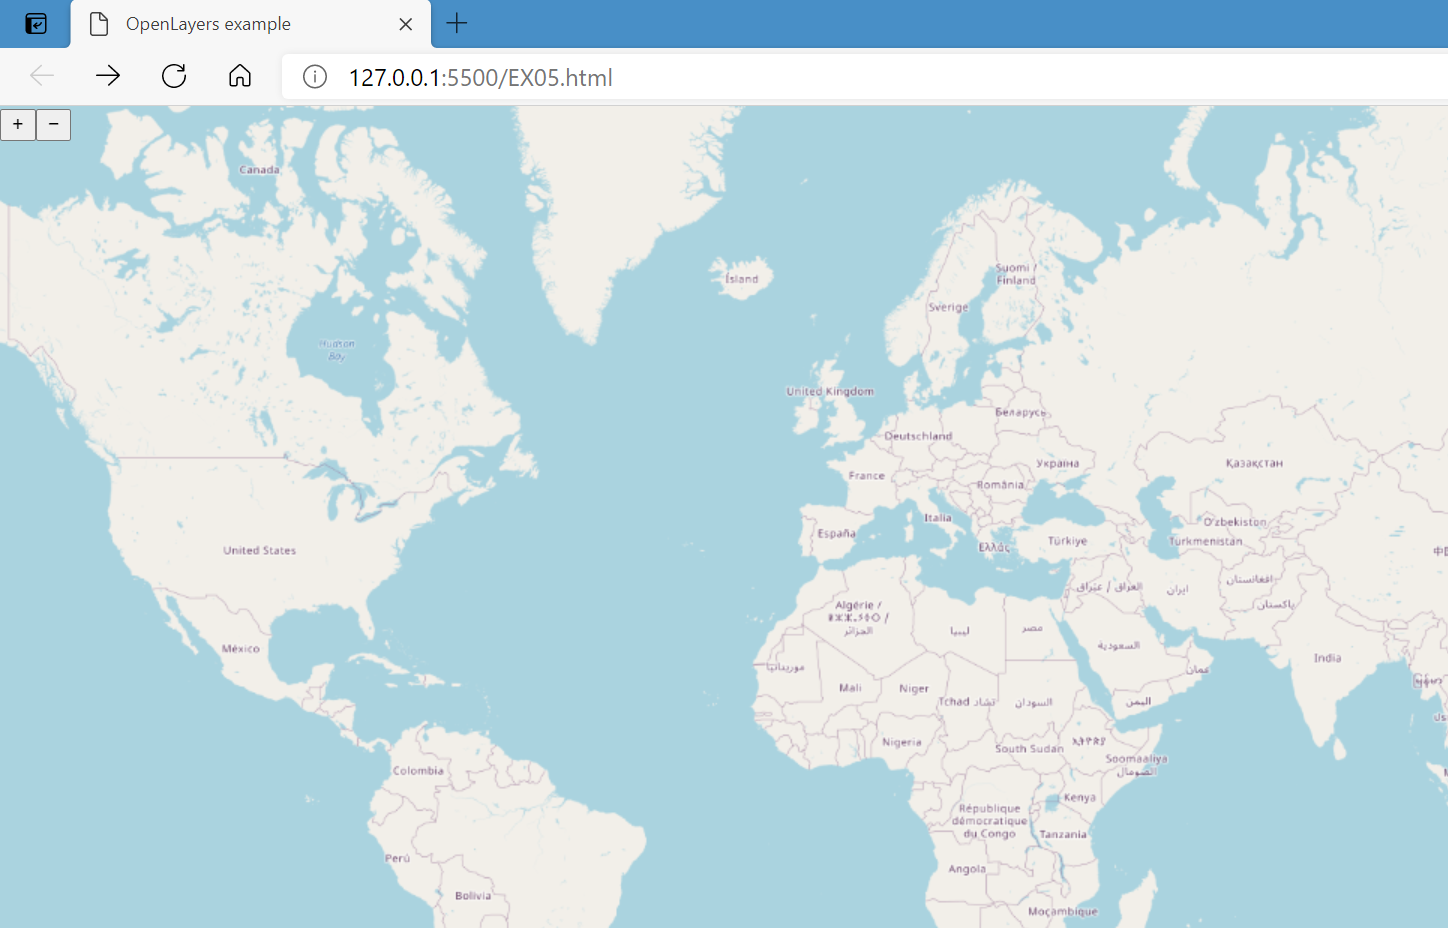
2.3 两幅静态地图显示
<html>

<head>

  <meta charset="utf-8">

  <title>单个地图加载</title>

  <link href="./v6.5.0-dist/ol.css" rel="stylesheet" />

  <script src="./v6.5.0-dist/ol.js"></script>

  <style>

    html,

    body {

      height: 100%;

    }

    #map_1 {

      width: 49%;

      height: 99%;

      float: left;

    }

    #map_2 {

      width: 49%;

      height: 99%;

      float: right;

    }

  </style>

</head>

<body>

  <div id="map_1"></div>

  <div id="map_2"></div>

  <script type="text/javascript">

    var map = new ol.Map({

      target: 'map_1',

      layers: [new ol.layer.Tile({

        source: new ol.source.OSM()

      })],

      view: new ol.View({

        center: [0, 0],

        zoom: 2

      })

    });

    var map_2 = new ol.Map({

      target: 'map_2',

      layers: [new ol.layer.Tile({

        source: new ol.source.OSM({

          url: 'http://{a-c}.tile.thunderforest.com/cycle/{z}/{x}/{y}.png'

        })

      })],

      view: new ol.View({

        center: [0, 0],

        zoom: 2

      })

    })

  </script>

</body>

</html>
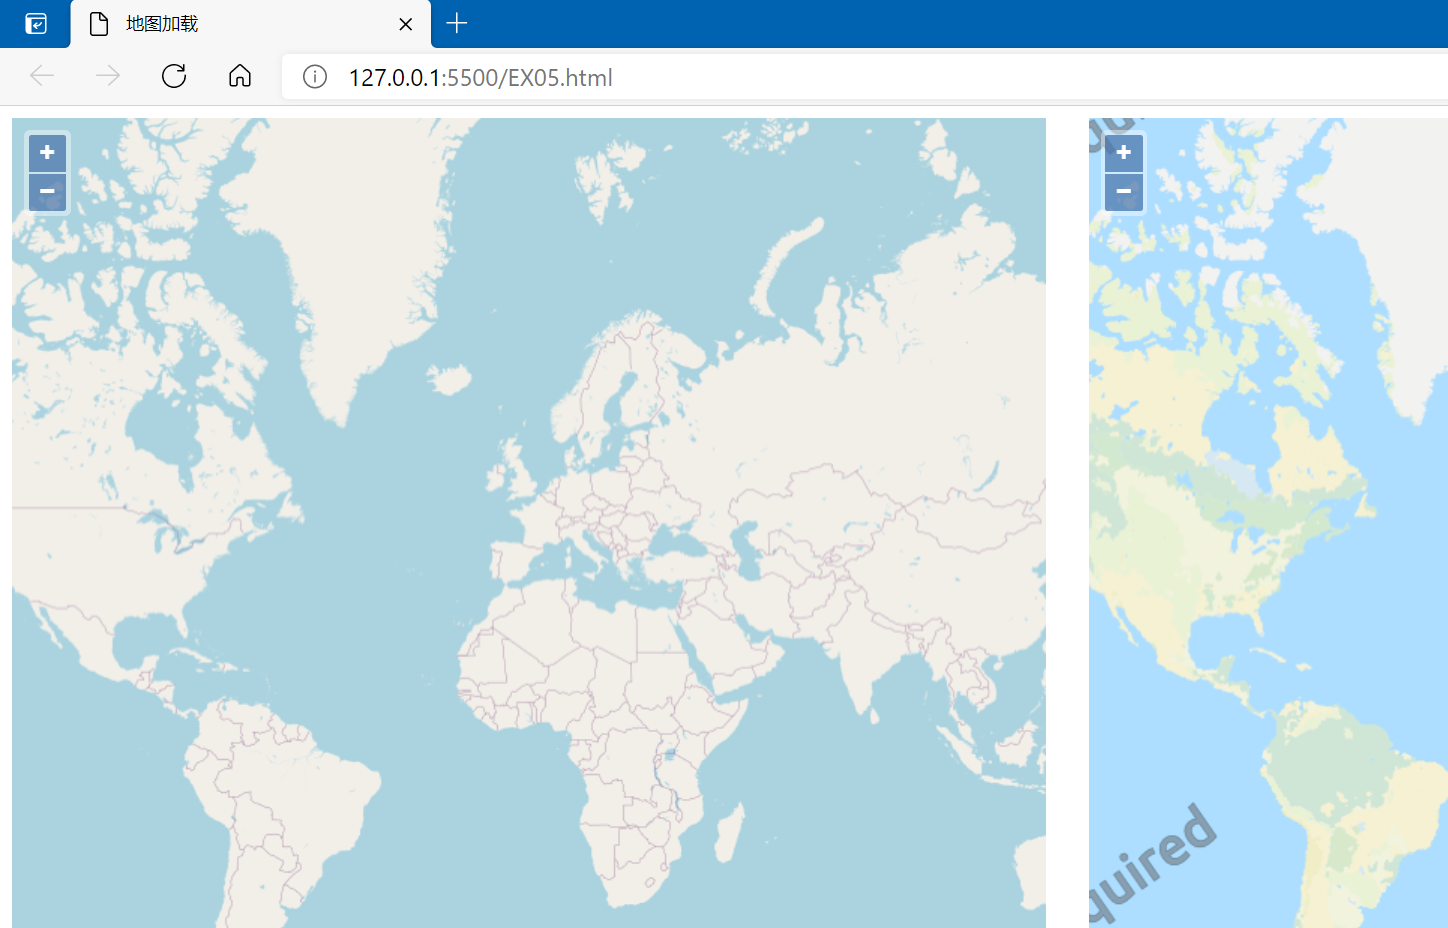
2.4 地图联动
<html>

<head>

  <meta charset="utf-8">

  <title>地图加载</title>

  <link href="./v6.5.0-dist/ol.css" rel="stylesheet" />

  <script src="./v6.5.0-dist/ol.js"></script>

  <style>

    html,

    body {

      height: 100%;

    }

    #map_1 {

      width: 49%;

      height: 99%;

      float: left;

    }

    #map_2 {

      width: 49%;

      height: 99%;

      float: right;

    }

  </style>

</head>

<body>

  <div id="map_1"></div>

  <div id="map_2"></div>

  <script type="text/javascript">

    var view = new ol.View({

      center: [0, 0],

      zoom: 2

    })

    var map = new ol.Map({

      target: 'map_1',

      layers: [new ol.layer.Tile({

        source: new ol.source.OSM()

      })],

      view: view

    });

    var map_2 = new ol.Map({

      target: 'map_2',

      layers: [new ol.layer.Tile({

        source: new ol.source.OSM({

          url: 'http://{a-c}.tile.thunderforest.com/cycle/{z}/{x}/{y}.png'

        })

      })],

      view: view

    })

  </script>

</body>

</html>
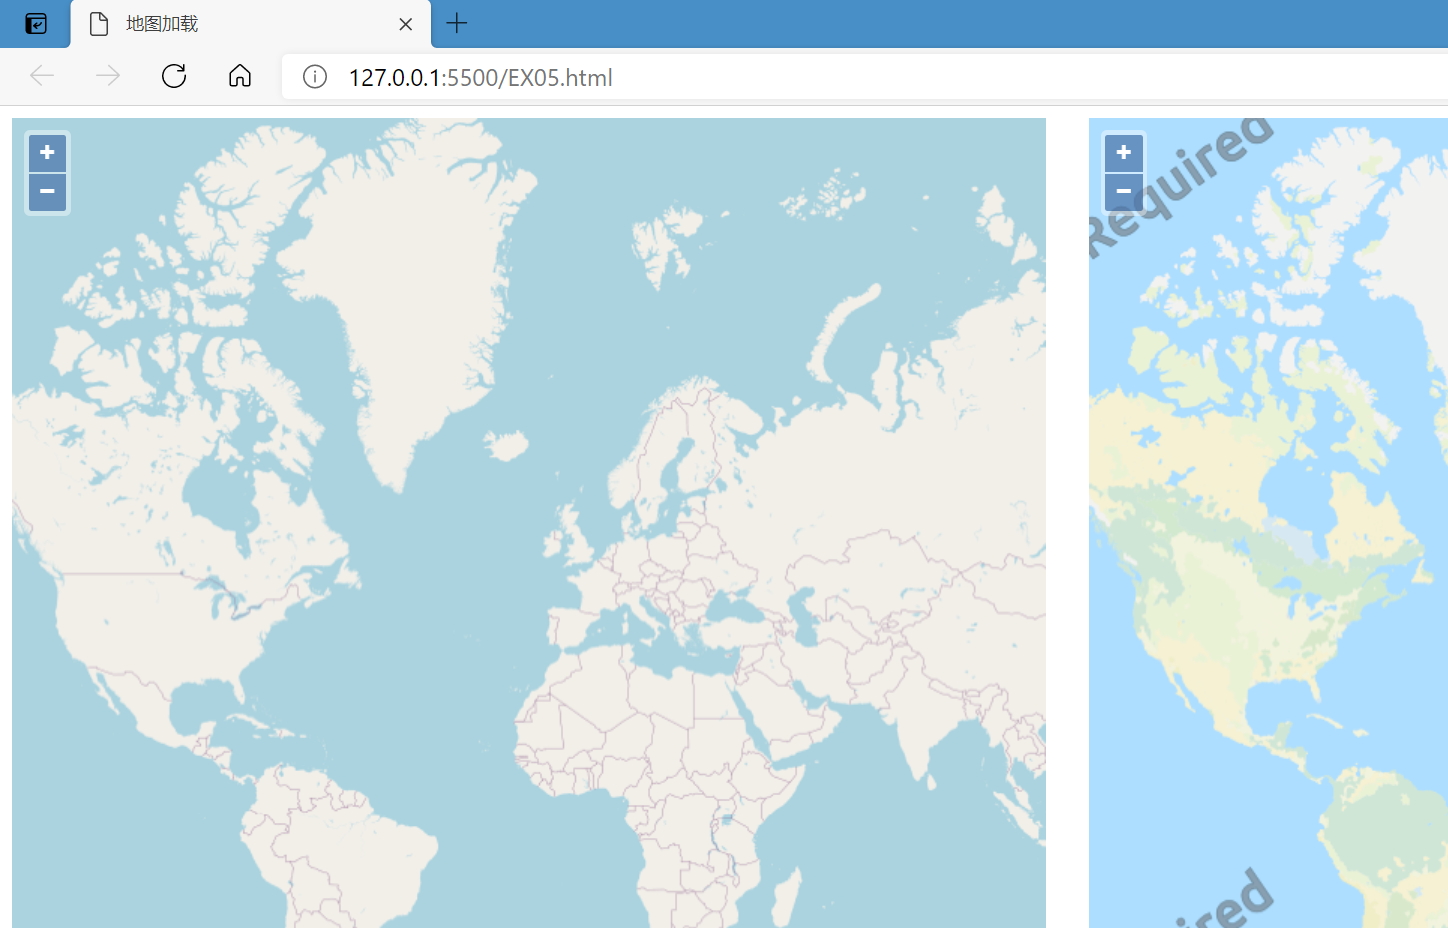
2.5 视图属性-旋转角度
<html>

<head>

  <meta charset="utf-8">

  <title>地图加载</title>

  <link href="./v6.5.0-dist/ol.css" rel="stylesheet" />

  <script src="./v6.5.0-dist/ol.js"></script>

  <style>

    html,

    body {

      height: 100%;

    }

    #map_1 {

      width: 49%;

      height: 99%;

      float: left;

    }

    #map_2 {

      width: 49%;

      height: 99%;

      float: right;

    }

  </style>

</head>

<body>

  <div id="map_1"></div>

  <div id="map_2"></div>

  <script type="text/javascript">

    var view = new ol.View({

      center: [0, 0],

      zoom: 2

    })

    var map = new ol.Map({

      target: 'map_1',

      layers: [new ol.layer.Tile({

        source: new ol.source.OSM()

      })],

      view: new ol.View({

        center: [0, 0],

        zoom: 2,

        rotation: Math.PI / 6

      })

    });

    var map_2 = new ol.Map({

      target: 'map_2',

      layers: [new ol.layer.Tile({

        source: new ol.source.OSM()

      })],

      view: view

    })

  </script>

</body>

</html>
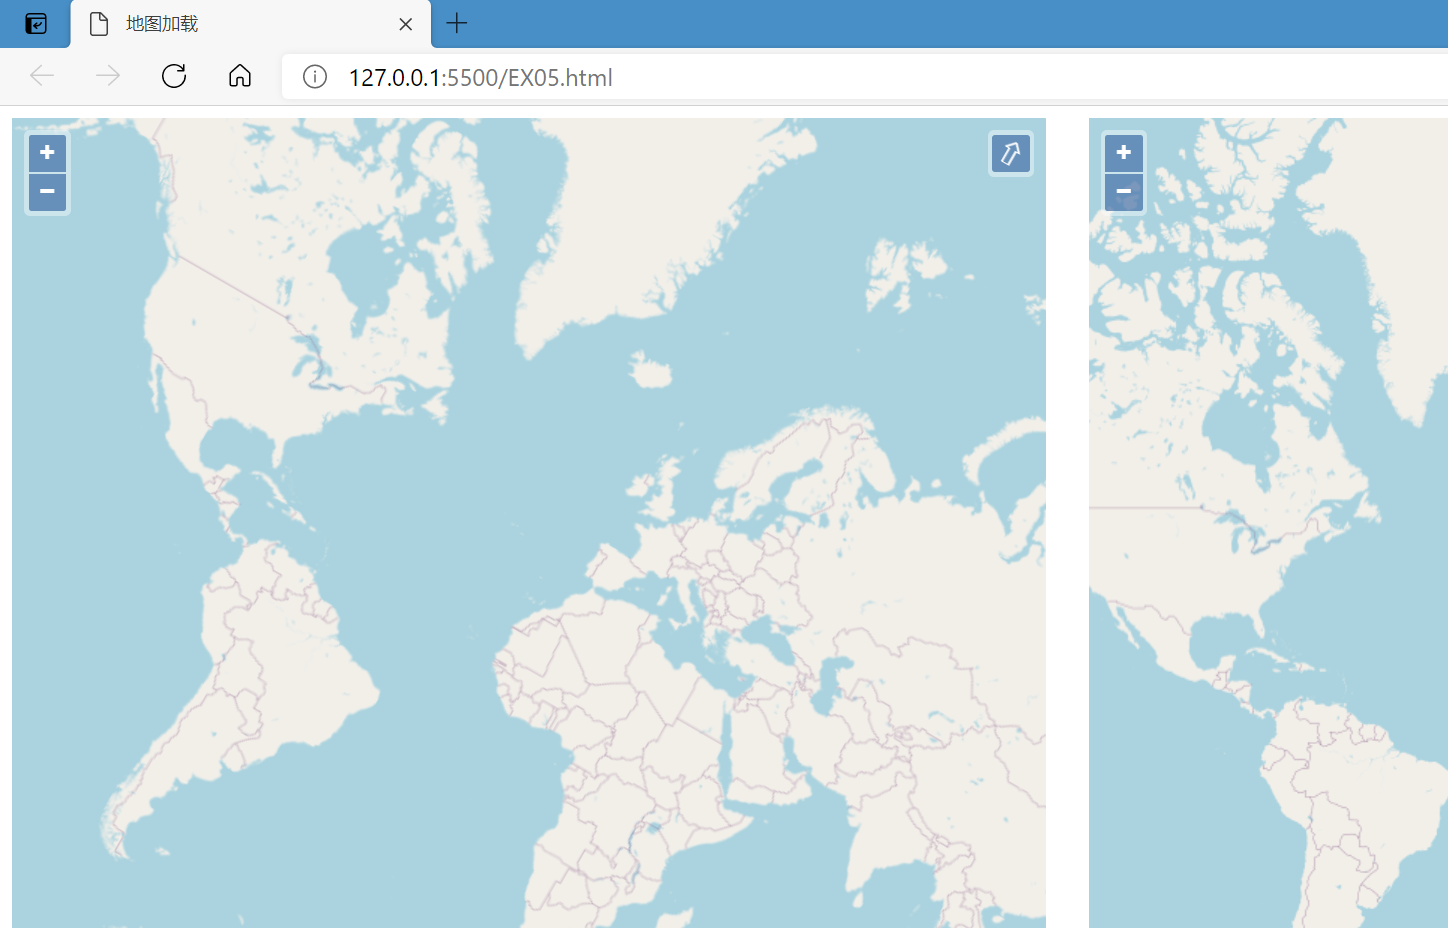
2.6 视图属性-限制地图缩放级别
<html>

<head>

  <meta charset="utf-8">

  <title>地图加载</title>

  <link href="./v6.5.0-dist/ol.css" rel="stylesheet" />

  <script src="./v6.5.0-dist/ol.js"></script>

  <style>

    html,

    body {

      height: 100%;

    }

    #map_1 {

      width: 49%;

      height: 99%;

      float: left;

    }

    #map_2 {

      width: 49%;

      height: 99%;

      float: right;

    }

  </style>

</head>

<body>

  <div id="map_1"></div>

  <div id="map_2"></div>

  <script type="text/javascript">

    var view = new ol.View({

      center: [0, 0],

      zoom: 2

    })

    var map = new ol.Map({

      target: 'map_1',

      layers: [new ol.layer.Tile({

        source: new ol.source.OSM()

      })],

      view: new ol.View({

        center: [0, 0],

        zoom: 2,

        rotation: Math.PI / 6,

        minZoom: 4,

        maxZoom: 7,

      })

    });

    var map_2 = new ol.Map({

      target: 'map_2',

      layers: [new ol.layer.Tile({

        source: new ol.source.OSM()

      })],

      view: view

    })

  </script>

</body>

</html>
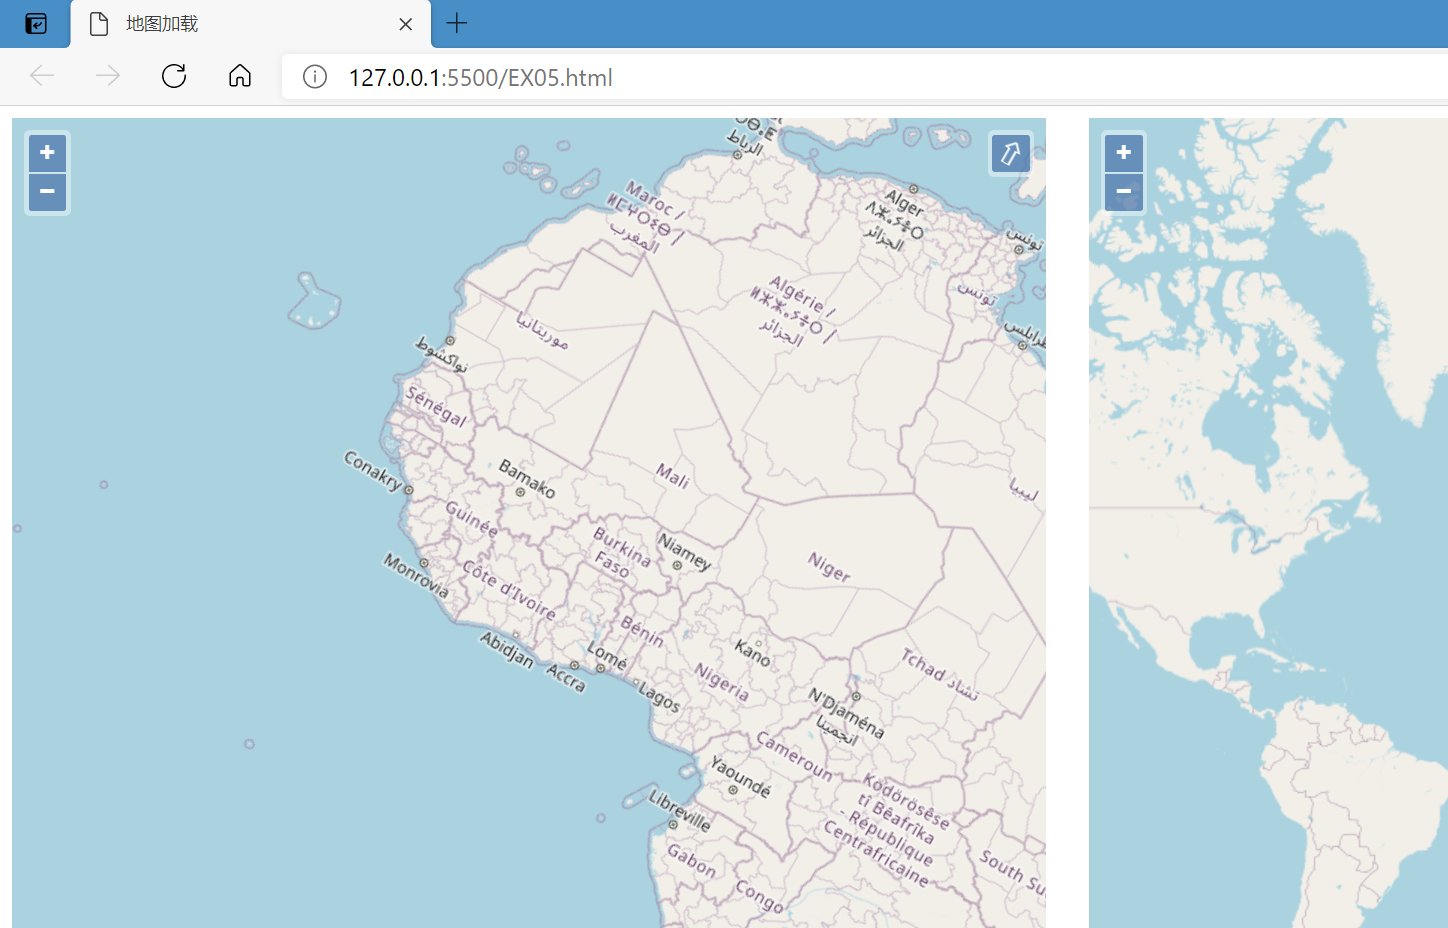
2.7 View-缩放到范围
<html>

<head>

  <meta charset="utf-8">

  <title>地图加载</title>

  <link href="./v6.5.0-dist/ol.css" rel="stylesheet" />

  <script src="./v6.5.0-dist/ol.js"></script>

  <style>

    html,

    body {

      height: 100%;

    }

    #menu {

      position: absolute;

      top: 100px;

      left: 20px;

      z-index: 11;

    }

    .btn {

      background-color: rgba(0, 60, 136, 0.5);

      display: block;

      margin: 1px;

      padding: 0;

      color: #fff;

      font-size: 1.14em;

      text-decoration: none;

      text-align: center;

      height: 1.375em;

      border: none;

      border-radius: 0 0 2px 2px;

    }

  </style>

</head>

<body>

  <div id="map">

    <div id="menu">

      <button class="btn" onclick="fitToChangsha()">长沙市</button>

      <button class="btn" onclick="fitToPoint()">地信楼</button>

    </div>

  </div>

  <script type="text/javascript">

    var map = new ol.Map({

      target: 'map',

      layers: [new ol.layer.Tile({

        source: new ol.source.OSM()

      })],

      view: new ol.View({

        //设置北京市为地图中心

        center: [12952902.8394, 4852401.2052],

        zoom: 10,

      })

    });

    function fitToChangsha() {

      map.getView().fit([12560816.6134, 3273506.2545, 12591065.3310, 3281592.9487])

    }

    function fitToPoint() {

      map.getView().fit(new ol.geom.Point([12570902.1896, 3269680.4449]), { maxZoom: 18 })

    }

  </script>

</body>

</html>
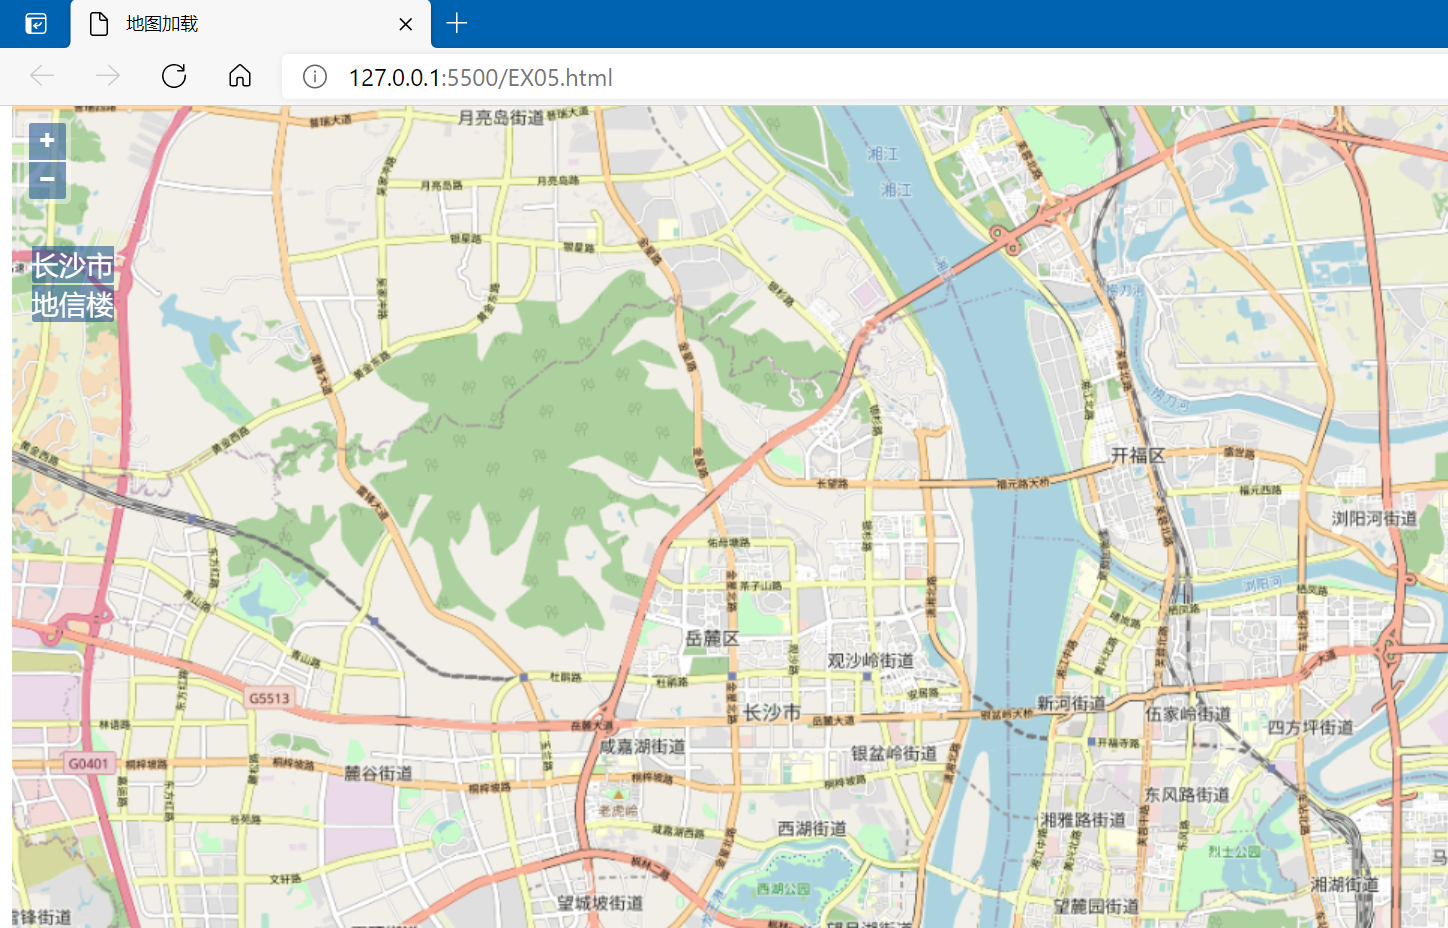
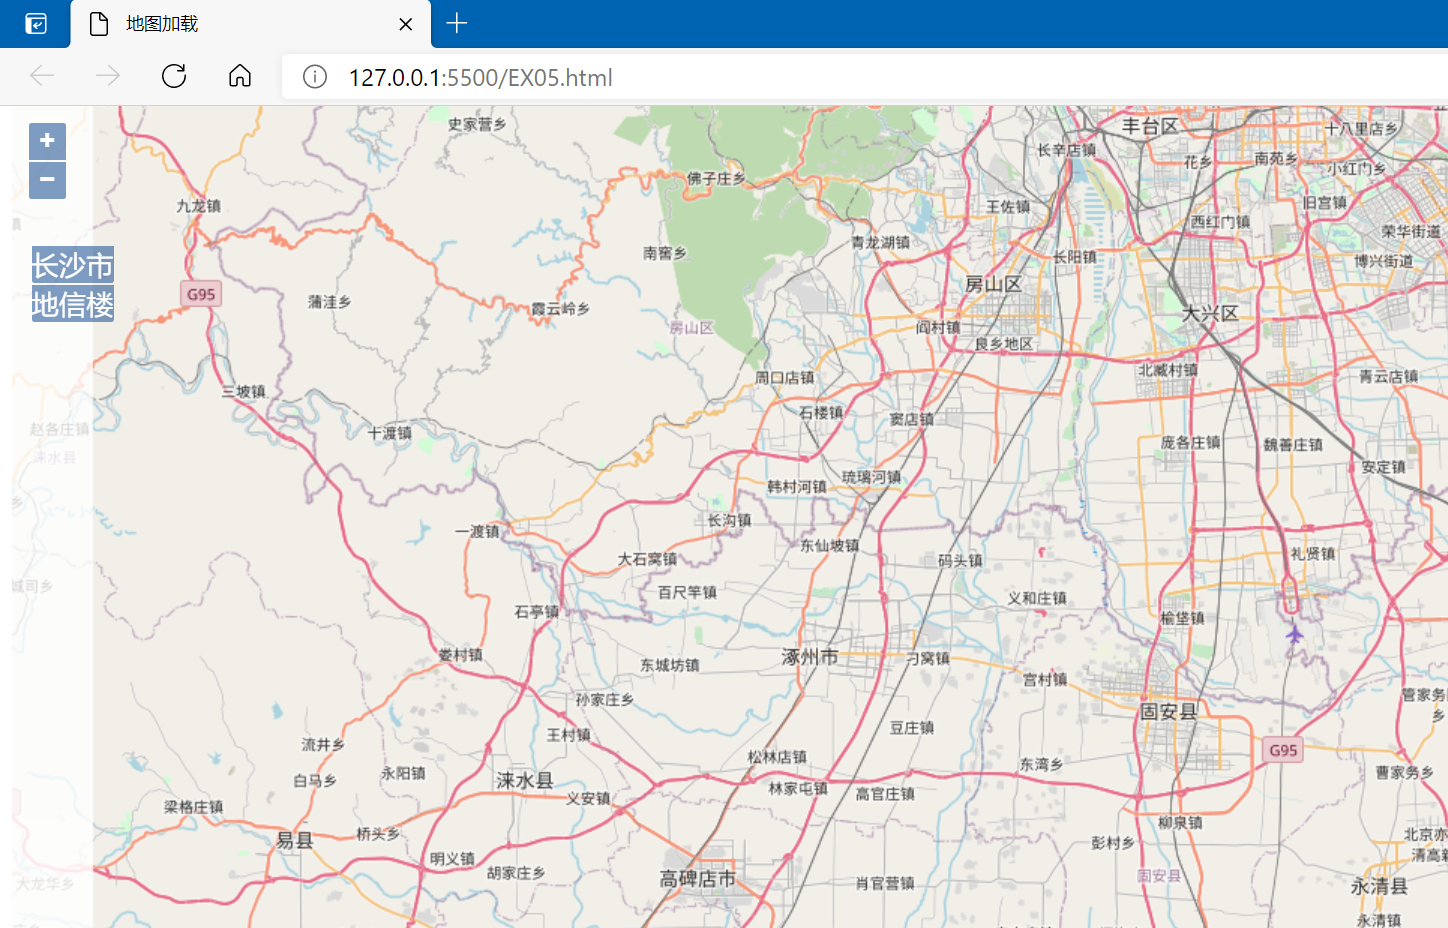
2.8 View-动画效果
<html>

<head>

  <meta charset="utf-8">

  <title>地图加载</title>

  <link href="./v6.5.0-dist/ol.css" rel="stylesheet" />

  <script src="./v6.5.0-dist/ol.js"></script>

  <style>

    html,

    body {

      height: 100%;

    }

    #menu {

      position: absolute;

      top: 100px;

      left: 20px;

      z-index: 11;

    }

    .btn {

      background-color: rgba(0, 60, 136, 0.5);

      display: block;

      margin: 1px;

      padding: 0;

      color: #fff;

      font-size: 1.14em;

      text-decoration: none;

      text-align: center;

      height: 1.375em;

      border: none;

      border-radius: 0 0 2px 2px;

    }

  </style>

</head>

<body>

  <div id="map">

    <div id="menu">

      <button class="btn" onclick="fitToChangsha()">长沙市</button>

      <button class="btn" onclick="fitToPoint()">地信楼</button>

    </div>

  </div>

  <script type="text/javascript">

    var map = new ol.Map({

      target: 'map',

      layers: [new ol.layer.Tile({

        source: new ol.source.OSM()

      })],

      view: new ol.View({

        //设置长沙市为地图中心

        center: [12952902.8394, 4852401.2052],

        zoom: 10,

      })

    });

    var changsha = [12570902.1896, 3269680.4449];

    var changsha_center = [12571883.0743, 3277963.5524

    ];

    function fitToChangsha() {

      map.getView().animate({

        center: changsha_center,

        duration: 2000,

      })

    }

  </script>

</body>

</html>
OpenLayers入门练习的更多相关文章
- OpenLayers入门(一)
OpenLayers简介 OpenLayers(https://openlayers.org/)是一个用来帮助开发Web地图应用的高性能的.功能丰富的JavaScript类库,可以满足几乎所有的地图开 ...
- Webgis中关于Openlayers入门使用(一)安装及生成基本地图
一.WebGis项目中使用的版本2.12 下载地址:https://github.com/openlayers/ol2/releases https://github.com/openlayers/o ...
- openlayers4 入门开发系列之地图展示篇(附源码下载)
前言 openlayers4 官网的 api 文档介绍地址 openlayers4 api,里面详细的介绍 openlayers4 各个类的介绍,还有就是在线例子:openlayers4 官网在线例子 ...
- GIS之家资源
分享资源之arcgis软件系列 arcgis10.0(arcgis desktop以及arcgis server):下载 arcgis10.1(arcgis desktop以及arcgis serve ...
- GIS之家demo源代码咨询
GIS之家demo源代码咨询收费服务(希望对 webgis 新人有所帮助) GIS之家QQ群(采取QQ群入群收费模式): GIS之家001:296438295 需要入群的giser们,入群之前联系GI ...
- OpenLayers 3 入门教程
OpenLayers 3 入门教程摘要OpenLayers 3对OpenLayers网络地图库进行了根本的重新设计.版本2虽然被广泛使用,但从JavaScript开发的早期发展阶段开始,已日益现实出它 ...
- openLayers 3 之入门
openLayers 3 之入门 openlayer是web GIS客户端开发提供的javascript类库,也是开源框架,可以加载本地数据进行展示地图 1.下载相关引用的js.css文件 2.类似于 ...
- 【OpenLayers】入门教程地址
[OpenLayers]入门教程地址: 点击进入 http://anzhihun.coding.me/ol3-primer/index.html 简书地址 : http://www.jians ...
- SuperMap iClient for JavaScript 新手入门
地理信息系统(英语:Geographic Information System,缩写:GIS)是一门综合性学科,结合地理学与地图学,已经广泛的应用在不同的领域,是用于输入.存储.查询.分析和显示地理数 ...
- openlayers 学习笔记之1
1. 为Web Gis客户端开发的javascript 框架 百度文库中的教程:入门经典> 1) 初始化map: map = new OpenLayers.Map(mapContainerNam ...
随机推荐
- 【Spring专题】「开发指南」夯实实战基础功底之解读logback-spring.xml文件的详解实现
logback的maven配置 <dependency> <groupId>org.slf4j</groupId> <artifactId>slf4j- ...
- [深度学习] ncnn安装和调用基础教程
目录 1 介绍 2 Ubuntu 18下ncnn安装和使用 2.1 Ubuntu 18下ncnn编译安装 2.2 Ubuntu 18下ncnn使用 3 Windows 10下ncnn安装和使用 3.1 ...
- python数据分析与可视化【思维导图】
python数据分析与可视化常用库 numpy+matplotlib+pandas 思维导图 图中难免有错误,后期随着学习与应用的深入,会不断修改更新. 当前版本号:1.0 numpy介绍 NumPy ...
- ArcGIS工具 - 按线分割面
功能说明 在ArcGIS数据处理过程中,有时需要沿线把面要素分割开,可以使用高级编辑中的分割面(Cut Polygon)工具.那么,如果要用线图层分割面图层该怎么办呢?为源GIS为您开发了一个自定义模 ...
- DVWA靶场实战(一)——Brute Force
DVWA靶场实战(一) 一.Brute Force: 1.漏洞原理: Brute Force是暴力破解的意思,大致原理就是利用穷举法,穷举出所有可能的密码. 2.攻击方法: Burpsuite中的In ...
- R数据分析:孟德尔随机化中介的原理和实操
中介本身就是回归,基本上我看到的很多的调查性研究中在中介分析的方法部分都不会去提混杂,都是默认一个三角形画好,中介关系就算过去了,这里面默认的逻辑就是前两步回归中的混杂是一样的,计算中介效应的时候就自 ...
- Redis-03 数据格式和基础命令
1 单进程 Redis采用单进程模型来处理客户端的请求.对读写等时间的响应是通过对epoll函数的包装来做到的.Redis的实际处理速度完全依靠主进程的执行效率. Epoll是Linux内核为 ...
- concurrent.futures之ThreadPoolExecutor python线程池代码实现方法
from concurrent.futures import ThreadPoolExecutor def main(i): print(i) THREAD_NUM = 20 # 线程数 with T ...
- EF Core DBFirst和CodeFirst 模式使用方法
一.安装依赖包 1.Microsoft.EntityFrameworkCore 2.Microsoft.EntityFrameworkCore.Tools 3.Microsoft.EntityFram ...
- 企业级GitLab在Docker部署使用
一.部署gitlab 这里使用的是Centos8,安装Docker环境 ,这里不说了,参考:https://www.cnblogs.com/wei325/p/15139701.html gitlab有 ...