
t检验,T Test (Student’s T-Test)
1、什么是T test?
t-test:比较数据的均值,告诉你这两者之间是否相同,并给出这种不同的显著性(即是否是因为偶然导致的不同)
The t test (also called Student’s T Test) compares two averages (means) and tells you if they

 are different from each other. The t test also tells you how significant the differences are;In

other words it lets you know if those differences could have happened by chance.
例子:制药公司可能想测试一种新的抗癌药物,看看它是否能提高预期寿命。在实验中,总有一个对照组(给一组人服用安慰剂,或“糖丸”)。对照组的平均预期寿命为+5岁,而服用新药的组的平均预期寿命为+6岁。看来这种药可能有效。但这可能是一个巧合。为了验证这一点,研究人员将使用Student’s t-test来发现结果是否可以在整个人群中重复
Student’s T-tests can be used in real life to compare means. For example, a drug company may

want to test a new cancer drug to find out if it improves life expectancy. In an experiment,

there’s always a control group (a group who are given a placebo, or “sugar pill”). The control

 group may show an average life expectancy of +5 years, while the group taking the new drug

might have a life expectancy of +6 years. It would seem that the drug might work. But it could

be due to a fluke. To test this, researchers would use a Student’s t-test to find out if the

results are repeatable for an entire population.
2、The T Score.
T Score:是两组之间的差异与组内差异的比值。t值越大,组间差异越大。t值越小,组间的相似性越大。t得分为3表示两个组之间的差异是它们内部差异的三倍。当您运行t测试时,t值越大,结果越有可能是可重复的
The t score is a ratio between the difference between two groups and the difference within the

 groups. The larger the t score, the more difference there is between groups. The smaller the t

 score, the more similarity there is between groups. A t score of 3 means that the groups are

three times as different from each other as they are within each other. When you run a t test,

the bigger the t-value, the more likely it is that the results are repeatable
- A large t-score tells you that the groups are different.
- A small t-score tells you that the groups are similar
3、T-Values and P-values
P-values:“足够大”有多大?每个t值都有一个p值。p值是样本数据的结果偶然发生的概率。p值从0%到100%。它们通常写成小数。例如,5%的p值是0.05。低p值是好的;它们表明您的数据不是偶然产生的。例如,p值为0.01意味着实验结果碰巧发生的概率只有1%。在大多数情况下,p值为0.05(5%)表示数据有效
How big is “big enough”? Every t-value has a p-value to go with it. A p-value is the probability

 that the results from your sample data occurred by chance. P-values are from 0% to 100%.

 They are usually written as a decimal. For example, a p value of 5% is 0.05. Low p-values are

 good; They indicate your data did not occur by chance. For example, a p-value of .01 means

 there is only a 1% probability that the results from an experiment happened by chance. In

 most cases, a p-value of 0.05 (5%) is accepted to mean the data is valid.
4、main types of t-test
An Independent Samples t-test((also called the unpaired samples t test)) compares the means for two groups.

A Paired sample t-test(also called a correlated pairs t-test, a paired samples t test or dependent

samples t test) compares means from the same group at different times (say, one year apart).

A One sample t-test tests the mean of a single group against a known mean.
4.1、 Independent Samples t-test
独立样本t检验(又称未配对样本t检验)是t检验最常见的形式。它帮助您比较两组数据的方法。例如,你可以做一个t测试,看看男性和女性的平均测试成绩是否不同;测试回答了这个问题:“这些差异可能是随机产生的吗?”
前提是需要三个假设:独立假设、正态分布假设、方差同质性假设
  Assumption of Independence: you need two independent, categorical groups that represent

 your independent variable. In the above example of test scores “males” or “females” would be

 your independent variable.

  Assumption of normality: the dependent variable should be approximately normally

 distributed. The dependent variable should also be measured on a continuous scale. In the

above example on average test scores, the “test score” would be the dependent variable.

 Assumption of Homogeneity of Variance: The variances of the dependent variable should be equal.
手动计算:Calculating an Independent Samples T Test By hand(https://www.statisticshowto.datasciencecentral.com/independent-samples-t-test/)
Sample question: Calculate an independent samples t test for the following data sets:
Data set A: 1,2,2,3,3,4,4,5,5,6

Data set B: 1,2,4,5,5,5,6,6,7,9
Step 1: Sum the two groups(求各自样品的总和):
A: 1 + 2 + 2 + 3 + 3 + 4 + 4 + 5 + 5 + 6 = 35

B: 1 + 2 + 4 + 5 + 5 + 5 + 6 + 6 + 7 + 9 = 50
Step 2: Square the sums from Step 1(求各自样品总和的平方):
35 * 35= 1225

49 * 49 = 2401
Step 3: Calculate the meansfor the two groups:
A: (1 + 2 + 2 + 3 + 3 + 4 + 4 + 5 + 5 + 6)/10 = 35/10 = 3.5

B: (1 + 2 + 4 + 5 + 5 + 5 + 6 + 6 + 7 + 9) = 50/10 = 5
Step 4: Square the individual scores and then add them up:
A: 11 + 22 + 22 + 33 + 33 + 44 + 44 + 55 + 55 + 66 = 145
B: 12 + 22 + 44 + 55 + 55 + 55 + 66 + 66 + 77 + 99 = 298
Step 5: Find the Degrees of freedom
(nA-1 + nB-1) =(10-1)+(10-1)= 18
Step 6: Insert your numbers into the following formula and solve:
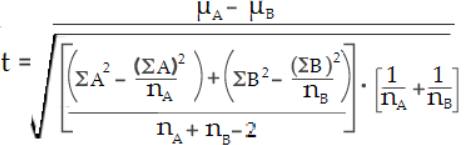
带入求值结果为-1.69
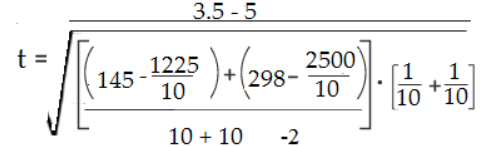
(ΣA)2: Sum of data set A, squared (Step 2).
(ΣB)2: Sum of data set B, squared (Step 2).
μA: Mean of data set A (Step 3)
μB: Mean of data set B (Step 3)
ΣA2: Sum of the squares of data set A (Step 4)
ΣB2: Sum of the squares of data set B (Step 4)
nA: Number of items in data set A
nB: Number of items in data set B
Step 7: Look up your degrees of freedom (Step 5) in the t-table(https://www.statisticshowto.datasciencecentral.com/tables/t-distribution-table/).
If you don’t know what your alpha level is, use 5% (0.05).18 degrees of freedom at an alpha level of 0.05 = 2.10.
Step 8: Compare your calculated value (Step 6) to your table value (Step 7).
The calculated value of -1.79 is less than the cutoff of 2.10 from the table. Therefore p >0 .05.

As the p-value is greater than the alpha level, we cannot conclude that there is a difference

between means.
4.2、 A paired t test
配对t测试(也称为相关配对t测试、配对样本t测试或依赖样本t测试)是在依赖样本上运行t测试的地方。依赖的样本本质上是相连的—它们是同一个人或事物的测试。例如训练前后对同一个人进行两次测试;同一个人使用不同的仪器进行两次血压测量。
手动计算paired t test:https://www.statisticshowto.datasciencecentral.com/probability-and-statistics/t-test/
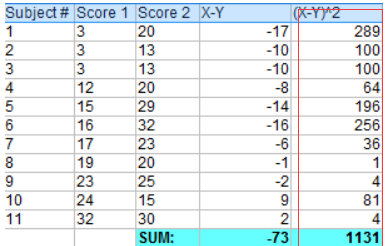
小明前后两次考试:
score1: 3、 3、 3、12、15、16、17、19、23、24、32

score2: 20、13、13、20、29、32、23、20、25、15、30
Step 1: Subtract each Y score from each X score(每个Y分数减去每个X分数).
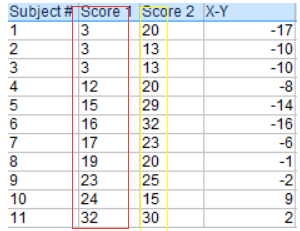
步骤2:将步骤1中的所有值相加
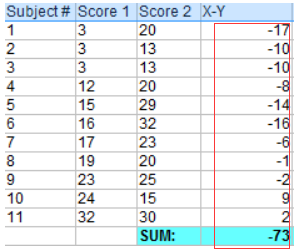
步骤3:将与步骤1的差异平方

步骤4:将所有与步骤3不同的平方相加
步骤5:用以下公式计算t-score:
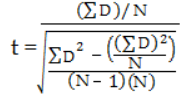
ΣD: Sum of the differences (Sum of X-Y from Step 2)
ΣD2: Sum of the squared differences (from Step 4)
(ΣD)2: Sum of the differences (from Step 2), squared
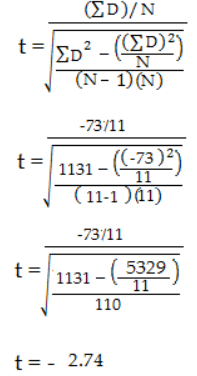
Step 6: Subtract 1 from the sample size to get the degrees of freedom(计算自由度).
We have 11 items, so 11-1 = 10.
Step 7: Find the p-value in the t-table, using the degrees of freedom in Step 6.
If you don’t have a specified alpha level, use 0.05 (5%). For this sample problem, with df=10, the t-value is 2.228.
步骤8:比较步骤7(2.228)到计算t值(-2.74)的t表值(table表)。
在alpha水平为0.05时,计算的t值大于表值。p值小于alpha水平:p <0.05。我们可以拒绝均值之间没有差异的零假设。
5、参考网址
https://www.statisticshowto.datasciencecentral.com/probability-and-statistics/t-test/
https://www.statisticshowto.datasciencecentral.com/tables/t-distribution-table/
t检验,T Test (Student’s T-Test)的更多相关文章
- 连续型变量的推断性分析——t检验
连续型变量的推断性分析方法主要有t检验和方差分析两种,这两种方法可以解决一些实际的分析问题,下面我们分别来介绍一下这两种方法 一.t检验(Student's t test) t检验也称student ...
- SPSS t 检验
在针对连续变量的统计推断方法中,最常用的是 t 检验和方差分析两种. t 检验,又称 student t 检验,主要用于样本含量较小(例如n<30),总体标准差未知的正态分布资料.它是用 t 分 ...
- R语言:常用统计检验
统计检验是将抽样结果和抽样分布相对照而作出判断的工作.主要分5个步骤: 建立假设 求抽样分布 选择显著性水平和否定域 计算检验统计量 判定 -- 百度百科 假设检验(hypothesis test)亦 ...
- Javascript 面向对象编程
Javascript是一个类C的语言,他的面向对象的东西相对于C++/Java比较奇怪,但是其的确相当的强大,在 Todd 同学的“对象的消息模型”一文中我们已经可以看到一些端倪了.这两天有个前同事总 ...
- JS面向对象教程
初探 我们知道Javascript中的变量定义基本如下: var name = 'Chen Hao';; var email = 'haoel(@)hotmail.com'; var website ...
- 一种基于Welch's t检验的二元关系挖掘
现实中常常需要挖掘两种因素之间的关联,Welch's t检验很适合其中的nomial-numerical的关系挖掘.比如天气状况对销量的影响,或者天气情况对交通流量的影响等等.我们可以按照下雨/不下雨 ...
- 转载:传说中的T检验
第二周结束:传说中的T检验 小耿2014-01-21 10:58 本文和上一篇笔记一样:语言十分啰嗦.请大家忍耐…… 以前我不懂统计的时候(现在也不懂),只知道数据出来了要做三件事:1,检验一下数据是 ...
- 【论文笔记】使用SPSS 进行 T Test (T检验)
从具有t值来看,你是在进行T检验.T检验是平均值的比较方法. T检验分为三种方法: 1. 单一样本t检验(One-sample t test),是用来比较一组数据的平均值和一个数值有无差异.例如,你选 ...
- 卡方分布 | t检验 | F检验 | 卡方检验 | 假设检验 | 各种检验持续总结
Chi-square distribution introduction 这个视频真的好,完美地解释了卡方统计量是怎么来的! 我们有一个标准正态分布的总体,我们从其中抽一次,取该值的平方就是Q1统计量 ...
随机推荐
- 关于Spring IOC (DI-依赖注入)
<Spring入门经典>这本书无论对于初学者或者有经验的工程师还是很值一看的,最近花了点时间回顾了Spring的内容,在此顺带记录一下,本篇主要与spring IOC相关 ,这篇博文适合初 ...
- BASIC-22_蓝桥杯_FJ的字符串
示例代码: #include <stdio.h>#define N 1000000 int main(void){ int n = 0 , i = 0; char arr[N] , tmp ...
- binlog之四:mysql中binlog_format模式与配置详解,binlog的日志格式详解
mysql复制主要有三种方式:基于SQL语句的复制(statement-based replication, SBR),基于行的复制(row-based replication, RBR),混合模式复 ...
- 关于attr("checked")的输出
同样的一段代码,在不同的文件输出不同的答案,好神奇. console.log($("#never").attr("checked")); 一个输出checked ...
- ni_set()函数的使用 以及 post_max_size,upload_max_filesize的修改方法
Apache服务器处理: ini_set('display_errors', 'Off');ini_set('memory_limit', -1); //-1 / 10240Mini_set(&quo ...
- xgboost的遗传算法调参
遗传算法适应度的选择: 机器学习的适应度可以是任何性能指标 —准确度,精确度,召回率,F1分数等等.根据适应度值,我们选择表现最佳的父母(“适者生存”),作为幸存的种群. 交配: 存活下来的群体中的父 ...
- 第3章 文件I/O(4)_dup、dup2、fcntl和ioctl函数
5. 其它I/O系统调用 (1)dup和dup2函数 头文件 #include<unistd.h> 函数 int dup(int oldfd); int dup2(int oldfd, i ...
- move操作
move一个表到另外一个表空间时,索引不会跟着一起move,而且会失效.(LOB类型例外) 表move,我们分为: *普通表move *分区表move *LONG,LOB大字段类型move来进行测试和 ...
- node多进程
内容: 1.多进程与多线程 2.node中多进程相关模块的使用 1.多进程与多线程 多线程:性能高:复杂.考验程序员 多进程:性能略低:简单.对程序员要求低 Node.js中默认:单进程.单线程,但是 ...
- tornado-请求与响应
import tornado.ioloop import tornado.web import tornado.httpserver # 非阻塞 import tornado.options # 提供 ...