Pthon Matplotlib 画图
一、普通绘图
 import matplotlib.pyplot as plt

 import numpy as np

 # 绘制普通图像

 x = np.linspace(-1, 1, 50)

 y1 = 2 * x + 1

 y2 = x**2

 plt.figure()

 # 在绘制时设置lable, 逗号是必须的

 l1, = plt.plot(x, y1, label = 'line')

 l2, = plt.plot(x, y2, label = 'parabola', color = 'red', linewidth = 1.0, linestyle = '--')

 # 设置坐标轴的取值范围

 plt.xlim((-1, 1))

 plt.ylim((0, 2))

 # 设置坐标轴的lable

 plt.xlabel('X axis')

 plt.ylabel('Y axis')

 # 设置x坐标轴刻度, 原来为0.25, 修改后为0.5

 plt.xticks(np.linspace(-1, 1, 5))

 # 设置y坐标轴刻度及标签, $$是设置字体

 plt.yticks([0, 0.5], ['$minimum$', 'normal'])

 # 设置legend

 plt.legend(handles = [l1, l2,], labels = ['a', 'b'], loc = 'best')

 plt.show()
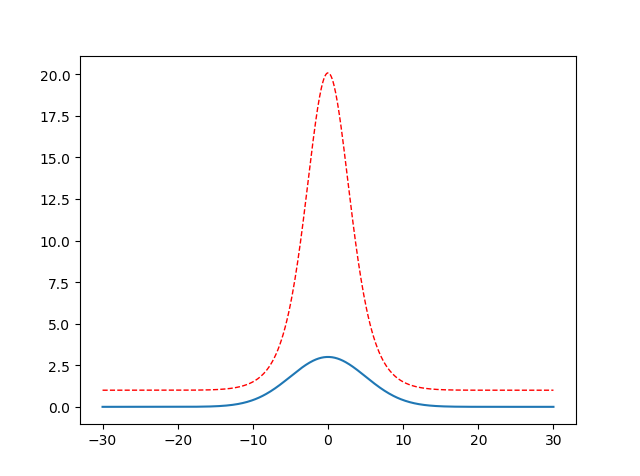
二、自定义单峰函数
 import math

 import numpy as np

 import matplotlib.pyplot as plt

 x = np.linspace(-30, 30, 500)

 y = []

 y2 = []

 a = 3

 b = 0

 c = 25

 for i in x :

     # 类似高斯函数,a 代表峰值, b对称轴位置,c方差

     temp = a * math.exp(-(i-b)**2 / (2 * c))

     y.append(temp)

     #对上一个单峰函数值进行放大处理,红色虚线部分

     y2.append(math.exp(temp))

 plt.figure()

 l1= plt.plot(x, y, label = 'line')

 l2, = plt.plot(x, y2, label = 'parabola', color = 'red', linewidth = 1.0, linestyle = '--')

 plt.show()
三、画subplot子图(2 x 2 为例)
     import matplotlib.pyplot as plt

     t=np.arange(0.0,2.0,0.1)

     s=np.sin(t*np.pi)

     plt.subplot(2,2,1) #要生成两行两列,这是第一个图plt.subplot('行','列','编号')

     plt.plot(t,s,'b--')

     plt.ylabel('y1')

     plt.subplot(2,2,2) #两行两列,这是第二个图

     plt.plot(2*t,s,'r--')

     plt.ylabel('y2')

     plt.subplot(2,2,3)#两行两列,这是第三个图

     plt.plot(3*t,s,'m--')

     plt.subplot(2,2,4)#两行两列,这是第四个图

     plt.plot(4*t,s,'k--')

     plt.show()

点图和线图
fig = plt.figure()

ax = fig.add_subplot(221, projection='3d')

ax.plot(array_normal[:,0],array_normal[:,1],array_normal[:,2])

plt.subplot(2,2,2)

plt.plot(np.arange(0,sample_len,1), signal_normal)

normal_pow = array_normal[:,2]

ax3 = fig.add_subplot(223, projection='3d')

ax3.plot(array_anomaly[:,0],array_anomaly[:,1],array_anomaly[:,2])

anomaly_pow = array_anomaly[:,2]

plt.subplot(2,2,4)

plt.scatter(np.arange(0,sample_len,1), signal_anomaly)

plt.show()

【Reference】
[1] https://www.jianshu.com/p/de223a79217a
[2] https://www.cnblogs.com/xingshansi/p/6777945.html
Pthon Matplotlib 画图的更多相关文章
- python matplotlib画图产生的Type 3 fonts字体没有嵌入问题
ScholarOne's 对python matplotlib画图产生的Type 3 fonts字体不兼容,更改措施: 在程序中添加如下语句 import matplotlib matplotlib. ...
- 使用python中的matplotlib 画图,show后关闭窗口,继续运行命令
使用python中的matplotlib 画图,show后关闭窗口,继续运行命令 在用python中的matplotlib 画图时,show()函数总是要放在最后,且它阻止命令继续往下运行,直到1.0 ...
- matplotlib 画图
matplotlib 画图 1. 画曲线图 Tompson = np.array([0, 0, 0, 0, 0.011, 0.051, 0.15, 0.251, 0.35, 0.44, 0 ...
- matplotlib画图
matplotlib画图 import numpy as np import matplotlib.pyplot as plt x1=[20,33,51,79,101,121,132,145,162, ...
- python3 使用matplotlib画图出现中文乱码的情况
python3使用matplotlib画图,因python3默认使用中unicode编码,所以在写代码时不再需要写 plt.xlabel(u’人数’),而是直接写plt.xlabel(‘人数’). 注 ...
- matplotlib画图实例:pyplot、pylab模块及作图參数
http://blog.csdn.net/pipisorry/article/details/40005163 Matplotlib.pyplot画图实例 {使用pyplot模块} matplotli ...
- python使用matplotlib画图
python使用matplotlib画图 matplotlib库是python最著名的画图库.它提供了一整套和matlab类似的命令API.十分适合交互式地进行制图. 先介绍了怎样使用matplotl ...
- matplotlib画图报错This figure includes Axes that are not compatible with tight_layout, so results might be incorrect.
之前用以下代码将实验结果用matplotlib show出来 plt.plot(np.arange(len(aver_reward_list)), aver_reward_list) plt.ylab ...
- matplotlib画图出现乱码情况
python3使用matplotlib画图,因python3默认使用中unicode编码,所以在写代码时不再需要写 plt.xlabel(u’人数’),而是直接写plt.xlabel(‘人数’). 注 ...
随机推荐
- 最课程阶段大作业之01:使用SVN实现版本控制
版本控制在友军那里都是放在整个培训的最后阶段才开始讲的,但我们打算放到SE阶段.与其匆匆在项目实战阶段弄个半生不熟,然后进入实际工作中接受他人对你的怀疑,不如……早死早超生~~~. 可是,我们毕竟现在 ...
- windows命令行下杀死进程的方法
xp和win7下有两个好东东tasklist和tskill.tasklist能列出所有的进程,和相应的信息.tskill能查杀进程,语法很简单:tskill程序名!或者是tskill 进程id 例如: ...
- JavaScript性能优化小知识总结
原文出处: YouYaInsist 欢迎分享原创到伯乐头条 前言 一直在学习javascript,也有看过<犀利开发Jquery内核详解与实践>,对这本书的评价只有两个字犀利,可能是对 ...
- SQL2012 之 创建备份计划
打开数据库,选择 管理 → 右键维护计划→选择新建维护计划,填写计划名称,如下图: 修改维护计划参数,如下图: 工具箱->备份数据库任务,拖到计划里,如下图: 编辑“备份数据库”任务,如下图: ...
- 018-Go将磁盘目录实现简单的静态Web服务
package main import( "net/http" ) func main(){ http.Handle("/", http.FileServer( ...
- MySQL 各级别事务的实现机制
MySQL 各级别事务的实现机制在处理cnctp项目已合包裹状态同步的问题时,发现读包裹状态和对包裹状态的更新不在一个事务内,我提出是否会因为消息并发导致状态一致性问题.在和同事讨论的过程中,我们开始 ...
- Android--保持加速度传感器在屏幕关闭后运行(收集)
由于写论文需要,需要用手机加速度采集数据,关于android加速度传感器的介绍网上一抓一大把,但大多都是大同小异,跟官网文档差不多.自己写了个取加速度传感器的APK,发现数据有点不对劲,原理屏幕一关后 ...
- goaccess生成nginx每日访问纪录
使用php写的,方便点 <?php // 定义全局参数 $date = date("Ymd"); $day = date("d", strtotime(' ...
- Service discovery
https://www.cnblogs.com/dirt2/p/5987067.html Use Assigned Numbers in the Service Discovery Protocol ...
- 【Linux高级驱动】input子系统框架
[1.input子系统框架(drivers\input)] 如何得出某个驱动所遵循的框架? 1) 通过网络搜索 2) 自己想办法跟内核代码! 2.1 定位此驱动是属于哪种类 ...