MATLAB 句柄绘图
一、线句柄实例
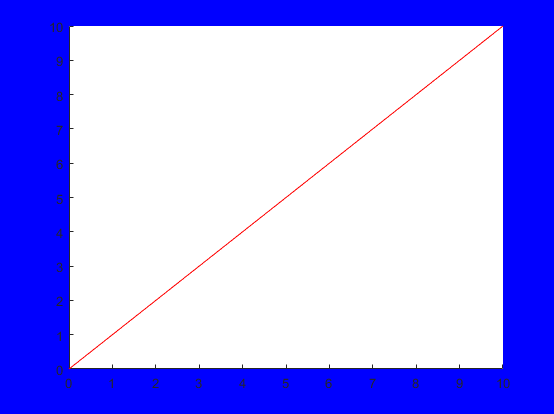
>> h1=line([0:10],[0:10])%创建句柄值

h1 =

  Line (具有属性):

              Color: [0 0.4470 0.7410]

          LineStyle: '-'

          LineWidth: 0.5000

             Marker: 'none'

         MarkerSize: 6

    MarkerFaceColor: 'none'

              XData: [0 1 2 3 4 5 6 7 8 9 10]

              YData: [0 1 2 3 4 5 6 7 8 9 10]

              ZData: [1x0 double]

  显示 所有属性

>> get(h1)%查询句柄属性

    AlignVertexCenters: 'off'

            Annotation: [1x1 matlab.graphics.eventdata.Annotation]

          BeingDeleted: 'off'

            BusyAction: 'queue'

         ButtonDownFcn: ''

              Children: [0x0 GraphicsPlaceholder]

              Clipping: 'on'

                 Color: [0 0.4470 0.7410]

             CreateFcn: ''

             DeleteFcn: ''

           DisplayName: ''

      HandleVisibility: 'on'

               HitTest: 'on'

         Interruptible: 'on'

              LineJoin: 'round'

             LineStyle: '-'

             LineWidth: 0.5000

                Marker: 'none'

       MarkerEdgeColor: 'auto'

       MarkerFaceColor: 'none'

            MarkerSize: 6

                Parent: [1x1 Axes]

         PickableParts: 'visible'

              Selected: 'off'

    SelectionHighlight: 'on'

                   Tag: ''

                  Type: 'line'

         UIContextMenu: [0x0 GraphicsPlaceholder]

              UserData: []

               Visible: 'on'

                 XData: [0 1 2 3 4 5 6 7 8 9 10]

                 YData: [0 1 2 3 4 5 6 7 8 9 10]

                 ZData: [1x0 double]
get(gcf)%窗口对象的句柄(get current figure,gcf)

                 Alphamap: [1x64 double]

             BeingDeleted: 'off'

               BusyAction: 'queue'

            ButtonDownFcn: ''

                 Children: [1x1 Axes]

                 Clipping: 'on'

          CloseRequestFcn: 'closereq'

                    Color: [0.9400 0.9400 0.9400]

                 Colormap: [64x3 double]

                CreateFcn: ''

              CurrentAxes: [1x1 Axes]

         CurrentCharacter: ''

            CurrentObject: [0x0 GraphicsPlaceholder]

             CurrentPoint: [0 0]

                DeleteFcn: ''

             DockControls: 'on'

                 FileName: ''

        GraphicsSmoothing: 'on'

         HandleVisibility: 'on'

            IntegerHandle: 'on'

            Interruptible: 'on'

           InvertHardcopy: 'on'

              KeyPressFcn: ''

            KeyReleaseFcn: ''

                  MenuBar: 'figure'

                     Name: ''

                 NextPlot: 'add'

                   Number: 1

              NumberTitle: 'on'

         PaperOrientation: 'portrait'

            PaperPosition: [3.0917 9.2937 14.8167 11.1125]

        PaperPositionMode: 'auto'

                PaperSize: [21.0000 29.7000]

                PaperType: 'A4'

               PaperUnits: 'centimeters'

                   Parent: [1x1 Root]

                  Pointer: 'arrow'

        PointerShapeCData: [16x16 double]

      PointerShapeHotSpot: [1 1]

                 Position: [680 558 560 420]

                 Renderer: 'opengl'

             RendererMode: 'auto'

                   Resize: 'on'

            SelectionType: 'normal'

           SizeChangedFcn: ''

                      Tag: ''

                  ToolBar: 'auto'

                     Type: 'figure'

            UIContextMenu: [0x0 GraphicsPlaceholder]

                    Units: 'pixels'

                 UserData: []

                  Visible: 'on'

      WindowButtonDownFcn: ''

    WindowButtonMotionFcn: ''

        WindowButtonUpFcn: ''

        WindowKeyPressFcn: ''

      WindowKeyReleaseFcn: ''

     WindowScrollWheelFcn: ''

              WindowStyle: 'normal'
>> get(gca)%当前轴对象句柄(get current axes,gca)

                       ALim: [0 1]

                   ALimMode: 'auto'

     ActivePositionProperty: 'outerposition'

          AmbientLightColor: [1 1 1]

               BeingDeleted: 'off'

                        Box: 'off'

                   BoxStyle: 'back'

                 BusyAction: 'queue'

              ButtonDownFcn: ''

                       CLim: [0 1]

                   CLimMode: 'auto'

             CameraPosition: [5 5 17.3205]

         CameraPositionMode: 'auto'

               CameraTarget: [5 5 0]

           CameraTargetMode: 'auto'

             CameraUpVector: [0 1 0]

         CameraUpVectorMode: 'auto'

            CameraViewAngle: 6.6086

        CameraViewAngleMode: 'auto'

                   Children: [2x1 Line]

                   Clipping: 'on'

              ClippingStyle: '3dbox'

                      Color: [1 1 1]

                 ColorOrder: [7x3 double]

            ColorOrderIndex: 1

                  CreateFcn: ''

               CurrentPoint: [2x3 double]

            DataAspectRatio: [5 5 1]

        DataAspectRatioMode: 'auto'

                  DeleteFcn: ''

                  FontAngle: 'normal'

                   FontName: 'Helvetica'

                   FontSize: 10

              FontSmoothing: 'on'

                  FontUnits: 'points'

                 FontWeight: 'normal'

                  GridAlpha: 0.1500

              GridAlphaMode: 'auto'

                  GridColor: [0.1500 0.1500 0.1500]

              GridColorMode: 'auto'

              GridLineStyle: '-'

           HandleVisibility: 'on'

                    HitTest: 'on'

              Interruptible: 'on'

    LabelFontSizeMultiplier: 1.1000

                      Layer: 'bottom'

             LineStyleOrder: '-'

        LineStyleOrderIndex: 1

                  LineWidth: 0.5000

             MinorGridAlpha: 0.2500

         MinorGridAlphaMode: 'auto'

             MinorGridColor: [0.1000 0.1000 0.1000]

         MinorGridColorMode: 'auto'

         MinorGridLineStyle: ':'

                   NextPlot: 'replace'

              OuterPosition: [0 0 1 1]

                     Parent: [1x1 Figure]

              PickableParts: 'visible'

         PlotBoxAspectRatio: [1 0.7903 0.7903]

     PlotBoxAspectRatioMode: 'auto'

                   Position: [0.1300 0.1100 0.7750 0.8150]

                 Projection: 'orthographic'

                   Selected: 'off'

         SelectionHighlight: 'on'

                 SortMethod: 'childorder'

                        Tag: ''

                    TickDir: 'in'

                TickDirMode: 'auto'

       TickLabelInterpreter: 'tex'

                 TickLength: [0.0100 0.0250]

                 TightInset: [0.0363 0.0532 0.0134 0.0202]

                      Title: [1x1 Text]

    TitleFontSizeMultiplier: 1.1000

            TitleFontWeight: 'normal'

                       Type: 'axes'

              UIContextMenu: [0x0 GraphicsPlaceholder]

                      Units: 'normalized'

                   UserData: []

                       View: [0 90]

                    Visible: 'on'

                      XAxis: [1x1 NumericRuler]

              XAxisLocation: 'bottom'

                     XColor: [0.1500 0.1500 0.1500]

                 XColorMode: 'auto'

                       XDir: 'normal'

                      XGrid: 'off'

                     XLabel: [1x1 Text]

                       XLim: [0 10]

                   XLimMode: 'auto'

                 XMinorGrid: 'off'

                 XMinorTick: 'off'

                     XScale: 'linear'

                      XTick: [0 1 2 3 4 5 6 7 8 9 10]

                 XTickLabel: {11x1 cell}

             XTickLabelMode: 'auto'

         XTickLabelRotation: 0

                  XTickMode: 'auto'

                      YAxis: [1x1 NumericRuler]

              YAxisLocation: 'left'

                     YColor: [0.1500 0.1500 0.1500]

                 YColorMode: 'auto'

                       YDir: 'normal'

                      YGrid: 'off'

                     YLabel: [1x1 Text]

                       YLim: [0 10]

                   YLimMode: 'auto'

                 YMinorGrid: 'off'

                 YMinorTick: 'off'

                     YScale: 'linear'

                      YTick: [0 1 2 3 4 5 6 7 8 9 10]

                 YTickLabel: {11x1 cell}

             YTickLabelMode: 'auto'

         YTickLabelRotation: 0

                  YTickMode: 'auto'

                      ZAxis: [1x1 NumericRuler]

                     ZColor: [0.1500 0.1500 0.1500]

                 ZColorMode: 'auto'

                       ZDir: 'normal'

                      ZGrid: 'off'

                     ZLabel: [1x1 Text]

                       ZLim: [-1 1]

                   ZLimMode: 'auto'

                 ZMinorGrid: 'off'

                 ZMinorTick: 'off'

                     ZScale: 'linear'

                      ZTick: [-1 0 1]

                 ZTickLabel: ''

             ZTickLabelMode: 'auto'

         ZTickLabelRotation: 0

                  ZTickMode: 'auto'
设置线条和窗口颜色
>> set(h1,'color',[1 0 0])%线条红色

>> set(gcf,'color','b')%背景蓝色
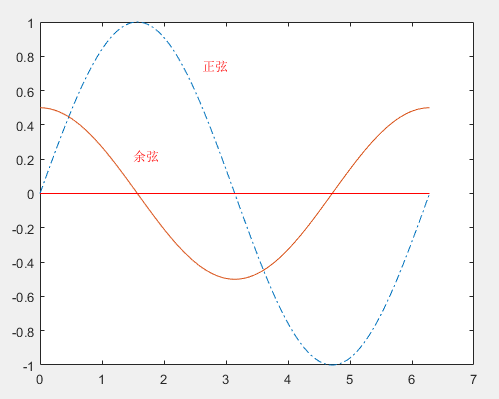
二、
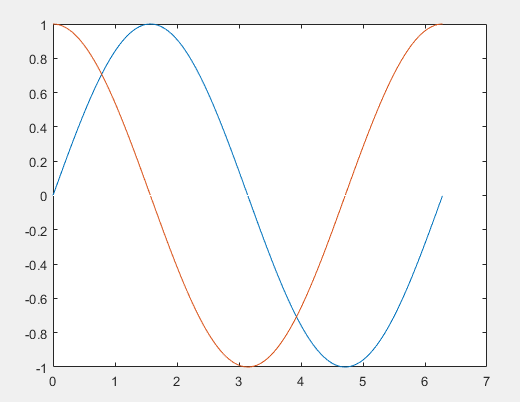
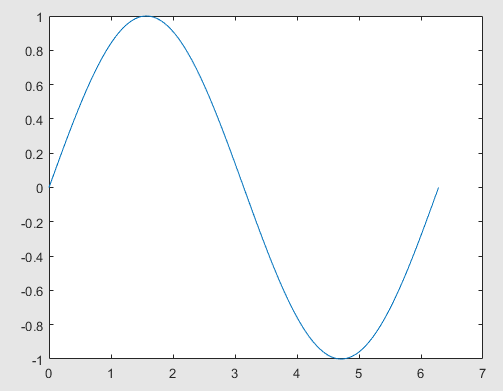
clear

x=0:2*pi/180:2*pi;

y1=sin(x);

y2=cos(x);

plot(x,y1,x,y2,x,zeros(size(x)),'w');
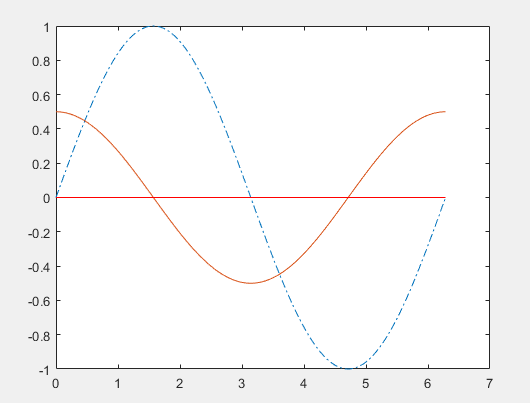
h=get(gcf,'children');%得到图片属性

hh=get(gca,'children');%得到三条线的的属性
y11=get(hh(2),'ydata');%获取cos(x)的幅度,等于y2

set(hh(2),'ydata',y11/2);%设置新的幅度

set(hh(3),'linestyle','-.');%设置格式

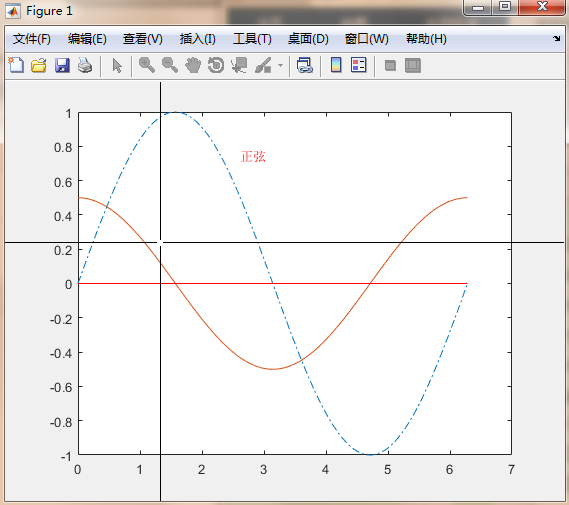
set(gca,'DefaultTextColor',[1 0 0])%设置字体颜色

gtext('正弦')%添加字体,鼠标选择位置,点击出现

gtext('余弦')
set(0,'defaultfigurecolor',[0.9 0.9 0.9])%设置图片背景颜色
set(0,'defaultfigurecolor','default')%恢复为默认值
k=menu('请选择','plot','mesh','surf')

二、
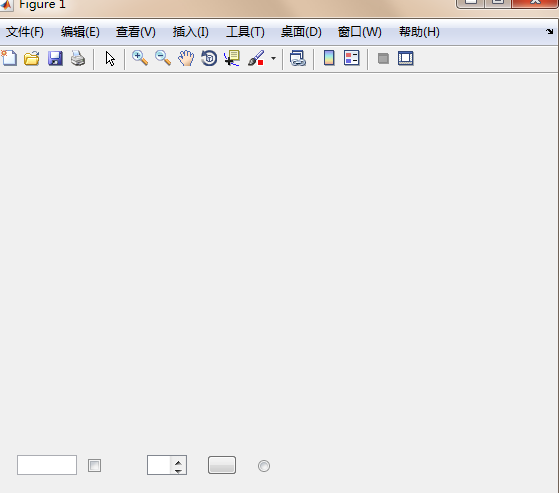
1、把控件安装在图形窗口上
clear

h1=uicontrol('style','edit','tooltipstring','edit text')

h2=uicontrol('style','checkbox','position',[90 20 30 20],'tooltipstring','checkbox')

h3=uicontrol('style','listbox','position',[150 20 40 20],'tooltipstring','listbox')%[a b c d],(a,b)左下角位置,(c,d)宽和高

h4=uicontrol('style', 'pushbutton', 'Position' ,[210,20,30,20],'TooltipString', 'pushbutton')

h5=uicontrol('style', 'radiobutton', 'Position' ,[260,20,30,20],'TooltipString', 'Radiobutton')
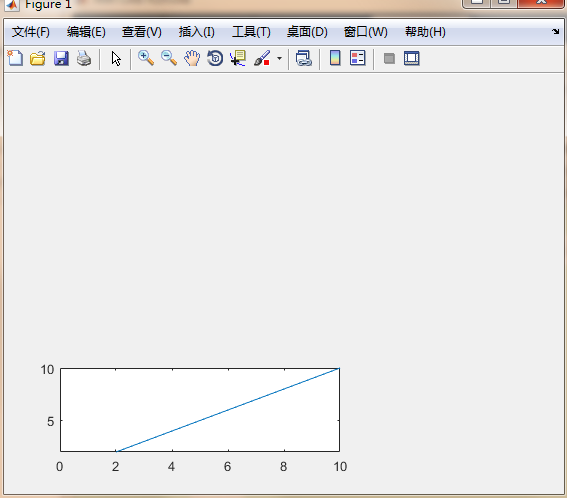
2、
clear all

axes('position',[0.1 0.1 0.5 0.2])%坐标位置

x=0:0.5:10;y=x;plot(x,y)

axis([0 10 2 10])%显示范围
3、
clear all

subplot(2,1,1)

membrane %这是一个库函数

light('color',[0.9 0.5 0.1],'position',[0,-2,1])%风格省略为无穷远,光顺序通过(0 0 0)和(0 -2 1)

subplot(2,1,2)

membrane

light('color',[0.9 0.0 0.1],'style','local','position',[1,-1,1])%风格为本地光,光源在(1 -1 1)位置

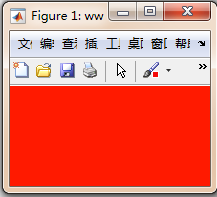
4、
clear all

figure('color',[1 0.1 0],'position',[0 0 200 100],'name','ww')
三、imagesc
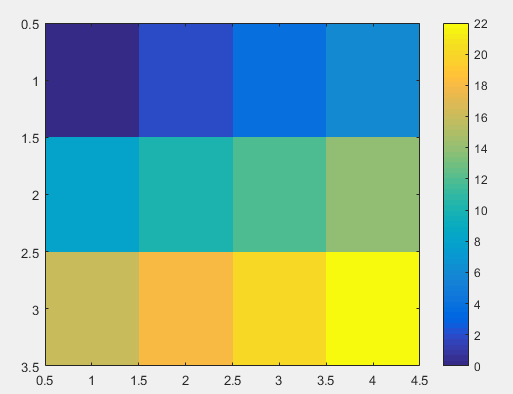
1、imagesc(A)将矩阵A中的元素数值按大小转化为不同颜色,并在坐标轴对应位置处以这种颜色染色。
clear all

C = [0 2 4 6; 8 10 12 14; 16 18 20 22];

imagesc(C)

colorbar
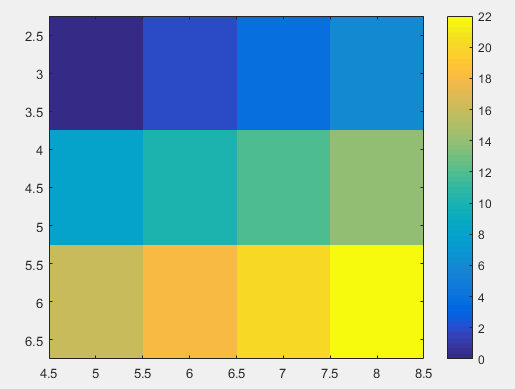
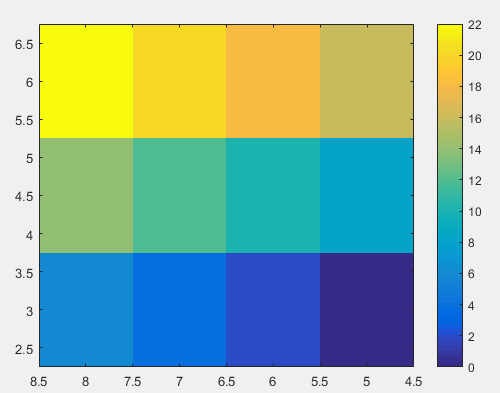
2、更改坐标轴
clear all

x = [5 8];

y = [3 6];

C = [0 2 4 6; 8 10 12 14; 16 18 20 22];

imagesc(x,y,C)

colorbar
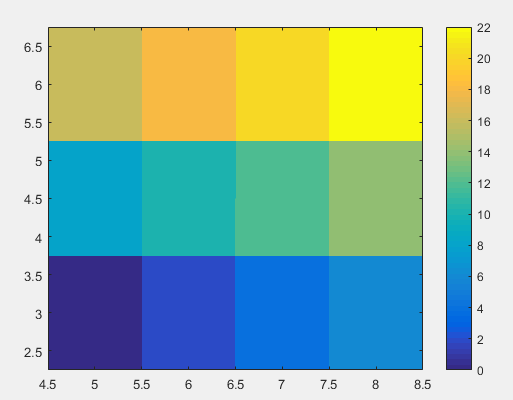
翻转y轴
clear all

x = [5 8];

y = [3 6];

C = [0 2 4 6; 8 10 12 14; 16 18 20 22];

imagesc(x,y,C)

colorbar

axis xy;
clear all

x = [5 8];

y = [3 6];

C = [0 2 4 6; 8 10 12 14; 16 18 20 22];

imagesc(x,y,C)

colorbar

axis xy%翻转y轴

set(gca,'XDir','reverse')%翻转x轴
3、限制高度
C = [0 2 4 6; 8 10 12 14; 16 18 20 22];

clims = [4 18];

imagesc(C,clims)

colorbar

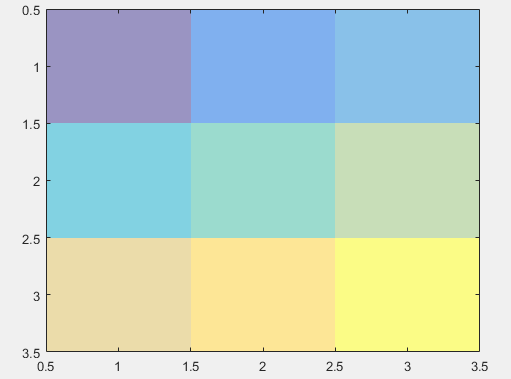
4、更改显示色调
clear

C = [1 2 3; 4 5 6; 7 8 9];

im = imagesc(C);

im.AlphaData = .5;
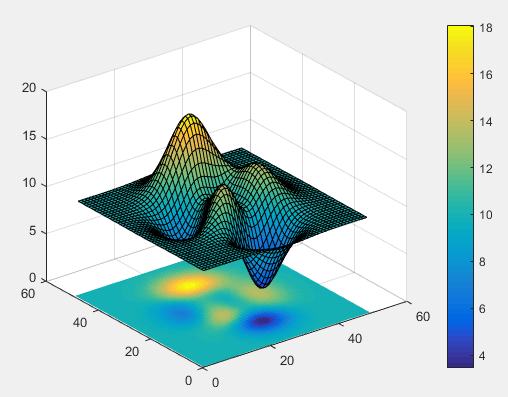
5、投影面
clear

Z = 10 + peaks;

surf(Z)

hold on

imagesc(Z)

colorbar
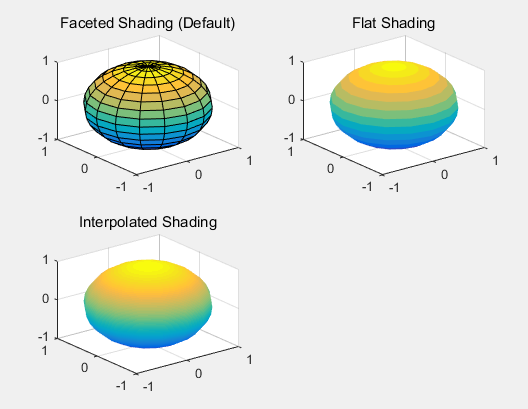
四、shading阴影函数
clear all

figure

subplot(2,2,1)

sphere(16)

title('Faceted Shading (Default)')

subplot(2,2,2)

sphere(16)

shading flat

title('Flat Shading')

subplot(2,2,3)

sphere(16)

shading interp

title('Interpolated Shading')
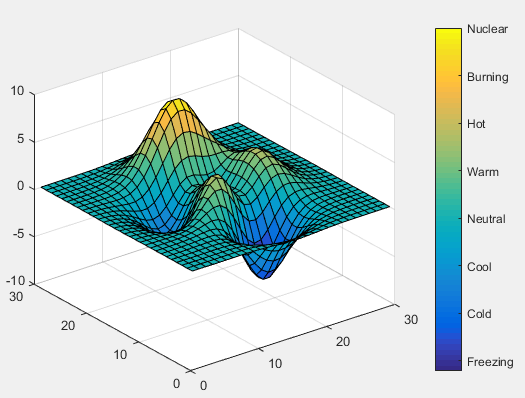
五、colorbar函数颜色
1、
close all; clear all; clc

figure(1)

surf(peaks(30))

colorbar('YTickLabel',{'Freezing','Cold','Cool','Neutral','Warm','Hot','Burning','Nuclear'})
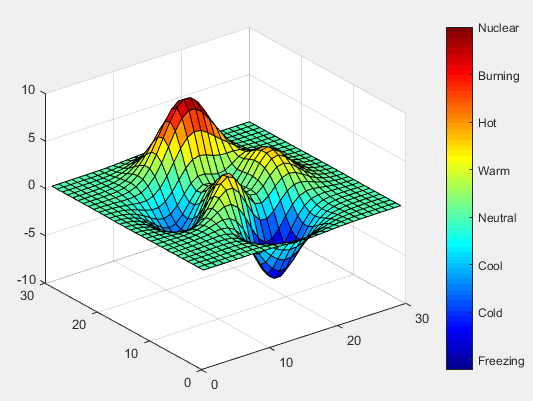
2、
close all; clear all; clc

figure(1)

surf(peaks(30))

colormap jet

colorbar('YTickLabel',{'Freezing','Cold','Cool','Neutral','Warm','Hot','Burning','Nuclear'})
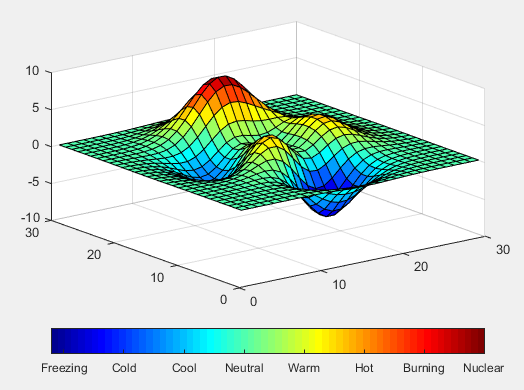
3、
close all; clear all; clc

figure(1)

surf(peaks(30))

colormap jet

colorbar('location','SouthOutside','YTickLabel',{'Freezing','Cold','Cool','Neutral','Warm','Hot','Burning','Nuclear'})
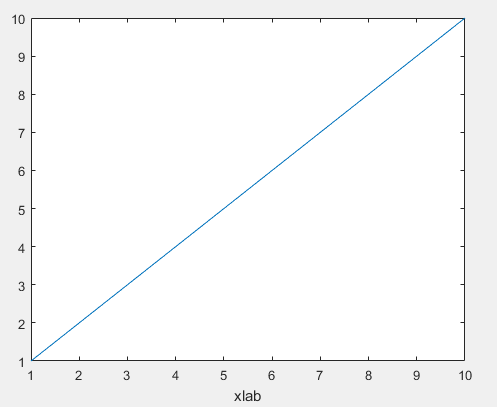
六、findobj
1、
close all;clear;clc;

plot(1:10)

xlabel xlab %x轴名称为“xlab”

disp('findobj返回的对象句柄')

h=findobj

h1=findobj('tag','figure')

MATLAB 句柄绘图的更多相关文章
- matlab的绘图保存
matlab的绘图和可视化能力是不用多说的,可以说在业内是家喻户晓的.Matlab提供了丰富的绘图函数,比如ez**系类的简易绘图函数,surf.mesh系类的数值绘图函数等几十个.另外其他专业工 ...
- MATLAB——PLOT绘图
MATLAB——PLOT绘图 格式化绘图: 1.color: b g r c m y k w blue green red cyan magenta yellow black white 2.ty ...
- Matlab 常用绘图指令(二维图形)
使用matlab的时候常常会忘掉一些指令,每次都要重新查找,挺麻烦的,这里收集一些常用的绘图指令,供自己和大家以后方便查找和使用. 1.例子-包含了常用绘图命令 clear clc %%数据准备 x ...
- Matlab高级绘图
http://blog.csdn.net/haizimin/article/details/50372630 图形是呈现数据的一种直观方式,在用Matlab进行数据处理和计算后,我们一般都会以图形的形 ...
- 关于Matlab在绘图时中文字体显示不一致的问题
我的运行环境: OS: Win10 教育版 64-bit Matlab版本:Matlab 2017a 64-bit 在使用Matlab绘图时,而横坐标轴.纵坐标轴.标题有汉字时,会发现在GUI的显示 ...
- Matlab三维绘图
三维绘图 1 三维绘图指令 类 别 指 令 说 明 网状图 mesh, ezmesh 绘制立体网状图 meshc, ezmeshc 绘制带有等高线的网状图 meshz 绘制带有“围裙”的网状图 曲面图 ...
- Matlab 三维绘图与统计绘图
一. 三维绘图 p = : pi/: *pi; x = cos(p); y = sin(p); z = p; plot3(x,y,z) x = -:.:; %有-2为起点,2为递增步长,2为终止点 y ...
- MATLAB plot 绘图的一些经验,记下来,facilitate future work
[转载请注明出处]http://www.cnblogs.com/mashiqi 2016/03/28 % 调整figure的位置scrsz = get(0,'ScreenSize'); % 这个命令是 ...
- matlab基础绘图知识
axis([xmin xmax ymin ymax]) %设置坐标轴的最小最大值 xlabel('string') %标记横坐标 ylabe ...
随机推荐
- jquery-购物车js
购物车示例js,为了方便参考,页面写的比较简单.示例如下图所示: html代码如下: <!doctype html> <html lang="en"> &l ...
- Web网页布局的主要方式
一.静态布局(static layout) 即传统Web设计,网页上的所有元素的尺寸一律使用px作为单位. 1.布局特点 不管浏览器尺寸具体是多少,网页布局始终按照最初写代码时的布局来显示.常规的pc ...
- 在 centos6 上安装 LAMP
LAMP 代表的是 Linux, Apache, MySQL, 以及 PHP. 第一步,安装 Apache 使用 yum 安装 sudo yum install httpd 启动 httpd 服务 ...
- 【Python】2.12学习笔记 变量
变量 关于变量我有一个不能理解的,关于全局变量作用域与地址的问题,学函数的时候我可能会搞懂它并且写下来 另外,其实昨天说的是有些不准确的,\(Python\)里的变量不是不用声明类型,只是声明方式特殊 ...
- IE8使用chrome内核渲染
1 第一步 https://download.csdn.net/download/qq_34626479/11223448 下载chrome frame安装包; 2 第二步 网页头部添加一行 ...
- JS实现滚动区域触底事件
效果 贴上效果展示: 实现思路 样式方面不多赘述,滚动区域是给固定高度,设置 overflow-y: auto 来实现. 接下来看看js方面的实现,其实也很简单,触发的条件是: 可视高度 + 滚动距离 ...
- 【MyBatis笔记】mapper文件的配置以及说明
<!doctype html>[MyBatis笔记]mapper文件的配置以及说明 figure:last-child { margin-bottom: 0.5rem; } #write ...
- oracle中plsql练习-----在控制台输出1到100以内的素数。
一.思路:首先需要知道素数的概念即质数定义为在大于1的自然数中,除了1和它本身以外不再有其他因数. 中心思想是,外循环所有的自然数,内循环折半查询,增加代码的速度,注意:从1开始,需要大于1,但是pl ...
- 让 Linux 防火墙新秀 nftables 为你的 VPS 保驾护航
上篇文章 给大家介绍了 nftables 的优点以及基本的使用方法,它的优点在于直接在用户态把网络规则编译成字节码,然后由内核的虚拟机执行,尽管和 iptables 一样都是基于 netfilter, ...
- MySQl数据类型和条件限制
数据库的增删改查已经介绍完毕,今天从表的详细操作开始讲解 表操作 今日内容 1.数据类型 建表的时候,字段都有对应的数据类型 整型 浮点型 字符类型(char与varchar) 日期类型 枚举与集合 ...