
matplotlib画图总结--常用功能
0、内容范围
多曲线图、图例、坐标轴、注释文字等。
1、曲线图
多曲线图、图例、网格、坐标轴名称、图标名、坐标轴范围等。
from matplotlib import pyplot as plt

import numpy as np

x = np.linspace(-np.pi, np.pi, 200, endpoint=True)

c, s = np.cos(x), np.sin(x)

plt.xlim(-np.pi, np.pi)

# p1 = plt.plot(x,c,'r', label = 'cos')

# p2 = plt.plot(x,s,'b', label =  'sin')

p1 = plt.plot(x,c,'r')

p2 = plt.plot(x,s,'b')

plt.xlabel('x')

plt.ylabel('y')

plt.title('cos and sin')

plt.legend( ['cos', 'sin'])

plt.grid(True)

plt.show()
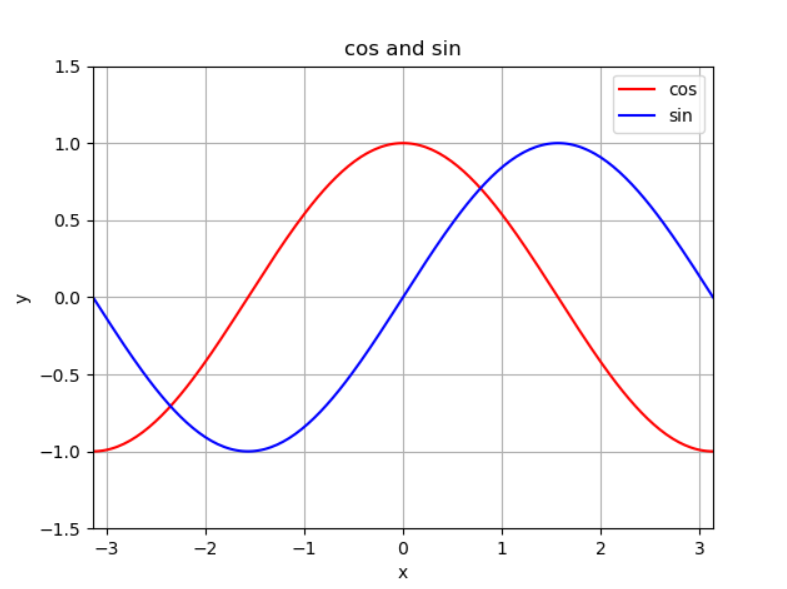
知识点:
1)一个图里绘制条曲线
方法1:
plt.plot(x,c,'r', x,s,'b')
方法2:
p1 = plt.plot(x,c,'r')
p2 = plt.plot(x,s,'b')
2)给图添加图例
方法1:
p1 = plt.plot(x,c,'r', label = 'cos')
p2 = plt.plot(x,s,'b', label = 'sin')
plt.legend()
方法2:
p1 = plt.plot(x,c,'r')
p2 = plt.plot(x,s,'b')
plt.legend( ['cos', 'sin'])
推荐使用方法1,因为方法2必须注意添加曲线的顺序。
2、柱状图
学习柱状图、为图形添加字符坐标轴.
import numpy as np

import matplotlib.pyplot as plt

N = 5

menMeans = (20, 35, 30, 35, 27)

womenMeans = (25, 32, 34, 20, 25)

menStd = (2, 3, 4, 1, 2)

womenStd = (3, 5, 2, 3, 3)

ind = np.arange(N)    # the x locations for the groups

width = 0.35       # the width of the bars: can also be len(x) sequence

p1 = plt.bar(ind, menMeans, width, yerr=menStd, label='men')

p2 = plt.bar(ind, womenMeans, width, bottom=menMeans, yerr=womenStd, label='women')

plt.ylabel('Scores')

plt.title('Scores by group and gender')

plt.xticks(ind, ('G1', 'G2', 'G3', 'G4', 'G5'))

plt.yticks(np.arange(0, 81, 10))

plt.legend(loc='upper right')

plt.show()

为什么会两个图层叠?
p1 = plt.bar(ind, menMeans, width, yerr=menStd, label='men')

p2 = plt.bar(ind, womenMeans, width, bottom=menMeans, yerr=womenStd, label='women')
bar函数的x坐标一样,并且y坐标值是bottom=menMeans,所以第二个图会堆叠在第一个图上面。
下面实现2条柱状图。
import matplotlib

import matplotlib.pyplot as plt

import numpy as np

labels = ['G1', 'G2', 'G3', 'G4', 'G5']

men_means = [20, 34, 30, 35, 27]

women_means = [25, 32, 34, 20, 25]

x = np.arange(len(labels))  # the label locations

width = 0.35  # the width of the bars

fig, ax = plt.subplots()

rects1 = ax.bar(x - width/2, men_means, width, label='Men')

rects2 = ax.bar(x + width/2, women_means, width, label='Women')

# Add some text for labels, title and custom x-axis tick labels, etc.

ax.set_ylabel('Scores')

ax.set_title('Scores by group and gender')

ax.set_xticks(x)

ax.set_xticklabels(labels)

ax.legend()

plt.show()
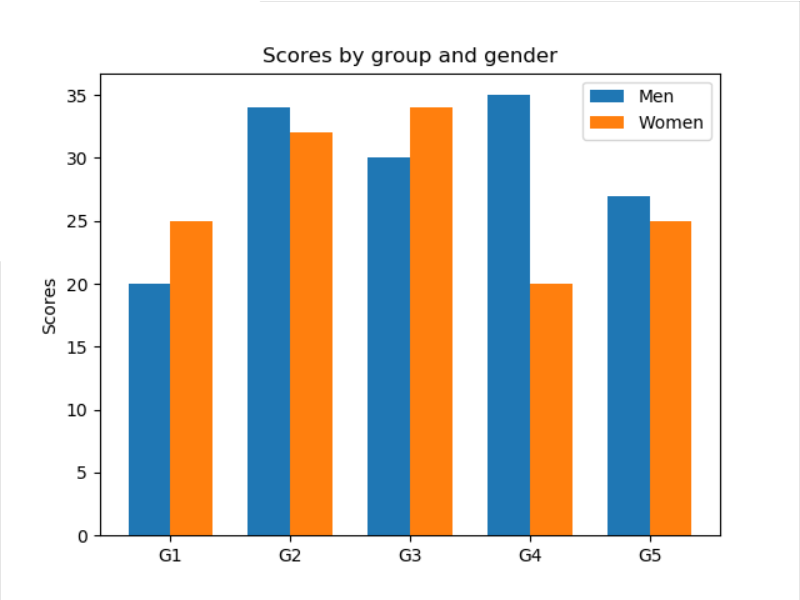
x轴的坐标不是数子,实现方法如下,先设定坐标轴的tick,然后把ticklabel改为字符值。
ax.set_xticks(x)
ax.set_xticklabels(labels)
如果需要实现水平柱状图,则使用ax.barh(y_pos, performance, xerr=error, align='center')函数。
3、添加文字、注释、箭头指示、花式文字
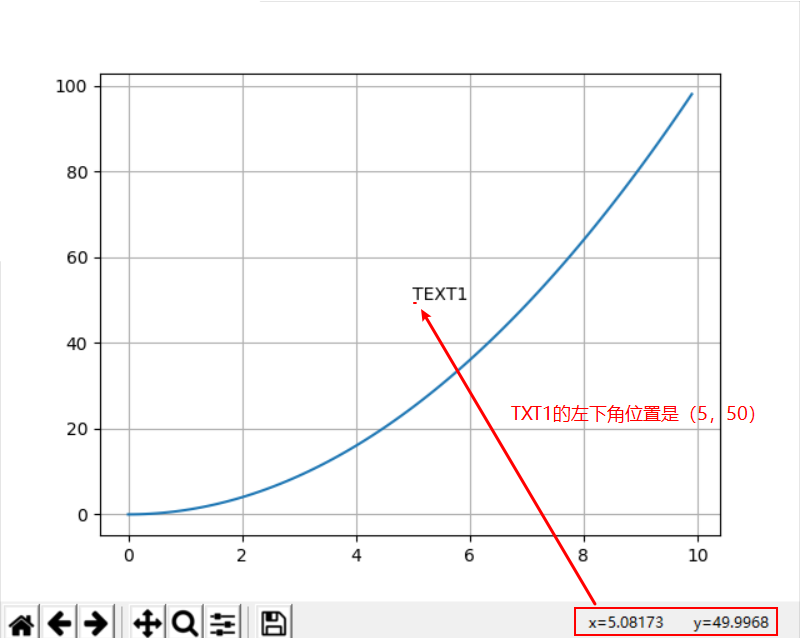
其中,text 函数可以做文本注释,且支持 LaTeX 格式,可以在图例中写公式。
text(x,y,string,fontsize=15,verticalalignment="top",horizontalalignment="right")
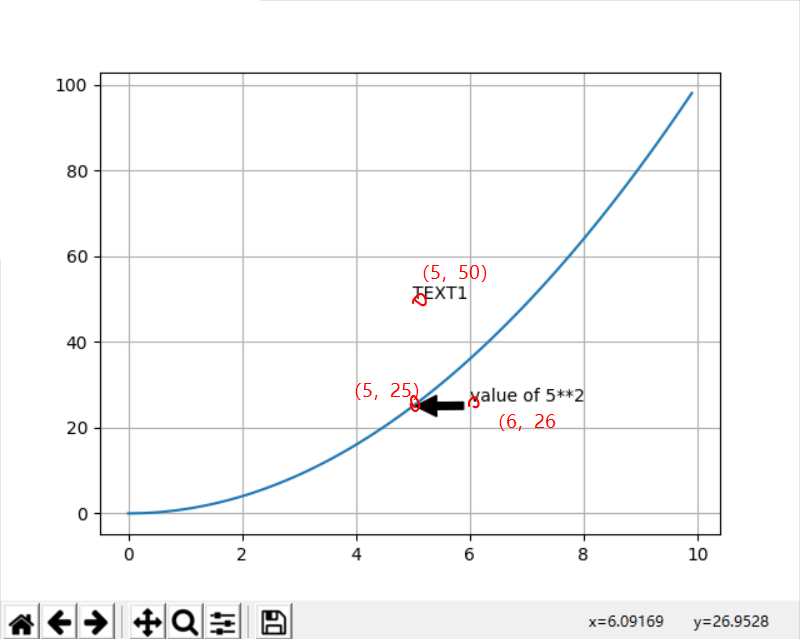
x = np.arange(0, 10, 0.1)

plt.plot(x, x**2)

plt.grid(True)  # 设置网格线

plt.text(5,50, "TEXT1")

plt.show()
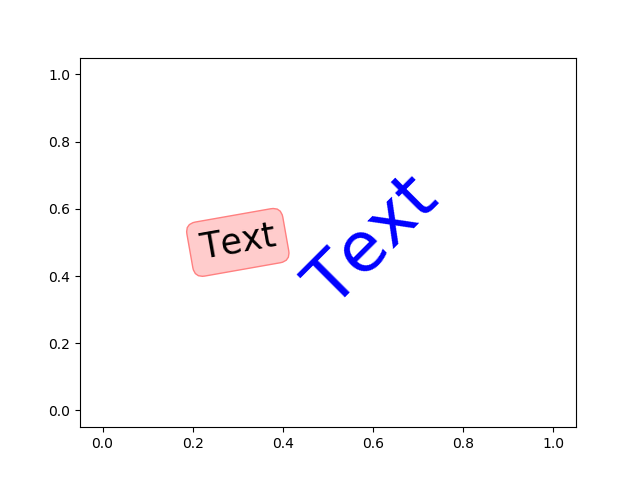
花式文本:
You can put a rectangular box around the text instance (e.g., to set a background color) by using the keyword bbox. bbox is a dictionary of Rectangle properties. For example:
>>> text(x, y, s, bbox=dict(facecolor='red', alpha=0.5))
import matplotlib.pyplot as plt

import numpy as np

plt.text(0.6, 0.5, "Text", size=50, rotation=45, ha="center", va="center", color='b')

plt.text(0.3, 0.5, "Text", size=25, rotation=10, ha="center", va="center", bbox=dict(boxstyle="round",ec=(1, 0.5, 0.5),fc=(1., 0.8, 0.8),)) #颜色ec、fc

plt.plot()

plt.show()
添加箭头和说明信息
plt.annotate('value of 5**2', xy=(5, 25), xytext=(6, 26), arrowprops=dict(facecolor='black', shrink=0.05))
matplotlib画图总结--常用功能的更多相关文章
- matplotlib 画图
matplotlib 画图 1. 画曲线图 Tompson = np.array([0, 0, 0, 0, 0.011, 0.051, 0.15, 0.251, 0.35, 0.44, 0 ...
- WebStorm 常用功能的使用技巧分享
WebStorm 是 JetBrain 公司开发的一款 JavaScript IDE,使用非常方便,可以使编写代码过程更加流畅. 本文在这里分享一些常用功能的使用技巧,希望能帮助大家更好的使用这款强大 ...
- AVA正则表达式4种常用功能
正则表达式在字符串处理上有着强大的功能,sun在jdk1.4加入了对它的支持 下面简单的说下它的4种常用功能: 查询: String str="abc efg ABC"; Str ...
- [转]WebPack 常用功能介绍
概述 Webpack是一款用户打包前端模块的工具.主要是用来打包在浏览器端使用的javascript的.同时也能转换.捆绑.打包其他的静态资源,包括css.image.font file.templa ...
- FastReport.Net 常用功能总汇
一.常用控件 文本框:输入文字或表达式 表格:设置表格的行列数,输入数字或表达式 子报表:放置子报表后,系统会自动增加一个页面,你可以在此页面上设计需要的报表.系统在打印处理时,先按主报表打印,当碰到 ...
- python3 字符串与列表常用功能
一.字符串常用功能 1. capitalize(),将字符串的首字母变成大写,其余全部置为小写:如果字符串中有多个单词,也只是将第一个单词的首字母置为大写:例: >>> name = ...
- matlab进阶:常用功能的实现,常用函数的说明
常用功能的实现 获取当前脚本所在目录 current_script_dir = fileparts(mfilename('fullpath')); % 结尾不带'/' 常用函数的说明 bsxfun m ...
- WebPack常用功能介绍
概述 Webpack是一款用户打包前端模块的工具.主要是用来打包在浏览器端使用的javascript的.同时也能转换.捆绑.打包其他的静态资源,包括css.image.font file.templa ...
- JavaScript 常用功能总结
小编吐血整理加上翻译,太辛苦了~求赞! 本文主要总结了JavaScript 常用功能总结,如一些常用的JS 对象,基本数据结构,功能函数等,还有一些常用的设计模式. 目录: 众所周知,JavaScri ...
随机推荐
- 基于 ThinkPHP5 + Bootstrap 的后台开发框架 FastAdmin
FastAdmin是一款基于 ThinkPHP5 + Bootstrap 的极速后台开发框架. 主要特性 基于Auth验证的权限管理系统 支持无限级父子级权限继承,父级的管理员可任意增删改子级管理员及 ...
- 构建大型 Vue.js 项目的10条建议
下面是我在开发大型 Vue 项目时的最佳实践.这些技巧将帮助你开发更高效.更易于维护和共享的代码. 今年做自由职业的时候,我有机会开发了一些大型 Vue 应用程序.我所说的这些项目,Vuex stor ...
- pat 1008 Elevator(20 分)
1008 Elevator(20 分) The highest building in our city has only one elevator. A request list is made u ...
- setState何时同步,何时异步,为什么?
setState何时同步,何时异步,为什么 答案:在React库控制时,异步:否则同步. 示例代码如下: constructor(props){ super(porps); this.state = ...
- 同时发起TCP连接
如果你的socket编程只限于创建SOCK_STREAM的socket,用connect-accept建立连接,然后就是recv,send.你就会惊奇tcp连接还可以不用accept. 上图为两个AF ...
- API的描述语言--Swagger
Swagger是一种Rest API的表示方式. 有时也可以作为Rest API的交互式文档,描述形式化的接口描述,生成客户端和服务端的代码. 一,描述语言:Spec Swagger API Spec ...
- think PHP 查询、更改
最近公司没有什么新项目,故准备搞搞PHP,正好后端有一些小东西需要搞一下,我就来试试吧. PHP 基于think PHP 3 实现功能: 1.为销售绑定虚拟号码分组(查询可以绑定的分组 -> 绑 ...
- Maven 无法下载依赖包的解决方法---三步dao!!!
版权声明:本文为博主原创文章,转载请附上原文出处链接和本声明. 本文链接:https://www.cnblogs.com/WLCYSYS/p/11932157.html maven 自动下载依赖包出现 ...
- drf组件之jwt认证
drf组件之jwt认证模块 一.认证规则 全称:json web token 解释:加密字符串的原始数据是json,后台产生,通过web传输给前台存储 格式:三段式 - 头.载荷.签名 - 头和载荷才 ...
- 关于虚拟机克隆之后IP重新设置
由于要搭建一套环境,本来搭建好的后来搞崩了,因为之前的虚拟机没有克隆过以及创建快照,所以今天就重新创建一套环境创建虚拟机快照,以及要解决克隆之后的IP重新设置问题. 1.查看本机orcl IP:[ro ...